How AI Predicts Baseball Win Percentages: A Practical Guide for Data-Driven Betting
I’m a sports analyst who leans on AI to translate the absolute chaos of an MLB season into clear, actionable win percentages. The goal isn't just to throw random machine learning algorithms at a spreadsheet and hope for the best. It’s about pulling clean data, engineering features that actually matter, and building models that hold up under the pressure of a full 162-game schedule. I’m going to show you the practical steps, the tools I use, and the sanity checks you need to make sure your predictions actually hold up pregame and in-game, rather than just looking good on paper. This is about building a workflow that is reliable, scalable, and grounded in the reality of the game. When you dive into the nuances of the sport, you will quickly discover how ai predicts baseball scoring is a masterclass in separating signal from the noise.
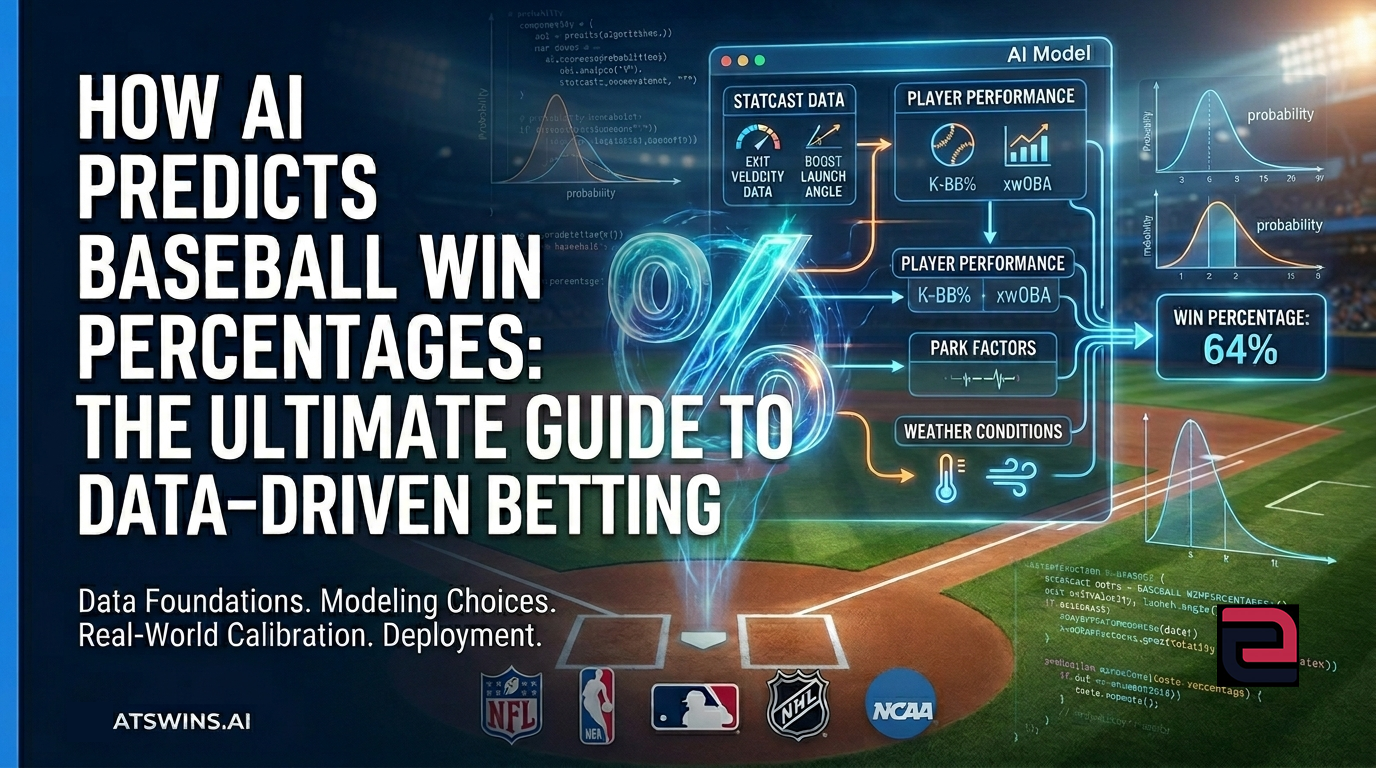
Data foundations for how AI predicts baseball win percentages
Accurate win percentages start with clean, timestamped inputs. If your data is late, mis-specified, or merged after the fact, everything downstream will drift. At ATSwins , we lean on a small set of stable sources and a repeatable ingestion flow so our pregame and in-game models are never guessing blind. You really need to focus on Statcast quality-of-contact and movement data. This means pulling exit velocity, launch angle, hard-hit rates, barrel rates, spin rate, release extension, and vertical and horizontal movement. You’ll use these to build batter and pitcher level expected metrics and matchups. Baseball Savant is the gold standard here. You also need event-level box scores and play-by-play data. This is for backfilling every pitch, plate appearance, substitution, and run-scoring event with precise timestamps. This is critical for live win probability curves and tracking bullpen leverage history, and Retrosheet is your best friend here.
Beyond the raw stats, you have to account for the environment. You need multi-year rolling park factors for wOBA, home runs, and BABIP, plus handedness splits by park. Regress these to the mean early in the season to avoid overreacting to small samples. Weather data is equally vital. Think about temperature, humidity, wind speed, and direction relative to the field orientation. Air density makes a massive difference in flight carry and breaking ball movement. Don't forget travel and rest. Keep track of team flight or drive distance, the number of time zones crossed, days since the last game, and bullpen days since the last appearance. Finally, look at umpire and lineup cards. Umpire strike-zone tendencies by count and handedness are a hidden gem, and official lineups and scratches are obviously crucial for pregame runs while substitutions drive your live updates. Use programmatic pulls like pybaseball and keep a simple data lake using parquet files partitioned by season and date. Keep your job orchestration boring and reliable using something like cron or Airflow. Build daily jobs that pull the prior day Statcast and box scores to catch late-night finalizations, update your rolling park factors, and store raw and curated tables with an explicit snapshot time. Build intraday jobs that poll for lineup changes, scratches, umpire assignments, and live pitch-by-pitch data with minimal latency.
Win percentages depend entirely on context. Your model should know the state of the game and only see information that would have been available at the moment of the prediction. For pregame features, look at your starting pitchers and their recent form, specifically rolling five, ten, and twenty-start xwOBA allowed. Stabilize those small samples with priors. Look at their arsenal and command, including zone percentage and chase rate. Velocity and movement deltas compared to the prior month can often flag fatigue or mechanical tweaks before anyone else notices. For bullpen leverage history, use a rested arms index that combines pitch counts from the last three days with leverage entries. Tier your bullpen by quality, looking at high, middle, and low-leverage ERA or xwOBA per pitcher. For hitters, look at platoon splits and contact quality. For defense, use a team composite like Outs Above Average combined with catcher framing metrics. In-game features update every pitch or half-inning. These include state variables like the inning, score differential, base-out state, and outs remaining. Keep a close eye on pitcher status like pitch count trends, times through the order, velocity fade, and whiff rate evolution. Weather shifts, like a temperature drop or wind change, can alter ball carry, and you need to monitor who is warming up in the bullpen to adjust your win probability in real-time.
Timestamping every single row is the only way to avoid the silent killer of model development: leakage. Label leakage looks subtle, but it completely ruins your calibration. When you are training pregame models, you absolutely cannot allow any feature that became known after the first pitch. Likewise, for an in-game model at pitch $t$, you cannot use the outcome at $t+1$. Stamp every raw event with a UTC event time and a unique game ID. Create snapshot tables that represent exactly what you knew at that specific moment. When you backfill, make sure it doesn't cross the prediction boundary. If you can compute a feature using yesterday's database snapshot, you are likely in the clear. If the distribution of a feature changes based on future scoring, it is almost certainly leaking information. When you shuffle time, your performance should not stay suspiciously high; if it does, you were probably peeking.
Modeling choices that actually work
Logistic regression is honestly the most underrated workhorse for pregame probabilities. It is fast, highly interpretable, and tends to be well-calibrated with minimal tuning. With meaningful, scaled inputs like park-adjusted xwOBA splits and bullpen availability, you can land inside a few percentage points of the market closing line surprisingly often. Regularize your models with L2 to prevent overfitting and make sure you standardize your continuous features. Use interaction terms sparingly, such as checking for the interaction between velocity trends and air density. Always examine your coefficient signs to make sure they pass the smell test. For example, a stronger bullpen should objectively increase your win probability. We still calibrate after training because even good logistic models can drift in the early season or when MLB changes rules. Isotonic regression and Platt scaling are simple, effective fixes for this.
When you want to capture nonlinear relationships and complex interactions between features without doing manual feature engineering, look at gradient-boosted trees and random forests. XGBoost is incredibly powerful on tabular data and it handles missing values well. You need to tune parameters like the learning rate, max depth, and subsample rate, and use early stopping with a time-based validation fold. This is perfect for mid-game models where pitcher fatigue interacts with lineup depth and base-out leverage. Random forests are more stable and less tuning-heavy, making them a great baseline, though they are often less sharp than boosted trees for subtle signals. No matter which you choose, document your feature importance with SHAP values. This helps you understand how each variable moves your win probability and, more importantly, helps you catch nonsense artifacts in your data pipeline. This is not just for show; it helps you explain your picks to users who value transparency. If you find yourself needing a more granular forecast, an AI MLB run projection model can offer insights that purely win-based models might overlook.
Purely player-level models can be noisy, and purely team-level Elo models can miss matchup granularity. You should blend them. Update your team Elo after each game using the margin of victory, the quality of the opponent, and home-field advantage. Track your offense and pitching components separately. For pitcher priors, set a baseline for each SP and RP from multi-year xwOBA, Stuff+, and command proxies. Regress early-season results toward that prior and widen your uncertainty bands whenever you see an injury or a velocity dip. You can also explore Poisson run models, which model total runs scored and allowed to integrate into a game win probability. This is great for derivative markets like totals or alternate lines. At the end of the day, no single model sees the whole picture. We ensemble these methods by using a meta-model or a weighted average. Always track your ensemble spread and flag games where your models disagree by more than four to six percentage points.
Training, evaluation and calibration in the real world
Random splits for your data do not make sense in baseball because the games are time-ordered. You must use walk-forward validation. Choose a backtesting horizon and only use rolling features that would have existed at the exact time of the prediction. If a batter’s rolling xwOBA is using future at-bats, it is a leak and you need to fix it. For live models, simulate predictions at every single game state in chronological order and store those results for scoring. Evaluate your pregame and in-game models separately because they face different constraints and adverse selection dynamics. For pregame, compare against the market close and simple baselines. For in-game, evaluate within specific score states and innings to ensure your calibration holds up under high-leverage situations.
For probability forecasts, focus on Brier scores and log loss. AUC is fine for ranking, but bettors need calibrated probabilities, not just ordering. The Brier score is the mean squared error between your predicted probability and the actual outcome, and a lower score is better because it is sensitive to calibration. Log loss is great for edge detection hygiene because it penalizes overconfident wrong predictions quite harshly. Aim for a steady Brier improvement over naive baselines like a home-field-only model. Even the strongest learners will drift, so run reliability plots every single month. If you see S-shaped deviations, Platt scaling might help, but for monotonic and uneven curves, isotonic regression is usually the way to go. Fit these mappings on a validation slice rather than the training fold, and refit them throughout the season if you notice drift.
Compare your work against naive baselines, not just your perception. A credible model should consistently beat a simple home team baseline with fixed HFA, Elo-only forecasts, or the bookmaker's opening line. Do not cherry-pick your games. Use a rule-based approach and score every single game the model covered. If you need a refresher on how to convert sportsbook numbers into fair probabilities, check out our explainer on that topic. Remember that for tree-based models, SHAP values are your best friend. We have caught countless ETL issues because of SHAP. If the umpire zone index suddenly dominates in April, pause and check your data ingest. It is almost always a sign of a mis-specified merge or a bad data fallback. When analyzing the betting markets specifically, AI baseball over under predictions often rely on the same fundamental data, but require a distinct focus on how run environments interact with bullpen depth and late-game substitution patterns.
Deployment, monitoring and upkeep
Latency and correctness are more important than being clever. A simple, reliable pipeline always wins. Poll your lineup and scratch feeds every few minutes and invalidate your cached pregame predictions as soon as a starter changes. Patch missing Statcast fields with prior-game estimates and mark those with uncertainty flags so the user knows what is happening. Keep a clear event ledger of any manual overrides you make, such as for an official weather delay. For your pregame service, cache baseline probabilities on the schedule release and refresh them hourly. On lineup lock, recompute within 30 to 60 seconds and propagate that to your API and UI. For in-game, stream updates on state changes like a new pitch, an out, or a base runner move. Aim for a p95 latency of less than two seconds. If the data is delayed, show the last update time clearly to the user.
Not every one or two percent edge is worth trading. You have to tie your decision thresholds to real-world frictions like market spreads, vigorish, and line movement risk. For pregame sides, only act when the edge is significantly higher than the market friction, usually around two and a half to three and a half percent depending on liquidity. For live betting, require wider edges early in the game when there is more volatility and narrower edges late when there is less time for variance to play out. Monitor for model residual spikes by team or pitcher, and set alerts for SP velocity drops of more than one to one and a half miles per hour week over week. If you notice a model is overconfident at altitude or during humid night games, introduce context-aware calibration or better features like a custom air density index.
Version everything you do so you can reproduce it. You cannot fix what you cannot replicate. Version your data snapshots by date and source checksum. Version your feature code and your model artifacts with hashes and metadata. Store every training configuration, every set of hyperparameters, and your calibrator mappings. Keep a backtest registry that links inputs, outputs, metrics, and references to the specific data used. When someone asks why Team A was projected at 57% last Tuesday, you should be able to produce that exact 57% result again without breaking a sweat.
How ATSwin-style workflows connect the dots for bettors
ATSwins is built to turn these complex modeling pieces into simple, informed decisions. That means data-driven picks that are timestamped, model-attributed, and properly calibrated. We provide player props derived from that same run environment and quality-of-contact data, and we provide betting splits and profit tracking so you can see what is working. Two realities shape our approach. First, we don't chase every single edge. We prefer high-caliber, explained probabilities with proper calibration over volume. Second, we publish context. If a pick is anchored by a bullpen rest advantage or a specific starting pitcher velocity bump, we will tell you that. If you are aiming to run a similar playbook on your own, this framework is entirely adaptable.
Use a logistic regression pregame as your anchor and calibrate it monthly. Add a light XGBoost mid-game model for those stateful interactions. Blend an Elo or Bayes team rating with pitcher priors to stabilize those shaky early-season edges. Track your calibration and your residuals, not just whether a pick won or lost. The key is to keep the pipeline clean and the features focused on what actually drives run scoring in the modern game.
Practical, step-by-step build: from raw data to a live win percentage
To start, you need to stand up your data pipelines. On a nightly basis, pull the Statcast data from the last three days and rebuild your batter and pitcher rolling windows. Make sure you have minimum plate appearance and batters faced constraints so you aren't basing decisions on one or two plate appearances. Update your park-factor tables using a three-year weighted average that prioritizes recent data, and store everything as parquet files partitioned by season and date. Intraday, poll your lineups, weather, and umpires every five minutes. Cache your predicted implied totals using your Poisson run model as a quick sanity cross-check.
Next, design your pregame features with priors. Start with an SP prior strength based on xwOBA allowed and K-BB percentage, regressed 60% to 80% to the multi-year mean if you have low samples. Compute the offense vs RHP/LHP park-adjusted xwOBA for the confirmed lineup. Build a bullpen availability index that weighs the last three days' pitch counts and rest days. Add park and weather adjustments, incorporate travel and rest penalties, and use Team Elo offense and pitching as separate, clean inputs.
Train a baseline logistic regression using the last three to four seasons with walk-forward validation. Features should include your SP prior strength, offense vs hand xwOBA, bullpen availability, park factor, weather, Team Elo, and a home flag. Calibrate this on a holdout set via isotonic regression. Score it using Brier and log loss and store your reliability plots. Once that is set, add a nonlinear learner like XGBoost. Feed it the same features plus interactions you didn’t want to handcraft manually, such as times through the order counts, SP velocity trends interacting with weather, and lineup depth metrics. Tune this with early stopping on a time-based validation set and produce SHAP summaries to review for sanity.
Add an Elo or Bayes blend and an optional Poisson prior. Train and update your team strengths daily, maintaining separate offense and pitching ratings. Build a Poisson expected runs model to produce a win probability by integration. For your ensemble weights, start equal, then use a backtested optimization with a cap so no single component dominates. Build your in-game states by encoding the inning, score differential, base-out state, and leverage index. Add pitcher fatigue proxies like pitch count, times through the order, velocity drift, and whiff trends. Update your bullpen availability in real-time. Generate your live win probability by blending historical state win expectancy with your model’s context-specific adjustments, and smooth that with exponential decay to avoid wild, nonsensical oscillations.
Finally, validate, calibrate, and set your thresholds. Backtest pregame and in-game separately. Calibrate each monthly slice. Set your action thresholds based on market cost and uncertainty. Document any context-specific miscalibrations and patch them. Deploy your inference service as a container, keeping models colocated with a feature store cache. Perform regular health checks for data timeliness, non-null feature counts, and distribution drifts. Alert yourself on injury or velocity shocks so you can pause edges or widen thresholds automatically. For each published probability, show the current number, the prior 24-hour drift, and the confidence band. Summarize two or three key drivers like a bullpen advantage or an SP velocity uptick so the user understands the "why" behind the probability. Track the realized calibration post-game and update your dashboards for users.
Templates and tools you can copy today
Your pregame feature checklist should always include, at a minimum, the starting pitcher's prior xwOBA allowed and K-BB percentage, the lineup-weighted offense vs hand xwOBA, bullpen availability, high-leverage quality, the park factor, the weather carry index, team Elo offense and pitching, and travel and rest indicators. It is nice to have defensive metrics like Outs Above Average, catcher framing data, and SP release consistency metrics. If you have it, add an umpire zone index.
Follow the leakage checklist religiously. Ensure all feature timestamps are less than or equal to the prediction time. Never use post-first-pitch stats for a pregame model, never use later substitutions in your live predictions, and only incorporate market data if it was known at the prediction time. Track your metrics daily with a 7-day and 30-day moving window. Monitor your calibration buckets by park, month, and temperature bands. Check your edge realization against the closing line and against the live line mid-game. For tools, use Baseball Savant for Statcast data, Retrosheet for event-level game logs, pybaseball for programmatic data extraction, and scikit-learn or XGBoost for your modeling and calibration.
Notes on common pitfalls and fast fixes
Early in the season, you will deal with small samples. Expand your prior weight and cap the effect sizes from two-week stretches. Defer to team-level and pitcher priors and reduce the volatility of your platoon splits. If you encounter injury or role uncertainty, use uncertain role flags to widen your confidence bands and raise your decision thresholds. If a closer is traded or injured, suppress that bullpen quality score until the new roles are established. Park factor drift happens, so recompute it monthly with a regression to a multi-year mean. Be wary of temporary stadium construction or weird wind patterns; use weather actuals heavily here. If you find yourself overfitting to rare game states in your in-game model, pool those states by combining similar base-out states using a leverage proxy. Add Bayesian smoothing for low-frequency contexts. Finally, if you see calibration decay during heat waves or cold snaps, train a context-aware calibrator that specifically ingests air density.
How all of this meets the bettor where they are
This system provides pregame edges you can actually plan around. By publishing probabilities and edges early and refreshing them on lineup lock, you can see how edges evolve rather than just looking at an isolated, static number. We provide live edges that respect the reality of the game. Our in-game win probability aligns with base-out leverage and actual bullpen reality, not just vibes or a generic win expectancy chart. We offer transparency and profit tracking so you can see the drivers and the confidence behind every single pick. We track the calibration of our picks, not just the ROI, because ROI follows calibration over time. ATSwins is an AI-powered sports prediction platform offering data-driven picks, player props, betting splits, and profit tracking across the NFL, NBA, MLB, NHL, and NCAA. Our free and paid plans give bettors insights and guides to make smarter, more informed decisions.
Conclusion
We have explored how AI turns raw MLB data , situational context, and rigorous calibration into steady, actionable win percentages. The key points to remember are that you must prioritize clean, time-stamped inputs, demand honest evaluation through walk-forward testing, and implement fast in-game updates that account for the state of the game. Now it is time to put this into practice. Test your features, track your results, and iterate on your models. For help with any of this, ATSwins is an AI-powered sports prediction platform offering data-driven picks, player props, betting splits, and profit tracking across the NFL, NBA, MLB, NHL, and NCAA. Our free and paid plans give bettors insights and guides to make smarter, more informed decisions.
Frequently Asked Questions (FAQs)
What does “how AI predicts baseball win percentages - simple steps” actually mean?
It means breaking the workflow into five plain steps so you can follow along: collect clean, time-stamped MLB data; build context features; train a calibrated model; test it honestly; then update fast pregame and in-game. In practice, I pull pitch and batted-ball data from sources like Baseball Savant and play-by-play from Retrosheet. I engineer simple but powerful signals such as starter form, bullpen usage, platoon splits, park and weather, and lineup quality. I fit a model that outputs a win probability, then check calibration so that when the model says 60%, it really lands close to 60 out of 100 over time. Last, I refresh the inputs as news hits—confirmed lineups, scratches, rain delays—so the odds stay live and real.
Which stats matter most in how AI predicts baseball win percentages - simple steps?
Start with the pitcher and the bullpen. A starter’s recent form, specifically K-BB percentage and ground-ball rate, along with their pitch mix and platoon splits, move the needle more than almost anything else. Then consider bullpen freshness and leverage history, as that decides everything from the sixth to the ninth inning. Add lineup strength, including wRC+, injuries, and handedness order, and defense and base running. Context is huge, specifically park factors and weather like air density and wind. Game state also matters, including the score, inning, and outs. Keep it simple: pitcher quality, lineup context, run environment, and fatigue. Those four cover a lot of the edge without overfitting. For raw inputs, I like Baseball Savant, Retrosheet, and weather from the National Weather Service.
Can I apply how AI predicts baseball win percentages - simple steps during live games?
Yes. It is the same core setup, but it is faster and a bit noisier. You feed the current game state, including the inning, score, base-out state, and pitcher count, then update win odds using run expectancy and bullpen availability. The simple steps hold: keep the data clean, the features current, and the model calibrated; just do it in near real-time. Even basic features like who is up next, the platoon edge, pen status, and the park or weather go a long way. If you are tracking on your own, refresh with official play-by-play and confirmed lineups from league feeds, and watch for injury news. Latency matters, as a 30-to-60-second lag can swing risk and reward, so do not over-promise precision in the final moments of a pitch.
How do I know the model is trustworthy in how AI predicts baseball win percentages - simple steps?
Check two things: accuracy and calibration. For accuracy, log loss and Brier score tell you if your probabilities are sensible, not just if your wins or losses are correct. For calibration, bin your predictions and verify the actual hit rate. If your 60% bucket wins about 60% of the time over hundreds of games, you are doing well. Use walk-forward testing by date to avoid peeking into the future and always separate your pregame and in-game backtests. Keep a simple baseline, like Team Elo plus park, so you do not fool yourself. Track results by park and weather to catch drift. It is not perfect, as no model is, but steady calibration plus small, stable gains beats flashy spikes every time.
How does ATSwins use how AI predicts baseball win percentages - simple steps, and what do I get?
We stick to the same simple steps at scale. We collect verified data, build context-rich features, run calibrated models, and update quickly as news hits. Inside ATSwins.ai, you get more than just MLB win percentages. ATSwins.ai is an AI-powered sports prediction platform offering data-driven picks, player props, betting splits, and profit tracking across the NFL, NBA, MLB, NHL, and NCAA. Our free and paid plans give bettors insights and guides to make smarter, more informed decisions. Practically, that means clear probabilities, transparent trends, and easy-to-read dashboards so you can act instead of guessing.