The Ultimate MLB Probability vs Price Betting Strategy: Mastering Value in Baseball Markets
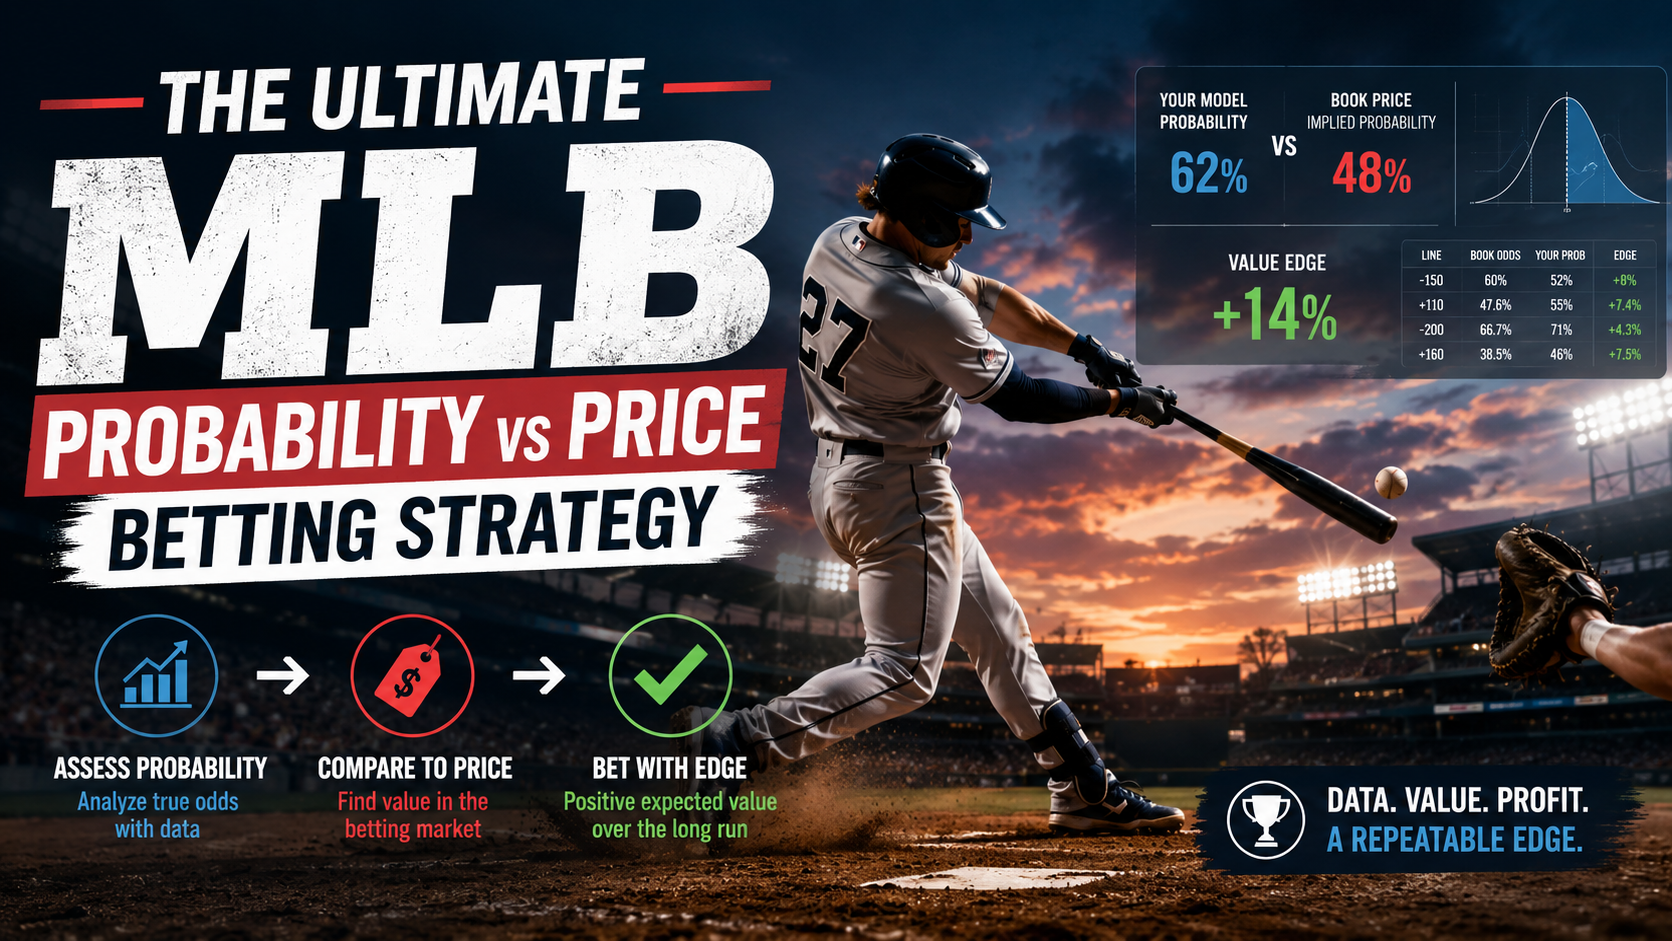
Markets move at a blistering pace in the world of Major League Baseball, but true sustainable value only reveals itself when the price and probability fail to align. As a professional sports analyst who heavily relies on sophisticated AI modeling, I am going to show you exactly how to convert raw odds into fair chances, identify hidden edges on moneylines or run lines, and size your wagers with ironclad discipline. This approach ensures you make smarter and more calculated decisions across the grueling marathon of a 162 game season. The goal is to move away from guessing who will win and move toward calculating what a win is actually worth in the current market.
Table Of Contents
- Framing price vs probability in MLB markets
- Converting odds to probabilities and finding edge
- Modeling MLB win probability
- Bankroll management and bet sizing
- Execution, monitoring, and continuous improvement
- A step-by-step example: from price to bet size
- Odds-to-probability quick reference
- Practical tips to keep the loop fast and honest
- What separates sustainable MLB edges from lucky streaks
- Conclusion
- Frequently Asked Questions (FAQs)
Key Takeaways
Bet the price and not the teams. You should only fire a wager when your model win percentage beats the market fair probability by a clear margin. Usually, you want an edge of 1% to 2% because even tiny price movements matter significantly over time. Always convert your odds to implied probability and remove the vig before making a move. Tracking your expected value and closing line value is the only way to ensure you are actually learning what works. Bankroll management is your first priority. Use a fractional Kelly Criterion, typically a half Kelly, and cap your risk per game and per day. You should also trim your sizes when variance jumps or when your picks are highly correlated. Build and check your model constantly. Source reliable data from places like the official MLB standings and validate out of sample. Keep your features simple, focusing on starters, bullpens, parks, weather, and platoons, before you try to add too much flair. ATSwins is an AI powered sports prediction platform that offers data driven picks, player props, betting splits, and profit tracking across the NFL, NBA, MLB, NHL, and NCAA. Their free and paid plans give bettors the insights and guides needed to make much more informed decisions.
Framing price vs probability in MLB markets
Define the goal and the core markets
The dynamic between price and probability is the only lens that actually matters in the MLB betting landscape. The job of a serious bettor is fundamentally simple: place a bet only when your estimated game level win probability is greater than the fair probability of the market at the price you can actually obtain. If your calculated number is better than the market fair number by enough to overcome fees and slippage, you have a viable bet. If it is not, you simply pass. You must apply this logic to the core markets. The moneyline is the most liquid market with a clean mapping between price and win probability. The run line, typically set at -1.5 or +1.5, involves more variance but is highly exploitable if your run distribution is modeled correctly. You can also look at derivative props like the first five innings, team totals, or pitcher strikeout counts, but use these only where you have targeted edges and enough historical data to calibrate. You do not need extra noise in your process. Work with the prices, model your probability, strip out the house edge, and then act.
Why implied probability and vig matter
Books quote their prices in odds, but your decisions must live in the world of probabilities. Converting odds to implied probability and then removing the bookmaker hold, or the vig, allows you to find the market fair probability. Only then can you compare your model probability on an even playing field. You also need a way to benchmark the screen. I personally prefer a no vig consensus fair probability built from several reputable sportsbooks . When I am moving quickly, I will still check a single book fair number, but you have to keep in mind that the hold can hide a lot of information. If you are already utilizing ATSwins for your daily process, that price vs probability loop becomes significantly faster. You can pull the daily board, compare the fair prices to your specific model, and then log the decision on each edge. If you want a quick snapshot of the slate, you can check the live matchups on the MLB page and click into individual games to see how the market is trending.
Converting odds to probabilities and finding edge
Odds conversion (American and decimal)
You need to perform two quick conversions on a constant repeat. To turn American odds into implied probability for favorites, take the absolute value of the odds and divide it by the absolute value of the odds plus 100. For underdogs, take 100 and divide it by the odds plus 100. To convert American odds to decimal, a -130 favorite has a decimal of about 1.769, while a +150 underdog has a decimal of 2.50. You should memorize a few quick checkpoints. For instance, -110 implies a 52.38% win probability, while +150 implies exactly 40.00%. If your price feed is already in decimal form, the probability is just one divided by the decimal.
Removing the vig on two-way lines and cross-book consensus
On a standard two way moneyline, books price both sides with a built in hold. To find the fair probability, you must convert both sides to implied probabilities and then normalize them so they sum to 100%. For example, if the Yankees are -120 and the Red Sox are +110, the raw probabilities sum to 1.0217. By dividing each by that sum, you find the fair probability for the Yankees is actually 53.41%. Now your model can be compared directly to that fair market price. For an even better reference, build a no vig consensus by taking three to six books you trust, removing the vig for each, and averaging them. This averaged fair probability becomes your hurdle rate for the day.
Computing edge, EV, and decision rules
Your edge is simply your model probability minus the fair market probability. To calculate your expected value per dollar staked, you multiply your model probability by the potential profit and subtract the probability of losing. You should only place a bet when your edge is at least 1 or 2 percentage points on a liquid moneyline. If you are dealing with thin derivatives or paying higher fees, you must push that threshold even higher. Always ensure your expected value is positive after applying the actual price you are getting filled at. Before clicking the button, ask yourself if you have a clean no vig fair probability and if your model has been calibrated recently. You should also check for correlated exposures that might push your portfolio risk too high.
Modeling MLB win probability
Inputs that move the needle today
When you are looking at what actually swings game level win probability, a few factors stand out. Starting pitchers are the biggest drivers, specifically metrics like velocity, pitch mix changes, and rest. The bullpen is also critical, especially when you factor in leverage roles and high stress pitch counts over the last few days. You also have to account for lineups and platoon splits. Looking at the official New York Yankees roster or any other team roster can help you track who is actually available to hit. Other factors include park dimensions, weather conditions like wind speed and humidity, and defensive framing. Even travel and scheduling can play a role, such as a team flying through time zones for an early start.
A transparent baseline model and upgrades
If you need an auditable model to get started, build a logistic regression that outputs home win probability. Use features that approximate run prevalence like starting pitcher xERA deltas and team weighted runs created plus. You can also include park factors and a weather summary index. Once that is stable, you can upgrade to a Bayesian hierarchical model using PyMC. This allows you to capture uncertainty that can feed into your bet sizing. If your model has larger error bars on a specific game, you can automatically reduce your stake to protect your bankroll. Minimum daily plumbing should involve ingesting morning projections and then refreshing everything 60 to 90 minutes before the first pitch when the lineups are confirmed.
Bankroll management and bet sizing
Fractional Kelly in practice
The Kelly Criterion exists to size your advantage relative to the risk of ruin. In the world of MLB betting, you almost always want to use a fractional version. This means your stake is a fraction of the full Kelly amount, usually between 0.25 and 0.50. For example, if your model gives you a 5.41% expected value on a game, a half Kelly might suggest a stake of 2.84% of your total bankroll. However, if the price worsens and your expected value drops to 0.98%, your suggested stake would drop to about 0.56%. Letting the price dictate the size of your wager will keep you honest and drastically reduce the likelihood of significant regret during a losing streak.
Caps, correlation, and volatility tracking
Even the best mathematical formulas need guardrails. You should have a per game cap where you never stake more than 1% or 2% of your bankroll on a single side. Your daily max risk should be capped at 5% to 10% of your bankroll depending on your personal tolerance for variance. Be wary of correlation. If you are betting the moneyline and the run line on the same team, you are double dipping on the same outcome. In these cases, you must reduce your Kelly fractions. It is also helpful to have a stop loss protocol. If you lose a certain number of units in a week, reduce your sizes by half for a few days to avoid the temptation of tilting or chasing losses.
Execution, monitoring, and continuous improvement
End-to-end daily workflow
Your daily workflow should be an assembly line. Start in the morning by updating pitcher and bullpen flags and merging park constants with weather forecasts. Generate your initial model probabilities and tag any watch games that are close to your edge threshold. Throughout the midday, monitor price changes and look for moves of 5 to 10 cents. Once lineups are confirmed shortly before lock, refresh your model one last time and place your bets. After the games are over, reconcile everything by updating the closing lines and marking your results. This constant feedback loop is what allows you to see if your fair numbers align with what the market respected at the close.
Monitoring drift and reconciling to close
Every week you should sit down and review your performance. Look at your calibration by probability bucket to see if there are areas where you are consistently overconfident. Check your closing line value distribution. If you are consistently beating the closing line by 5 cents or more, your process is likely very strong. If you are regularly off the market by a wide margin, you need to investigate if your features are drifting. Perhaps the league run environment has shifted or your bullpen fatigue proxy is lagging behind the reality of the game. You should always fix the core model rather than chasing the symptoms of a few bad days.
A step-by-step example: from price to bet size
Let us walk through a real world example. Imagine the Braves are -135 and the Mets are +125. After removing the vig, you find the fair probability for the Braves is 56.39%. Your model, after adjusting for the confirmed Braves starting lineup, gives them a 58.00% chance to win. This gives you an edge of 1.61 percentage points. Your model fair decimal price is 1.724, but you can actually bet it at -130, which is a decimal of 1.769. Your expected value is 2.6%, which clears your threshold. Using a half Kelly, you calculate a suggested stake of 1.69% of your bankroll. You log all of this data and wait for the game to close. If the line closes at -140, you have gained 10 cents of closing line value, which is a massive long term win regardless of the game final score.
Odds-to-probability quick reference
Having a few anchor points in your head will help you catch value errors in real time without needing a calculator. For favorites, -110 is 52.38%, -120 is 54.55%, and -150 is 60.00%. For underdogs, +110 is 47.62%, +130 is 43.48%, and +150 is 40.00%. If you see a price jump that looks out of whack with these percentages, it is a signal to dig deeper into the data.
Practical tips to keep the loop fast and honest
Build your systems small and ship them often. Start with a simple baseline and only add complex layers once you have proven the foundation is calibrated. You must trust but also verify your edges. If a model says a team should be a much heavier favorite than they are, ask yourself why the market disagrees. Is there a velocity dip in the pitcher that you missed? Is the wind blowing in harder than your forecast suggests? Always bake in a little bit of slippage for your expected value math and avoid chasing steam unless your model says there is still value. Most importantly, never ignore the lineups. A late scratch can turn a great bet into a break even proposition in seconds.
What separates sustainable MLB edges from lucky streaks
Sustainable success comes from calibrated probabilities rather than simple point predictions. You should treat every game as a probability estimate problem. If you can consistently lock in positions that show positive closing line value, the long run return on investment will follow. Beating the close is the primary quality signal you should look for. Keep your math transparent and auditable so that you can accept a pass as a good decision. Not betting is often the most profitable move you can make on a shaky slate. Scale your sizes only when your signal holds over several weeks of tight calibration and when your realized variance matches your forecasts.
Conclusion
As a professional analyst, I focus on turning price and probability into clear edges. This involves modeling win chances, removing the house vig from the market, only betting on positive expected value, and sizing every wager with a fractional Kelly approach. If you are ready to level up your game, you can utilize the resources at ATSwins. Their expertise and the ATSwins.ai platform offer a powerful AI powered sports prediction tool that provides data driven picks, player props, and betting splits. Whether you use their free or paid plans, the insights provided can help any bettor make more informed and profitable decisions across all major sports.
Frequently Asked Questions (FAQs)
What is an MLB probability vs price betting strategy?
This is a professional approach to baseball betting where you compare your own estimated win probability for a game against the price offered by the sportsbook. If your calculated MLB probability is higher than the fair market chance represented by the odds, you have identified a value bet. The core principle is to ignore your feelings about which team is better and focus entirely on the relationship between price and probability. You should only place a bet when your edge is positive and clearly defined.
How do I convert odds to probability for an MLB probability vs price betting strategy?
You can start by turning the American odds into implied probability. For a positive underdog price like +120, you divide 100 by the odds plus 100, which gives you 45.45%. For a negative favorite price like -140, you divide the absolute value of the odds by the odds plus 100, resulting in 58.33%. If you prefer using decimal odds, the calculation is even simpler because the probability is just one divided by the decimal odds. Once you have these numbers, you must remove the vig to find the true market fair probability.
Why is closing line value important in an MLB probability vs price betting strategy?
Closing line value, or CLV, is the single most important metric for determining if your betting process is actually working. It represents the difference between the price you took and the final price when the game started. If you are consistently betting on numbers that are better than the closing line, it means you are getting ahead of the market and identifying value before the rest of the world catches up. While you can get lucky and win bets with bad closing line value, it is almost impossible to be a long term winner without consistently beating the closing line.
How does weather affect an MLB probability vs price betting strategy?
Weather can drastically alter the win probability of a game by changing the run environment. For example, high temperatures and humidity often lead to the ball traveling further, which can benefit a home run hitting team. Conversely, strong winds blowing in from the outfield can turn potential home runs into easy fly outs, which benefits pitchers with high fly ball rates. A sophisticated model must account for these factors by adjusting the expected run totals and the subsequent win probabilities for each team based on how their specific rosters interact with those conditions. You can find detailed weather impacts by checking Fox Sports MLB coverage or other major sports news outlets.
Can I use this strategy for MLB player props?
Yes, the price vs probability framework is highly effective for player props, although these markets often have lower limits and higher vig. To succeed here, you need to model the specific distribution of a player performance, such as the number of strikeouts a pitcher will record. By comparing your modeled probability of an over or under hitting against the sportsbook price, you can find significant edges. Just be aware that these markets are often more sensitive to lineup changes and specific coaching decisions than the standard moneyline or run line markets.
What is the best way to track my MLB betting performance?
The best way to track your performance is to keep a detailed log that includes the date, the teams, the specific market, your model probability, the market fair probability, the price you took, and the closing line. By tracking these variables, you can calculate your expected value and your actual return on investment. You should also use tools like the CBS Sports MLB scores to verify your results. Using an automated platform like ATSwins can also save you a tremendous amount of time by providing built in profit tracking and performance analytics that help you identify where your model is strongest and where it needs refinement.
How often should I update my MLB betting model?
You should be looking at your model calibration on a weekly basis. While you do not want to overreact to a single bad day or a lucky week, you need to ensure that your features are still accurately reflecting the current state of the league. Major shifts in the run environment or changes in how bullpens are managed can happen throughout the season. By performing a weekly review of your Brier score and your closing line value, you can decide if it is time to reweight certain features or if you should stay the course with your current settings. Consistency is key, but so is the ability to adapt to new data.
Is the Kelly Criterion too risky for a beginner?
The full Kelly Criterion can be very aggressive and lead to significant swings in your bankroll, which is why almost all professional bettors use a fractional Kelly approach. For a beginner, starting with a quarter Kelly or a half Kelly is much safer. This allows you to still size your bets according to your edge without risking a massive portion of your bankroll on a single game. As you become more confident in your model calibration and your ability to beat the closing line, you can slowly increase your fraction, but you should always prioritize the longevity of your bankroll over short term gains. Check NBA.com or other league sites if you want to see how similar analytical approaches are applied in different professional sports.