how to handicap a college football game and find value? - EZ
Smart college football betting starts with math, matchups, and a process you can repeat every single week. This isn’t about guessing or just “going with your gut.” It’s about taking sportsbook odds and breaking them down into implied probabilities, building out fair lines, and then using real on-field data to find edges that you can actually bet. Once you get comfortable with modeling, pricing, and sizing wagers, the fun part is tracking your results and improving week by week. That’s how you build a system instead of just hoping for lucky breaks.
Table Of Contents
- Value, pricing, and market basics
- Building numbers that travel
- Matchups that actually move the spread
- Pricing the bet and bankroll
- Workflow and tools
- Practical walkthrough: putting it all together
- Key details to prevent common mistakes
- Using betting splits and ATSwins signals
- Templates you can reuse
- Quick checks before you click submit
- When to pass
- Refinements as the season evolves
- Common line-shopping scenarios
- A simple EV checklist for one game
- Bringing it back to process
- Conclusion
- Related Posts
- Frequently Asked Questions (FAQs)
Value, Pricing, and Market Basics
If you want to find value in college football betting, the first step is learning how to price the number. Value comes from the difference between your fair probability for a bet and what the market says the fair probability is. If you believe an outcome is more likely than the market is implying, that’s when you’ve got value.
The workflow looks like this: you take the sportsbook line, convert it into implied probability, strip out the vig (also known as the hold), create your own fair line, and then compare your number against theirs. That’s the entire point of handicapping—finding those little mismatches.
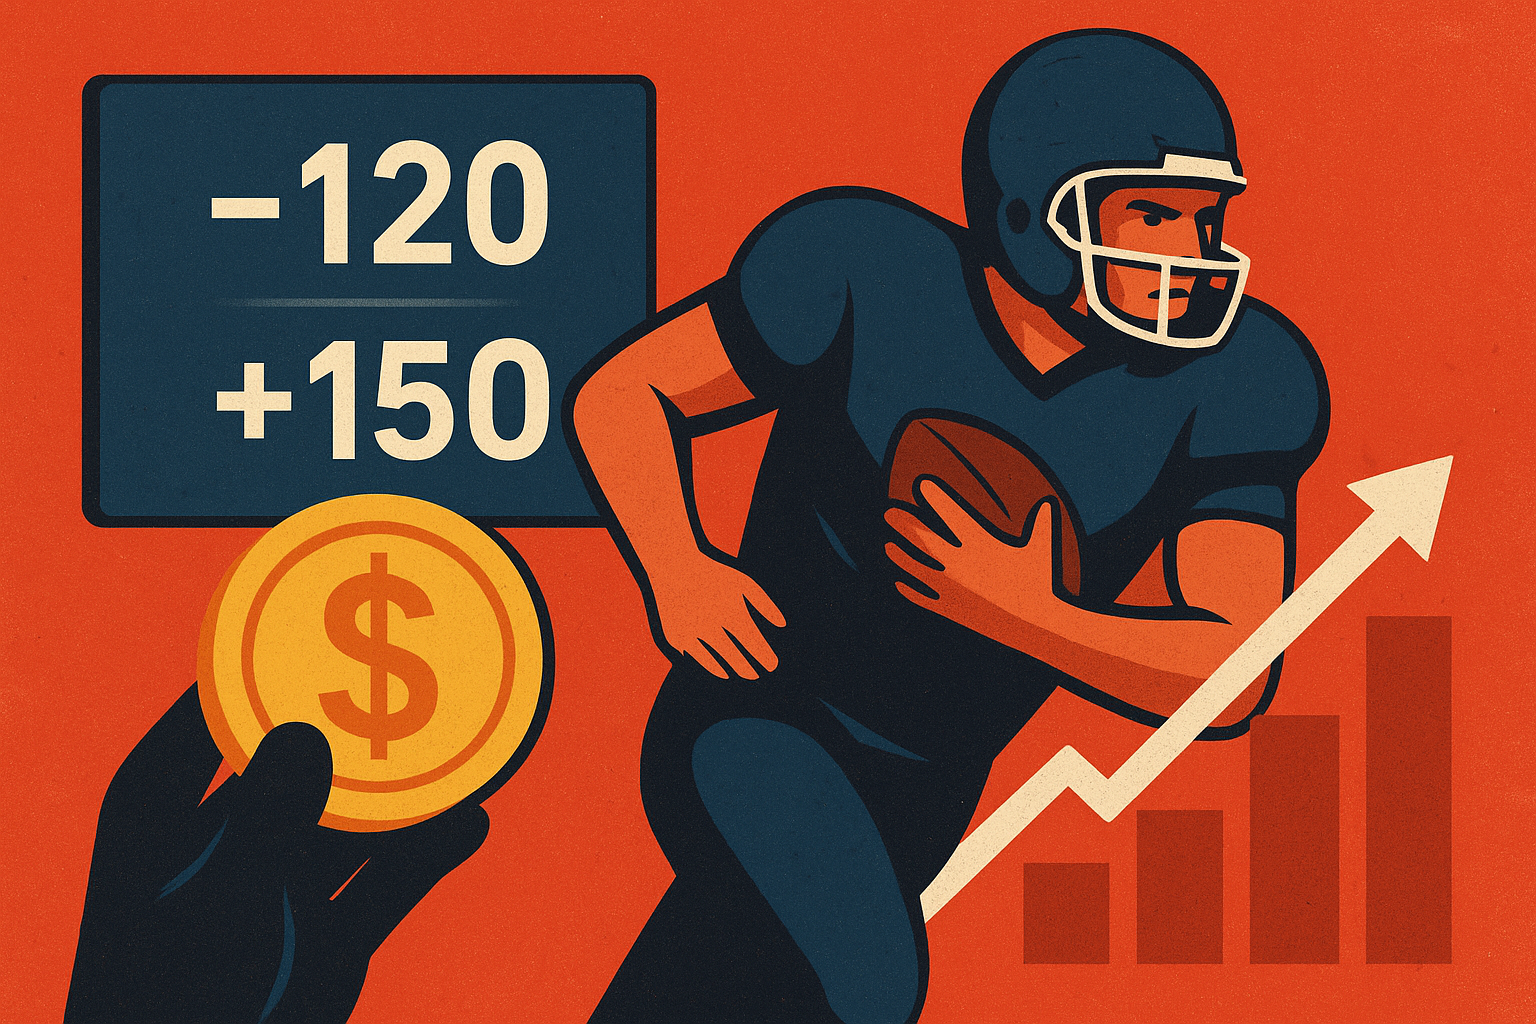
Take American odds as an example. If a line is -120, you can calculate the probability as 120 / (120 + 100), which equals 54.55 percent. If the odds are +150, it’s 100 / (150 + 100), which comes out to 40 percent. Once you do this, you’ll start seeing how much juice is actually built into the lines and how the sportsbook is shading things.
When you remove the vig, that’s when you get the market’s true fair probability. Imagine a two-way market at -110 on each side. The raw implied probability is 52.38 percent for both, which adds up to 104.76 percent. That extra 4.76 percent is the vig. When you strip it out, each side comes out to roughly 50 percent, which is the fair line. That’s your baseline for comparison.
The key is this: once you know the market’s fair number, you can measure your edge against it. If your model says a team covers 55 percent of the time and the market says 50 percent, that’s a five percent edge. Those are the bets you want to be placing consistently.
Building Numbers That Travel
Your model is only as good as the numbers behind it. That’s where power ratings come in. Think of power ratings as your own personal scoreboard that measures how good each team is, not just by wins and losses but by efficiency.
Start by pulling advanced stats like EPA per play, success rate, explosiveness, and havoc. Adjust those numbers for opponent strength, because a team torching bad defenses might look better than they actually are. The adjustment part is what makes your numbers travel, meaning they’ll work across different matchups and not just the ones you’ve already seen.
From there, you want to split offense and defense ratings and then combine them into a net rating. That gives you a baseline for how good each team is. Layer in pace, finishing drives, and field position because those are major swing factors that raw yardage doesn’t fully explain.
Roster dynamics matter too. Returning production, injuries, and transfer portal moves can shift ratings in ways the box scores don’t always catch right away. A quarterback with 20 career starts is worth more than a first-time starter even if the stats don’t show it yet. Depth also comes into play. A defensive line with no rotation is going to get wrecked against a high-tempo offense late in the game.
Finally, don’t just assume every home-field advantage is worth three points. Some programs have bigger edges than others, and travel matters a ton in college football. Think altitude, early kickoffs, and rivalry environments. If you build that nuance in, your numbers will hold up much better week to week.
Matchups That Actually Move the Spread
Not every matchup detail matters. You want to focus on the ones that consistently swing spreads and totals.
The trenches are the first place to look. Offensive line vs defensive line battles dictate whether a quarterback has time to throw or a running back has lanes to hit. If a team’s offensive line is weak and they’re facing an elite pass rush, that mismatch alone can kill drives and create turnovers.
Explosive plays are another big driver. College football is way more volatile than the NFL, and just a few deep passes or long runs can flip a spread by multiple points. If a defense is prone to giving up chunk plays and the opposing offense has burners, you need to price that in.
Coaching tendencies also matter. Tempo-heavy teams against shallow defensive rotations often mean late scoring bursts. Aggressive coaches who go for it on fourth down can change expected points per drive in ways conservative coaches won’t.
Special teams can’t be ignored either. Net punting, return coverage, and kicker range all add hidden yards that shift field position. Even a small gap in special teams efficiency can be worth one or two points on the spread.
Weather and altitude are the final layer. Strong winds can destroy passing efficiency and kicking range. Rain usually lowers passing efficiency but can also lead to big busted plays if tackling breaks down. Altitude and heat wear down thin defenses, making overs more live in the second half.
The point here is simple: not all stats are created equal. Learn which ones translate to actual spread movement and focus your energy there.
Pricing the Bet and Bankroll
Once you’ve built your numbers and found edges, the next step is figuring out how much to bet. This is where bankroll management separates the pros from the casuals.
The smartest way to size bets is with fractional Kelly. Full Kelly is too aggressive for most people because it swings your bankroll up and down too wildly. Fractional Kelly—like half or even quarter—lets you take advantage of edges without risking massive drawdowns.
Here’s how it works. Say your model shows a six percent edge at -110. The full Kelly bet would be around 6.6 percent of your bankroll. Half Kelly would be 3.3 percent, and quarter Kelly would be 1.6 percent. Those smaller sizes still let you grow your roll over time but without the stress of massive swings.
The other thing to keep in mind is correlation. If you’re betting a favorite and the over in the same game, those are probably correlated. If the favorite blows out the opponent, it’s often because the offense scored a ton, which also pushes the total over. Stacking correlated bets without accounting for it can overexpose your bankroll.
That’s where discipline comes in. Stick to your staking plan, log every bet, and track your CLV. Don’t chase losses. Don’t go off plan just because you “feel good” about something. Long-term growth comes from discipline, not hunches.
Workflow and Tools
Every bettor should have a workflow that they can repeat week after week. That means data collection, updating your ratings, projecting matchups, and then checking everything against the market.
ATSwins can make this process easier by providing you with data-driven picks, betting splits, and tracking tools. You can use their signals as a cross-check against your own numbers. If your fair line says one thing and their projections line up, that’s usually a stronger sign to pull the trigger.
The tools themselves don’t have to be fancy. A simple spreadsheet works if you actually use it. What matters is consistency—update your numbers every week, apply them to the next slate, and then review results. The more disciplined your workflow, the sharper you’ll get over time.
Practical Walkthrough: Putting It All Together
Let’s walk through an example. Say you build power ratings and find that Team A is +0.18 EPA per play on offense while Team B is +0.05. You adjust for defense, pace, finishing drives, and home-field advantage. After running your numbers, you project Team A as a 3-point favorite.
The market, however, has the line at -2.5. You strip out the vig and see that your fair probability is higher than the market’s. That’s a positive expected value bet.
From there, you check timing. Is the line likely to move to -3.5? Are the splits from ATSwins showing sharp money on the same side? If yes, you grab the -2.5 before the market shifts.
Then you size the bet with fractional Kelly, maybe one or two percent of your bankroll depending on your confidence. You place the bet, log it, and then later record where the closing line ended. If you beat the closing number consistently, you’re on the right track.
This process is repeatable. It’s not about nailing one bet. It’s about building a system that wins long-term.
Key Details to Prevent Common Mistakes
College football bettors get tripped up all the time by the same mistakes. They overreact to small sample sizes early in the season. They anchor too hard to one big game. They ignore injuries or cluster position issues. They forget to check weather the morning of the game.
The way to avoid those traps is by having rules. Weight priors more heavily in Weeks 1 through 3. Smooth week-to-week updates so one crazy box score doesn’t wreck your ratings. Track depth so you know if a team can survive injuries. Always check NOAA weather reports before betting totals.
Basically, don’t just bet blind. Build safeguards into your process.
Using Betting Splits and ATSwins Signals
Betting splits are like the heartbeat of the market. If the public is hammering one side but the line is moving the other way, that’s usually a sign of sharp money. ATSwins lets you track those moves and see which sides and totals are drawing legit attention.
Blending your own fair lines with ATSwins projections is powerful. If both align, that’s when you fire. If they don’t, it’s a signal to dig deeper and figure out why. Either you’re missing something, or the market is.
Templates You Can Reuse
Having a set of templates saves you from reinventing the wheel every week. Build a weekly team rating sheet that tracks offensive and defensive metrics, roster details, special teams, and context like home-field advantage. Build a game projection sheet that combines those ratings with matchup adjustments and weather.
Once you’ve got those in place, projecting games is way faster. You can focus on analyzing instead of setting up.
Quick Checks Before You Click Submit
Before you lock in a bet, run through a quick mental checklist. Did you strip out the vig? Are you betting into or off a key number? Did you check weather within 12 hours of kickoff? Are you overexposed on correlated bets? Did you actually log it in your tracker?
These little habits will save you from dumb mistakes that add up over a season.
When to Pass
Sometimes the smartest bet is no bet. If your model and ATSwins signals don’t agree and you can’t explain the gap, pass. If injury news is unclear but already priced into the market, pass. If the line has moved off the key number and the edge is gone, pass.
Not betting is still part of discipline.
Refinements as the Season Evolves
Your approach should change as the season goes on. Early weeks require more reliance on priors and smaller stakes. Mid-season, once your ratings stabilize, you can size up. Late in the year, motivation and opt-outs become a huge deal, especially in bowl season.
Don’t stay static. Adjust your process to the time of year.
Common Line-Shopping Scenarios
Line shopping is one of the simplest ways to boost your win rate. Even half a point around a key number can flip a bet from breakeven to profitable.
Totals move a lot too, especially in the 55–65 range. Weather updates can shift those lines multiple points. If you’re ahead of the move, you lock in value.
A Simple EV Checklist for One Game
Let’s say the market has a favorite at -6.5 with a total of 61.5. Your projections make the fair spread -7.8 and the fair total 60.3. That means you’ve got an edge on the side and the under.
You check timing and see steam toward -7, so you grab the -6.5 now. You wait a bit on the total since weather might push it higher. You size the bets with fractional Kelly and log everything. That’s how the process works.
Bringing It Back to Process
At the end of the day, winning in college football betting comes down to having a process you trust and sticking with it. Build portable power ratings. Focus on matchup details that actually matter. Price everything against the no-vig market. Shop lines and size with Kelly. Track results and learn every single week.
ATSwins can be your extra set of eyes along the way, with model outputs, betting splits, and tracking tools that keep you sharp.
Conclusion
The blueprint is simple, but execution is where most bettors fall short. Convert odds into fair lines. Build power ratings that travel. Break down matchups that actually move the spread. Size bets with discipline and log everything. Respect closing line value.
When you bring it all together, you stop betting on vibes and start betting like a pro. If you’re ready to take the next step, start small, lean on ATSwins’ data-driven insights, and keep reviewing your process every week. That’s how you keep leveling up.
Related Posts
ATSwins.ai Archive Page 478
ATSwins.ai Archive Page 477
ATSwins.ai Archive Page 476
Frequently Asked Questions (FAQs)
What’s the first step in how to handicap a college football game and find value?
The first step is pricing the number. Convert sportsbook odds into implied probability, strip out the vig, and compare it to your own fair line. That’s how you find edges.
How do I build a simple power rating?
Start with opponent-adjusted efficiency like EPA per play and success rate. Split offense and defense, then layer in pace, finishing drives, and special teams. Adjust for roster continuity and injuries, and calibrate home-field advantage by program.
Which matchup angles matter the most?
The trenches, explosives, tempo vs depth, finishing drives, special teams, and coaching tendencies like 4th-down aggression. Weather and altitude also move lines more than people think.
How should I size bets and track results?
Use fractional Kelly to balance growth and risk. Don’t over-stack correlated bets. Log every wager, track CLV, and review weekly results.
How does ATSwins.ai fit into the process?
ATSwins is an AI-powered sports prediction platform that offers picks, props, betting splits, and tracking. Use it to cross-check your own fair lines, time entries better, and stay disciplined with profit tracking.
Related Posts
AI For Sports Prediction - Bet Smarter and Win More
AI Football Betting Tools - How They Make Winning Easier
Bet Like a Pro in 2025 with Sports AI Prediction Tools
Sources
The Game Changer: How AI Is Transforming The World Of Sports Gambling
AI and the Bookie: How Artificial Intelligence is Helping Transform Sports Betting
How to Use AI for Sports Betting
Keywords:
MLB AI predictions atswins
ai mlb predictions atswins
NBA AI predictions atswins
basketball ai prediction atswins
NFL ai prediction atswins