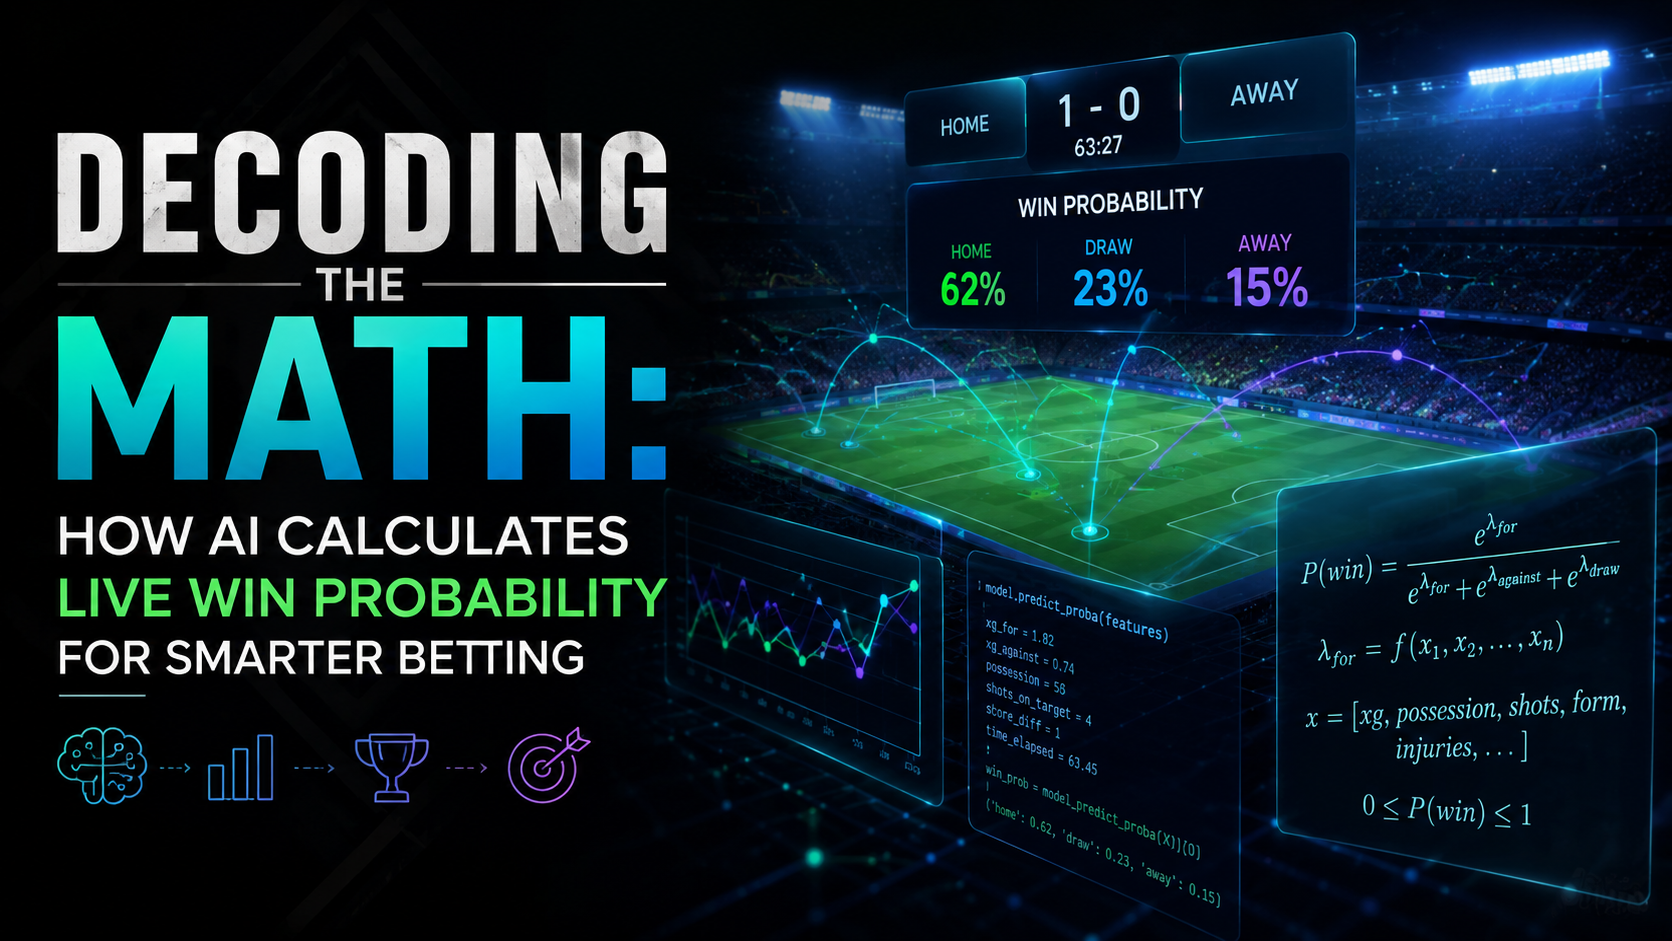
Decoding the Math: How AI Calculates Live Win Probability for Smarter Betting
Winning games is about moments, math, and momentum. Sports analysts increasingly lean on artificial intelligence to read massive in-game swings in real time, turning score, clock, possession, and shot quality into clear win probabilities you can trust. This comprehensive breakdown pulls back the curtain on how live win odds are built, what variables actually move them, and how you can leverage these advanced metrics using platforms like ATSwins to gain a significant edge over the sportsbooks.
Table Of Contents
- Understanding the True Nature of Live Win Probability
- The Pillars of Data Ingestion and Feature Engineering
- Algorithmic Approaches to Modeling Live Sports Data
- Why Model Calibration Trumps Raw Prediction Accuracy
- Maximizing Your Edge Within the ATSwins Ecosystem
- Frequently Asked Questions (FAQs)
Understanding the True Nature of Live Win Probability
Live win probability is the mathematically derived chance that a specific team will win a matchup given the exact current state of the game. Expressed in standard statistical notation, this is written as $P(\text{Team Wins} \mid \text{Current State})$. It is completely divorced from gut feelings, emotional momentum, or raw crowd noise. Instead, it operates as a highly rigorous conditional probability grounded entirely in the scoreboard, the remaining clock, possession or serve advantages, spatial positioning, and pre-game team quality metrics. The underlying artificial intelligence model processes these components dynamically, updating the probability percentage continuously as new on-field events alter the game state.
At ATSwins, we convert these massive streams of situational data into calibrated, in-play probabilities that power automated alerts, live betting edges, and meticulous postgame performance audits across major sports leagues. While every sport has its unique quirks, a few primary inputs universally dictate how the win probability shifts from minute to minute. The most critical driver is the interplay between score margin and time remaining, as a five-point lead represents a massive advantage with three minutes left on the clock but is statistically minor with thirty-three minutes remaining.
Control over the next scoring opportunity represents another massive variable. This includes possession in football, ball control in basketball , ice-level zone time in hockey, or the serve in tennis. Field position and immediate shot quality further refine this calculation, factoring in metrics like down and distance, expected goals, or baseball base-out situations. These situational variables are constantly adjusted against baseline team strength ratings and real-time roster adjustments, such as player fatigue, basketball rotation patterns, hockey power-play windows, and stadium weather conditions.
The Pillars of Data Ingestion and Feature Engineering
Building an enterprise-grade sports prediction model requires a massive foundation of clean, structured historical data. The development pipeline begins by pulling extensive play-by-play data and tracking coordinates from official league feeds and repositories. For developers looking to build a preliminary prototype, serves as an excellent starting point for acquiring historical play-by-play logs. Once ingested, this data must be meticulously standardized so that every single row represents a distinct, frozen snapshot of the game state immediately preceding a pitch, snap, shot, or faceoff.
The core target variable for training the model is binary: the target $y = 1$ if the home team wins at the end of regulation or overtime, and $y = 0$ if they lose. Engineers never use intermediate point margins as the final training label. The features capture the path, while the label only records the absolute final result. Advanced features are engineered to capture granular situational advantages, including rolling ten-game team efficiency ratings, opponent-adjusted pace factors, and expected points added.
To ensure the model performs reliably when deployed in production, data scientists split training datasets using strict time-aware and game-aware partitions. Models are trained on past seasons, validated on subsequent seasons, and tested on the most recent completed games. Crucially, all team ratings and rolling features are completely frozen at the theoretical prediction timestamp. This prevents any future game information from leaking backward into the past, as data leakage destroys real-world calibration and causes models to appear deceptively accurate during backtesting.
Algorithmic Approaches to Modeling Live Sports Data
Modern sports analytics platforms deploy a tiered architecture of mathematical models to handle different phases of a game. Linear baselines like regularized logistic regression serve as excellent computational anchors because they are fast, interpretable, and highly reliable when processing basic monotonic variables like score margin and time remaining. However, to capture the highly complex, non-linear interactions inherent to live sports, engineers heavily utilize tree-based ensembles such as XGBoost, LightGBM, and CatBoost.
For sports characterized by fluid, episodic scoring, data scientists implement Poisson processes and hazard models to calculate the exact timing and distribution of future scoring events. These probabilistic frameworks allow systems to run thousands of rapid Monte Carlo simulations from the current game state, projecting the remainder of the game to calculate a highly accurate distribution of potential final scores. When spatial tracking data becomes overwhelmingly dense, deep learning architectures like convolutional neural networks and transformers are deployed via advanced libraries like to evaluate defensive pressure and real-time shot quality.
Why Model Calibration Trumps Raw Prediction Accuracy
In the realm of professional sports betting, raw predictive accuracy is secondary to precise model calibration. A machine learning model that boasts a 75% overall accuracy rate across an entire game is functionally useless to a bettor if its individual probability buckets are distorted. True sports analytics value requires that when the model identifies a selection of distinct situations as having a precise 70% win probability, those teams actually go on to win the game exactly 70% of the time.
Engineers rigorously evaluate probability quality by tracking metrics like the Brier score, which measures the mean squared error between predicted probabilities and actual outcomes, alongside log loss to penalize overconfidence. To correct inevitable distortions at the extreme ends of the probability spectrum, developers apply post-model calibration techniques like isotonic regression and Platt scaling. Detailed guidance on implementing these validation pipelines can be found across the comprehensive documentation.
Maximizing Your Edge Within the ATSwins Ecosystem
The primary objective of calculating high-fidelity live win probability is to uncover actionable market discrepancies in real time. When the AI-driven probability calculated by ATSwins significantly diverges from the live implied probability offered by sportsbook odds, a potential betting edge is identified. Bettors use these real-time point differentials to execute highly precise in-game wagers, optimize hedging strategies on existing positions, and identify mispriced derivative markets such as live player props and alternative point spreads.
To maintain maximum transparency, advanced prediction platforms pair these shifting percentages with explainability frameworks like SHAP values. This allows users to see exactly which variables triggered a sudden movement in the live odds, whether it was a critical fourth-down conversion, a hockey power play, or a basketball team successfully engineering a two-for-one possession window at the end of a quarter. By grounding every shift in transparent mathematics rather than emotional bias, sports bettors can confidently make faster, more analytical decisions in fast-moving live markets.
Frequently Asked Questions (FAQs)
What does “how AI calculates win probability” actually mean during a live game?
It means the model is estimating the chance a team wins from the current game state, mapping situational variables directly to historical outcomes. Rather than relying on human intuition, the artificial intelligence processes thousands of past game trajectories that shared identical parameters, such as point differentials, clock constraints, and possession data, to output a real-time mathematical probability.
Why do live odds at sportsbooks differ from an AI win probability model?
Sportsbook odds are heavily influenced by public betting volume, liability management, and baked-in profit margins known as the vigorish or juice. An independent, pure AI win probability model calculates the absolute statistical probability of an outcome based entirely on performance data, completely independent of market sentiment or oddsmaker risk management.
How does tracking data like player coordinates improve win probability accuracy?
Traditional models only recognize that a shot was taken from a specific distance on the court or ice. Tracking data allows advanced neural networks to calculate the exact distance of the closest defender, the closing speed of the safety, or the pre-shot puck movement. This adds deep spatial context to the model, allowing it to evaluate the actual quality of an opportunity rather than just the final result of the play.
What is data leakage, and why does it ruin sports prediction models?
Data leakage occurs when information from the future accidentally enters a model's training dataset for a past event. For example, if a model uses a player's final game-long shooting percentage to predict a win probability during the first quarter, it is using future data that would be unavailable in real time. This makes a model look incredibly precise during testing, but causes it to fail completely when deployed in live environments.
Can win probability models adapt to sudden player injuries during a game?
Advanced models handle this by utilizing Bayesian updating and tracking real-time line rotations. When a star player exits to the locker room, the system adjusts the team's baseline offensive and defensive efficiency ratings down to reflect the bench lineup. This immediately shifts the baseline expectation for all subsequent possessions, updating the win probability to account for the altered roster.
How can I build a basic win probability model on my own?
You can initiate the process by downloading historical play-by-play datasets from open-source sports repositories. Start by engineering basic state features, specifically score margin, remaining time, and possession. Fit a baseline logistic regression using these variables, and then gradually layer in complex parameters like team power ratings, interaction terms, and tree-based ensembles as your pipeline matures.