

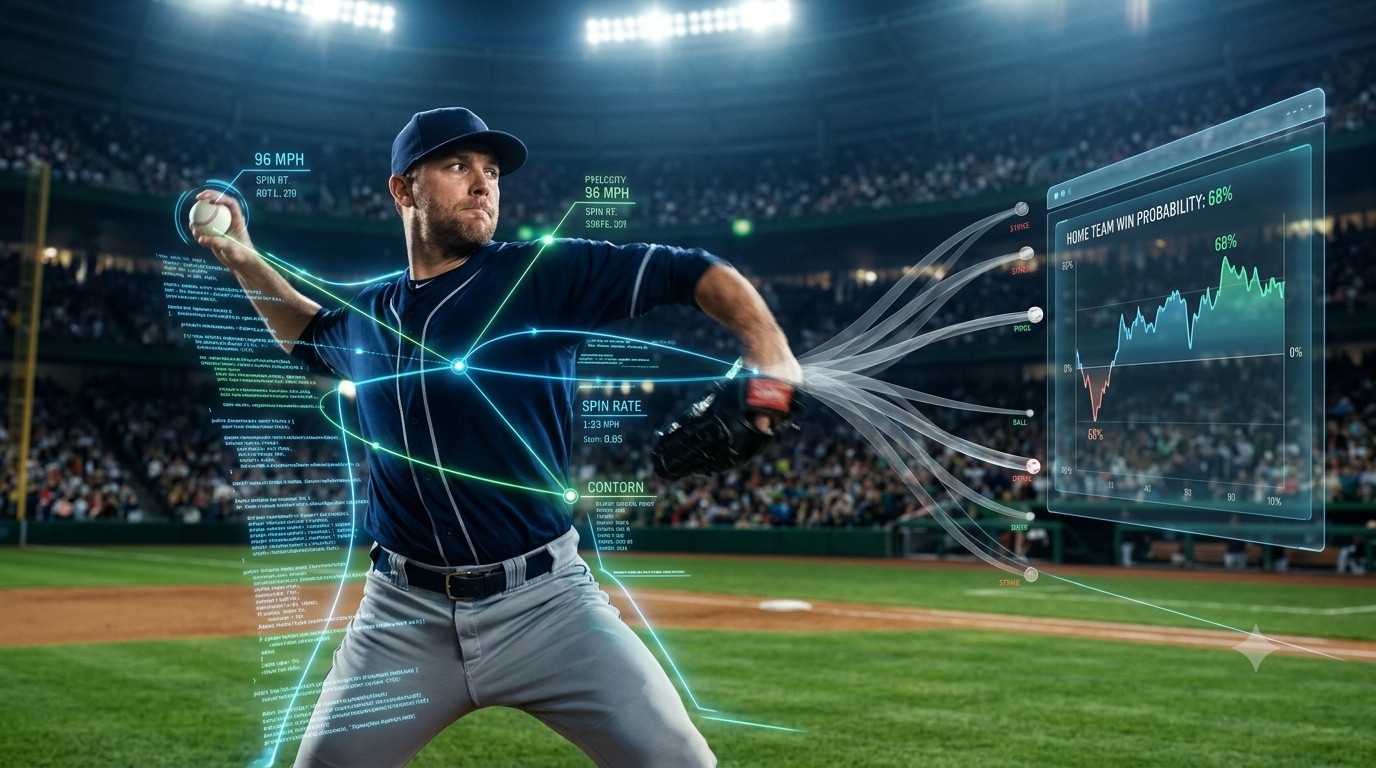
just a quick list of projected winners. Modern baseball forecasting doesn't work by handing out absolute guarantees. Instead, it estimates probabilities over long horizons. Rather than asking if Team A beats Team B tonight, a good model figures out how often Team A wins if both sides play that exact matchup a thousand times under identical conditions.
That distinction matters. Baseball is notoriously volatile. A Cy Young contender can give up a cheap three-run shot in the first inning. An underdog can scrape together three singles on soft grounders and walk away with a win. Weather shifts, bullpen fatigue, last-minute lineup scratches, and defensive positioning introduce constant noise into every single game. Solid modeling accepts that randomness as part of the equation rather than ignoring it.
This article breaks down how modern MLB prediction models operate, what data feeds them, why probability beats simple pick-em picks, and how ATSwins.ai uses statistical analysis to forecast games.
Table of Contents
What an MLB Outcome Prediction Model Actually Does
Why Baseball Is Difficult to Predict
The Data Behind Modern Baseball Forecasts
Turning Statistics Into Win Probabilities
Why Simulations Improve Forecast Accuracy
How New Information Changes a Forecast
Why Probability Matters More Than Picking Winners
How ATSwins.ai Applies Predictive Analytics
What an Effective MLB Outcome Prediction Model Cannot Do
Conclusion
Frequently Asked Questions
What an MLB Outcome Prediction Model Actually Does
Casual fans often imagine mlb game prediction software as a simple program that points at a team and declares a guaranteed winner. That isn't how serious statistical forecasting operates. Real systems evaluate likelihoods based on thousands of historical data points and live game conditions.
Every single game on the MLB schedule packs in dozens of moving parts. Starters feature different pitch mixes, hitters match up better or worse depending on hand dominance, road trips wear down bullpen arms, and air density shifts with temperature. No single factor decides a ballgame on its own. Put them together, though, and you start seeing the underlying probability distribution for that night's matchup.
So instead of claiming the Yankees will definitely win, a model might say New York holds a 58% win probability while their opponent sits at 42%. That number embraces the inherent variance while giving you actionable insight.
This approach separates disciplined data modeling from raw gut picks. Variance exists in every pitch, and no algorithm can eliminate luck. The real goal is estimating those probabilities accurately over a massive sample size.
With 162 games per team every regular season, Major League Baseball provides a massive statistical foundation. That volume gives analysts enough signal to cut through short-term noise—a luxury you don't get in shorter sports seasons.
Why Baseball Is Difficult to Predict
Baseball looks straightforward on paper, but it is notoriously tough to model accurately.
Scoring is low compared to sports like basketball, meaning small events carry massive weight. One missed strike call or an off-target throw can flip an entire game's expected outcome. Even Hall of Fame hitters fail seven out of ten times, and elite starters occasionally lose command without any obvious physical cause.
Luck plays a bigger role in baseball than most fans care to admit.
Take two evenly matched squads. One team might hit a weak grounder that squeaks through a shift for two runs. The other team might crush three line drives straight into outfielders' gloves for quiet outs. The scoreboard shows a gap, but the underlying quality of contact was virtually identical.
Because of this noise, sharp analysts ignore traditional surface metrics like pitcher wins or basic batting averages. They focus on stable underlying metrics instead: strikeout rates, walk percentages, exit velocity, launch angles, hard-hit rates, and expected batting metrics.
Performance isn't static either. Pitchers lose velocity as arm strain builds up over June and July. Hitters battle through undisclosed nagging injuries or adjust their swings mid-season. Younger players develop rapidly while aging veterans drop off without warning.
A dependable model continuously recalibrates these moving targets as fresh data comes in, rather than relying on stale preseason projections.
The Data Behind Modern Baseball Forecasts
Garbage in, garbage out—data quality dictates model success. Machine learning models can't fix incomplete or noisy inputs, so the best prediction systems spend serious effort cleaning and organizing raw data before running calculations.
MLB's Statcast system, tracked via Baseball Savant, transformed modern modeling. It records pitch velocity, spin rates, launch angles, exit velocities, sprint speeds, and extension on every single pitch thrown across the league.
While historical final scores matter, modern modeling looks far deeper than wins and losses.
Starting pitching gets plenty of attention because starters shape run prevention right from the first pitch. Running a specialized ai mlb pitcher prediction model allows analysts to dig into strikeout-to-walk ratios, pitch movement, velocity trends, home and road splits, platoon leverage, and recent pitch counts to gauge true effectiveness.
Bullpens carry just as much weight nowadays. Starters rarely go eight or nine innings anymore. Games frequently come down to high-leverage relievers in the seventh, eighth, and ninth. Models track bullpen availability by monitoring recent pitch volume, back-to-back appearances, and projected fatigue.
Offensive projections go far beyond simple batting averages. Models track expected weighted on-base average (xwOBA), hard-hit percentages, chase rates, and historical performance against specific pitch types.
Defense adds another critical piece. Modern fielding metrics evaluate how well a team converts ball-in-play events into outs, helping separate lucky pitching staffs from those supported by elite glovework.
Then come environmental factors. Temperature, humidity, wind velocity, stadium altitude, field dimensions, and retractable roof status directly influence ball flight. Some ballparks suppress run production consistently, while others turn fly balls into home runs.
No single stat wins a game. Every data point simply adds a small piece to the broader probability puzzle.
Turning Statistics Into Win Probabilities
Gathering stats is step one. The real challenge is converting raw data into clean probability percentages.
Understanding how ai calculates win probability starts with analyzing how hundreds of features interact with each other. A model converts pitching metrics, offensive firepower, bullpen depth, defense, weather, and travel schedules into numerical inputs.
Machine learning algorithms analyze those inputs against historical outcomes to find hidden patterns. For instance, an elite strikeout starter paired with a rested bullpen pitching in cold weather might yield specific win probabilities that simple linear formulas miss. The system learns these relationships directly from historical data rather than rigid, hard-coded rules.
Proper calibration is everything here. If a model identifies 100 games where favorites have a 60% win chance, roughly 60 of those favorites should actually win. If only 48 win, the model is poorly calibrated.
Calibration errors lead to overestimating heavy favorites or mispricing underdogs. Over a full season, bad calibration destroys credibility even if a few individual calls look good on paper.
Top-tier prediction systems constantly check their calibration against league trends. Baseball changes over time—strikeout rates rise and fall, ball manufacturing alters travel distance, and tactical shifts evolve. Models must retrain routinely to stay accurate.
Why Simulations Improve Forecast Accuracy
Single probability calculations are useful, but running repeated game simulations takes modeling to another level. Simulation shows not just who is favored, but all the realistic paths a game might take.
Imagine two evenly matched teams. One night, a starter cruises through seven scoreless innings. The next, he walks three batters early and gets yanked in the fourth, forcing an overworked bullpen into action. A single static number can't capture that variance.
Monte Carlo simulations replay a matchup thousands of times, pulling from player probability distributions and real-time conditions.
Every simulated run plays out differently. A hitter with a .370 on-base percentage won't reach base exactly 3.7 times every ten plate appearances in short runs. Random variation happens in simulations just like it happens on the field. But across 10,000 simulated games, clear patterns emerge.
One team might win 61% of total simulations while suffering heavy blowout losses in others due to bullpen volatility. That depth explains why a team holds an edge rather than just handing out a blind prediction.
Simulations also yield expected run totals, inning-by-inning scoring spreads, and margin distributions. That gives a far clearer picture than a basic predicted final score ever could.
By exposing uncertainty instead of hiding it, simulations help analysts respect close matchups and identify genuinely high-confidence spots.
How New Information Changes a Forecast
An MLB game line is fluid from the moment opening odds drop until the first pitch is thrown. Managers rest key starters, illness scratches pitchers, and late-afternoon wind shifts alter park factors.
Modern prediction models process these updates continuously.
If a star hitter gets scratched thirty minutes before game time, the ripple effect moves through the entire lineup. The batter behind him gets fewer pitchable strikes, and opposing managers adjust their late-game bullpen matchups accordingly.
Starting pitcher changes create even bigger swings. Swapping an established ace for a spot starter introduces massive uncertainty, impacting expected runs allowed and taxing bullpen availability down the stretch.
Weather shifts matter too. A sudden shift in wind direction or a drop in temperature can change expected run output significantly. Rain delays might cut a starter's night short after two innings, throwing unexpected workload onto relievers.
Integrating these variables in real time ensures that model outputs reflect live game realities instead of outdated morning assumptions.
Why Probability Matters More Than Picking Winners
Evaluating a model by asking "Did it pick the winner?" misses the fundamental point of data science.
If a model gives Team A a 65% chance to win, Team B still holds a 35% chance. When Team B wins, it doesn't mean the model failed. A 35% event happens roughly one out of every three times under those exact conditions.
True accuracy shows up across hundreds or thousands of games, not in single-game hot takes.
A model claiming 90% confidence on every favorite might sound bold, but if those favorites only win 60% of the time, the model is useless for serious decision-making. Honest forecasting embraces uncertainty.
This distinction is crucial for anybody evaluating sports betting data analysis tools. The objective isn't chasing guaranteed winners—it's establishing accurate probabilities and finding gaps where those probabilities differ from market consensus.
Finding edge requires disciplined probability estimation, not emotional picking.
How ATSwins.ai Applies Predictive Analytics
ATSwins.ai focuses on rigorous statistical evaluation over headline predictions or hype.
Instead of framing games as locks, the platform analyzes matchups through multi-layered data inputs. Historical trends, underlying player metrics, matchup profiles, and Monte Carlo simulations combine to create balanced probability profiles for every contest.
This methodology accepts that baseball contains inherent randomness over 162 games. Great teams drop games to rebuilding clubs, elite closers blow saves, and bench players occasionally have career nights.
Because individual games carry variance, ATSwins.ai relies on consistent process and continuous recalibration throughout the MLB season.
Objectivity drives the system. Narrative traps—like five-game winning streaks or hot hitting stretches—don't sway model output unless supported by underlying metrics. Long-term data signals remain far more predictive than short-term media noise.
What an Effective MLB Outcome Prediction Model Cannot Do
No prediction model is flawless, and understanding limitations is part of smart modeling.
Algorithms can't predict an outfielder losing a pop fly in the sun, a blown call at first base, or an unexpected mid-game hamstring strain.
Managers make uncharacteristic tactical decisions, young players adjust their swing mechanics overnight, and micro-climates inside ballparks don't always match official weather station data.
Baseball will always feature single-game unpredictability. Responsible models communicate that uncertainty clearly rather than promising guaranteed outcomes.
The goal isn't to eliminate randomness—it's to sharpen long-term evaluation and help users understand the true range of outcomes in one of the most unpredictable sports in the world.
Conclusion
A high-performing MLB outcome prediction model offers much more than simple pick selection. By weighing thousands of performance metrics, running extensive simulations, and calculating accurate win probabilities, advanced modeling helps clear away noise and quantify true game-level risk.
As lineups lock, weather updates arrive, and pitching matchups shift throughout the day, modern probability models adapt to reflect current conditions. ATSwins.ai provides the tools and analytical frameworks needed to analyze baseball through probability and data, giving fans and analysts a grounded, objective way to navigate the full 162-game season.
Frequently Asked Questions
What is an MLB outcome prediction model?
An MLB outcome prediction model is a statistical system that calculates each team's probability of winning a game. Rather than guaranteeing winners, it processes player performance, pitching data, weather, and historical trends to determine realistic win probabilities.
Are AI baseball prediction models always accurate?
No model wins every game because baseball inherently involves variance. Strong AI models aim for accurate long-term probability estimates rather than predicting every single game result perfectly.
Why do prediction probabilities change before a game starts?
Probabilities shift as fresh data comes in. Confirmed lineups, weather shifts, pitcher scratches, and bullpen usage all alter expected outcomes up until first pitch.
Why is probability better than simply predicting a winner?
Probability acknowledges uncertainty. Saying a team has a 60% chance to win means the opponent still wins 40% of the time. This realistic approach matches how baseball actually plays out over time.
Can historical statistics alone predict MLB games?
Historical data is foundational, but it needs real-time context. Effective modeling combines long-term statistical baselines with live lineup data, recent workload, weather, and matchup splits for maximum accuracy.