Lakers reportedly exploring trade market for veteran guard as roster questions continue
The Lakers are reportedly looking to move one veteran player as they continue adjusting their roster. The move would fit a broader effort to balance experi
Daily NFL, NBA, NHL, MLB and college sports news with timely updates, analysis and context from ATSwins.
The Lakers are reportedly looking to move one veteran player as they continue adjusting their roster. The move would fit a broader effort to balance experi
LeBron James is reportedly monitoring a newly traded NBA star as speculation grows about possible future roster fits and veteran pairing options.
Speculation around the Warriors and Anthony Davis has resurfaced, but current reporting suggests those ideas remain separate from any firm LeBron James-dri
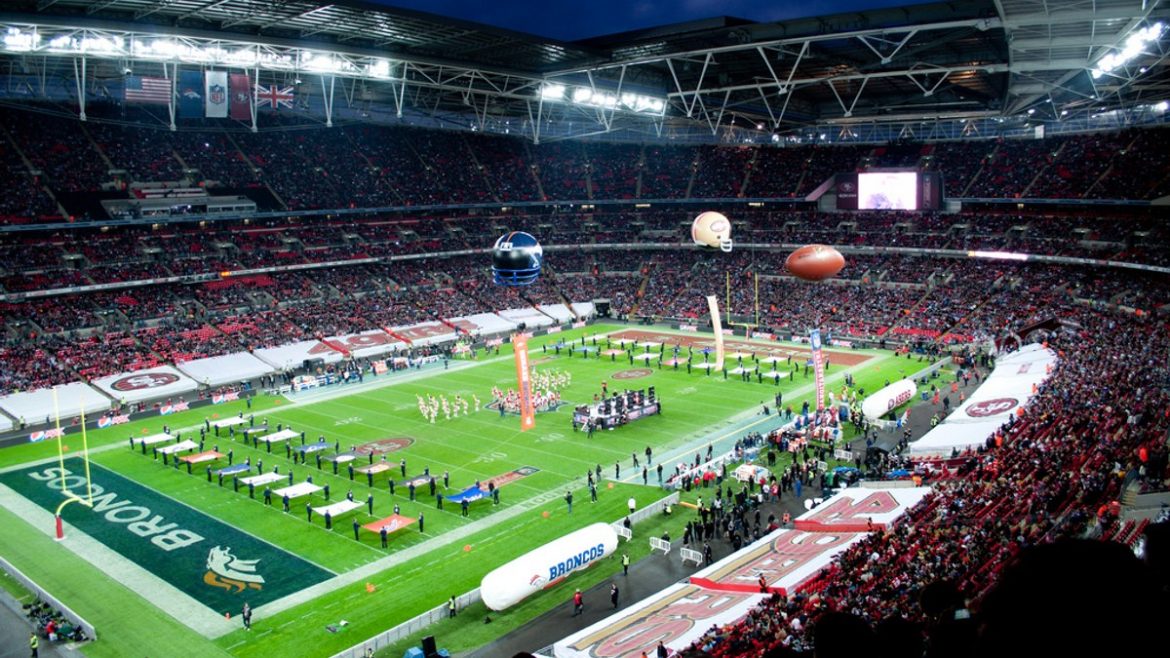
The 49ers’ 2026 planning is already being shaped by the NFL’s key cutdown and trade deadlines, with roster management set to define the season’s early mont
ESPN’s early free agency grades highlight how teams are shaping their rosters through signings and extensions, with major implications for 2026-27.
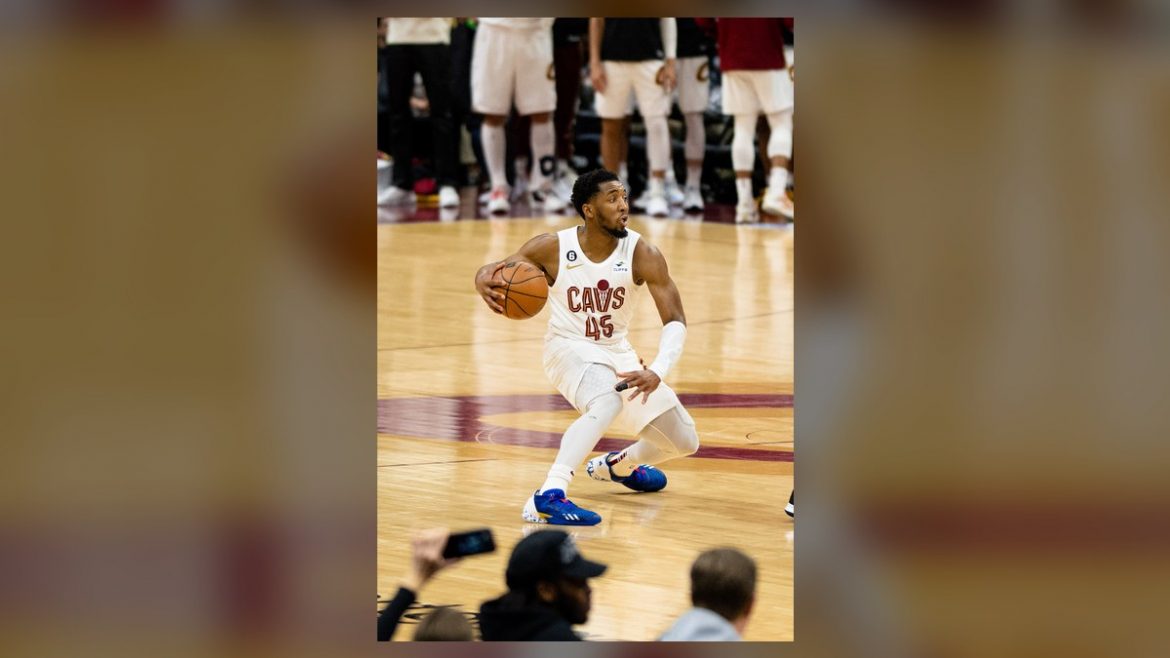
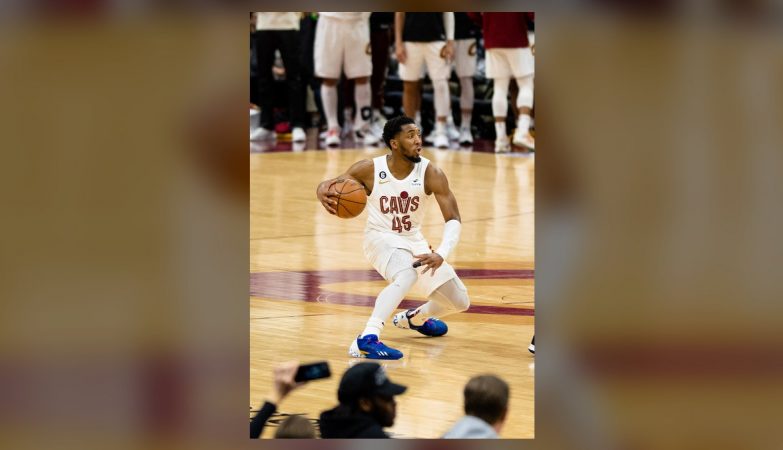
Rising team payrolls are putting pressure on some of the NBA’s highest-paid stars, with Donovan Mitchell and De’Aaron Fox among the names to watch.
MLB.com’s latest Rookie of the Year poll keeps two young standouts at the top, underscoring how closely watched the race remains in both leagues.
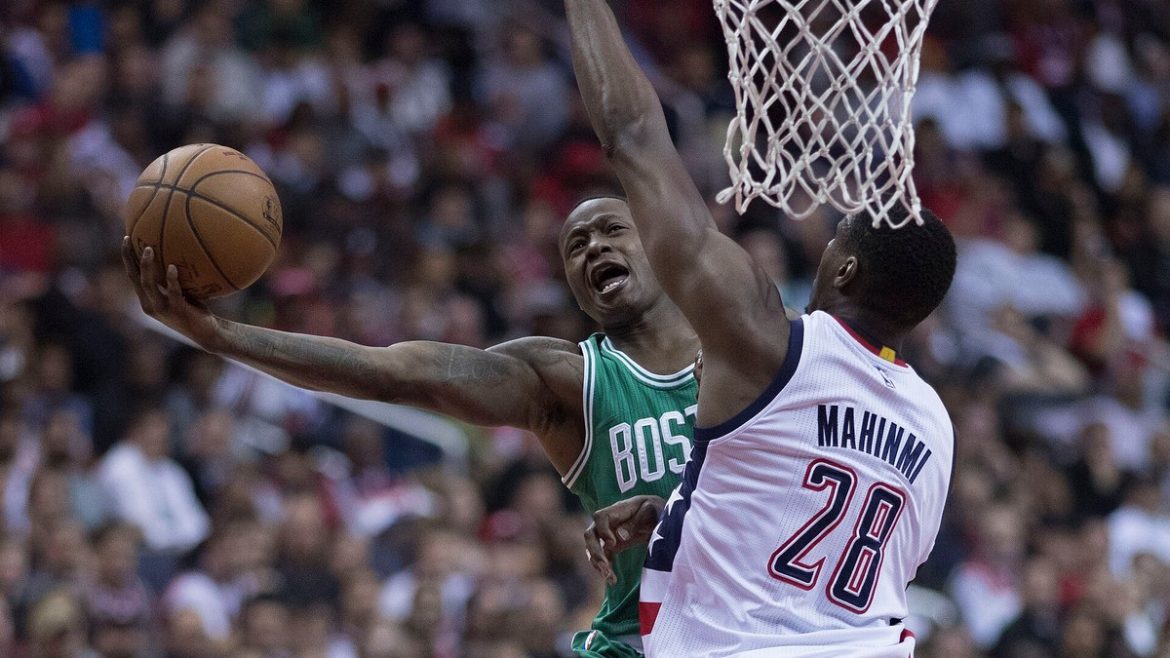
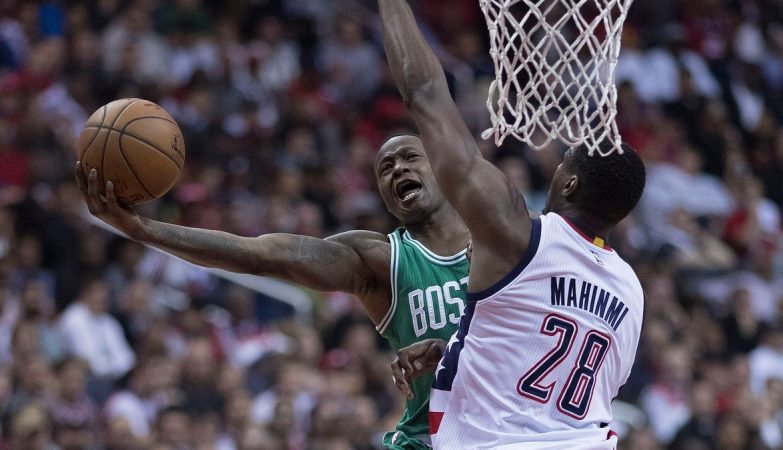
Terry Rozier reportedly wants to resume his NBA career, but legal bail conditions could make any return difficult. The situation leaves his immediate baske
A young MLB slugger’s recent home run binge has moved him within striking distance of the top of MLB.com’s Hitter Power Rankings, underscoring his rapid ri
ESPN’s latest NBA free agency and trade updates underscore how teams are still reshaping rosters, balancing urgency, cap constraints and long-term planning
NFL teams continue to pour money into cornerbacks as passing games shape roster-building priorities and premium defensive talent becomes harder to find.
A new report says the Chiefs and Cowboys came close to making a first-round draft trade, adding another layer to two franchises that rarely stay out of the
Oregon edge rusher Teitum Tuioti was named No. 22 on Sports Illustrated’s list of college football’s 25 most important players for 2026, underscoring his r
CBS Sports ranked Bijan Robinson No. 1 among NFL players under 25, with Puka Nacua close behind and three quarterbacks cracking the top 10.
The NFL has released a statement regarding Lions cornerback Terrion Arnold, prompting questions about the rookie’s status and the team’s next steps.