

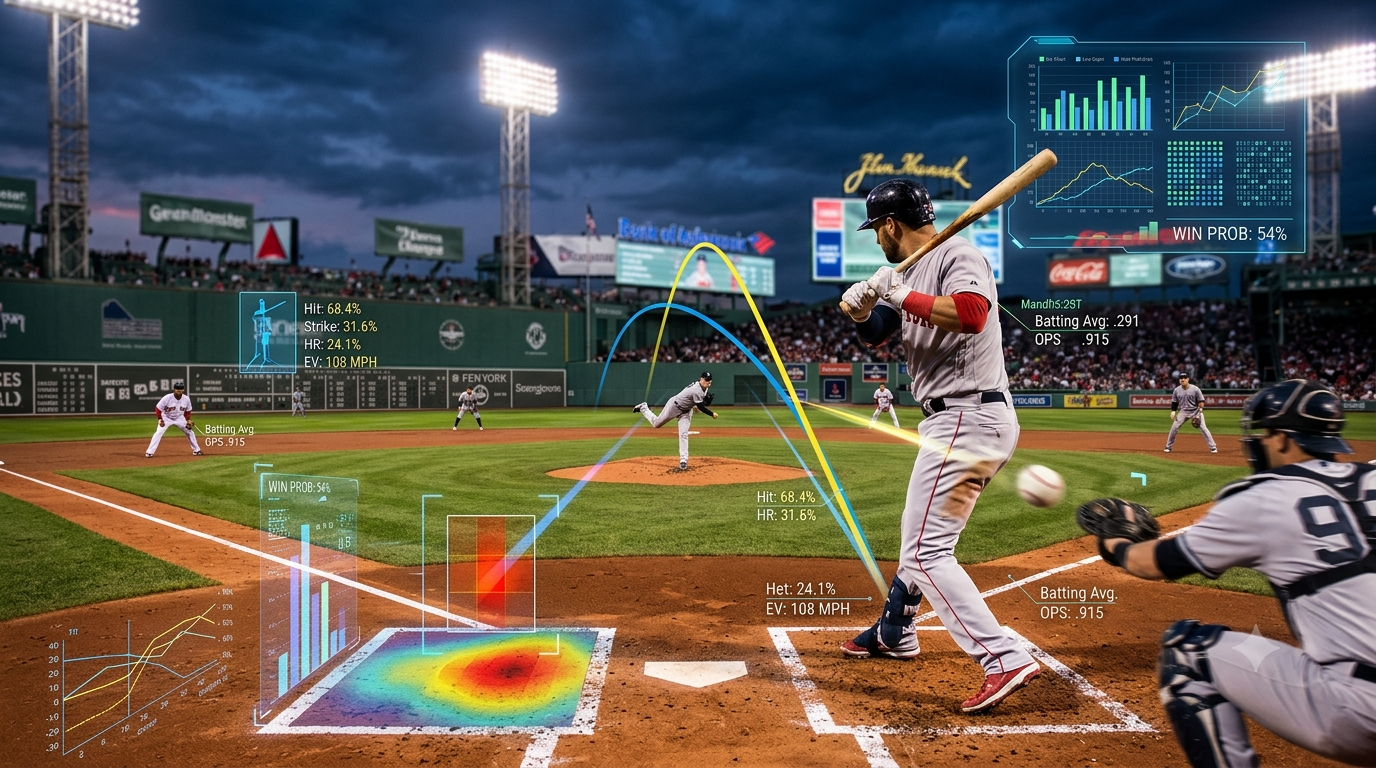
When people search for MLB game prediction software, they are usually hunting for something far deeper than a quick pick list. The strongest forecasting tools focus on calculating realistic probabilities rather than promising guarantees. In fact, many of these systems actively support sports performance forecasting by weighing individual player trends, offensive output, key matchups, and past performance to map out objective probabilities. Instead of leaning on intuition, these tools let empirical data show how often specific scenarios play out.
Baseball analytics have evolved at a wild pace over the past decade. With public stats becoming far more nuanced, processing speeds surging, and machine learning models handling massive datasets instantly, modeling a game looks nothing like it used to. Yet baseball stays notoriously unpredictable. Even the sharpest algorithmic models have to respect variance rather than pretend certainty exists.
This guide walks through how modern MLB forecasting platforms actually operate, what separates genuine probability modeling from simple guessing, and why working with realistic odds brings far more value than chasing flawless predictions.
Table of Contents
What Is MLB Game Prediction Software?
How Modern Models Build Forecasts
The Data Behind Every Projection
Why Probability Matters More Than Picking Winners
A Baseball Simulation Example
Fair Probability and Market Prices Are Different Things
Where MLB Prediction Software Commonly Falls Short
How ATSwins Approaches Baseball Forecasting
Why Data Quality Matters More Than Model Complexity
Conclusion
Frequently Asked Questions
What Is MLB Game Prediction Software?
At its core, MLB game prediction software is an analytical system designed to process baseball data and gauge the likelihood of different outcomes. Depending on how a model is configured, it might estimate win odds, run distributions, run line margins, player stats, or inning-by-inning game states.
Traditional picks usually rely on subjective opinions or gut feel. Software, on the other hand, evaluates objective information before assigning a number. It groups relevant facts into a structured framework before first pitch, offering an educated estimate of what should happen without making absolute guarantees.
A solid model treats every matchup as its own distinct puzzle. It weighs starting pitchers, line-ups, bullpen depth, defense, travel days, stadium traits, and weather factors. Even minor adjustments, like a heavy crosswind at Wrigley or a tired bullpen after an extra-inning game, can shift expectations.
Because an MLB season features 162 games per team, these platforms have massive datasets to learn from. That high volume helps models spot genuine trends while staying nimble enough to adjust as the long season unfolds.
How Modern Models Build Forecasts
Rarely does a top-tier platform rely on a single equation. Instead, multiple sub-models work together to build the final projection.
This technology often overlaps heavily with sports betting modeling software, as both rely on predictive algorithms, machine learning, and game simulations to evaluate likelihoods. While these projections can assist betting strategy, their primary purpose remains estimating probabilities based on facts rather than bias.
Looking at historical team numbers gives a good baseline, but recent streaks require careful handling. Winning ten in a row doesn't suddenly make a team invincible, just like a cold week doesn't mean a club lost its talent overnight. Reliable systems can tell the difference between true skill shifts and normal short-term noise.
Pitching is usually the heaviest factor in any model since starting pitchers shape so much of the game. Useful indicators include strikeout and walk percentages, expected ERA, pitch velocity, movement, workload, and ground-ball tendencies.
Offensive models look way beyond basic batting averages. Modern platforms track hard-hit rates, plate discipline, isolated power, expected weighted on-base average, and how hitters match up against specific pitch types. A lineup filled with high-exit-velocity hitters usually projects much differently than one that relies purely on contact.
Defensive metrics matter just as much for run prevention. Outfield range, infield shift adjustments, catcher framing, and double-play rates quiet scoreboards. These factors get less media attention than home runs, but they move the needle over time.
Once individual player projections are ready, models roll them into overall team simulations. Running a game thousands of times reveals how often each side comes out on top under those exact parameters.
Instead of declaring a guaranteed winner, the system might show Team A winning 58 percent of simulations and Team B winning 42 percent. That distinction matters because probability respects reality.
The Data Behind Every Projection
Good forecasts depend on good data. A model is only as smart as its inputs, which is why top modeling systems spend just as much energy gathering and cleaning data as they do writing code. Dumping in more information won't help if that data is old, partial, or misinterpreted.
Pitch-tracking technology transformed baseball analysis almost overnight. Today, public access covers metrics that were invisible a decade ago, like launch angles, exit velocities, spin rates, sprint speeds, and release points. These numbers flag performance changes long before they turn up in traditional box scores.
Take a starter whose ERA still looks solid on paper. Most casual fans assume he is pitching great. An analytical model might notice his fastball velocity dropped two miles per hour over his last three outings while his whiff rate dipped. That warning sign leads the model to increase expected runs for the opponent, even if his ERA hasn't spiked yet.
Ballpark specifics play an equally big role. Every stadium changes how a game plays out. High-altitude venues boost scoring, while massive outfields or damp evening air slow things down. Software factors in stadium dimensions instead of treating every park identical.
Weather needs active tracking too. Temperature, humidity, rain, and wind directions alter ball flight. A warm summer day with wind blowing out creates a totally different environment than a crisp April night with wind blowing in. Small weather details compound quickly.
Bullpen tracking has also become essential as starters pitch fewer innings. Even when two starters project closely, differences in relief depth, recent pitch counts, and high-leverage availability can tip the odds in late innings.
None of these factors work in isolation. A fly-ball pitcher playing in a hitter's park on a windy afternoon projects completely differently than he would in a cold, deep park. Modern platforms evaluate these combined factors as a whole.
Why Probability Matters More Than Picking Winners
A common mistake when looking at prediction tools is grading them purely on simple win-loss records.
Imagine two separate models: Model A gets 60 out of 100 picks right. Model B gets 58 out of 100 picks right.
On paper, Model A looks like the winner. In practice, the truth is often more nuanced.
Forecast value comes down to calibration. A well-calibrated system produces probabilities that mirror real-world outcomes over large samples.
If Model A labels heavy favorites with an 80 percent win chance when those teams actually win only 65 percent of the time, its confidence is way too high. Its picks look decent, but its math is off.
Model B might be more realistic. When it gives teams a 60 percent shot, those teams win right around 60 percent of the time over hundreds of games. When it says 70 percent, they hit at 70 percent.
From a pure modeling perspective, Model B gives you far better data because its numbers reflect real-world distributions.
That difference is crucial when comparing model forecasts against market prices. Instead of asking who will win tonight, disciplined users ask how often each team wins if this exact game plays out thousands of times.
That mindset separates serious modeling from casual guessing.
This explains why experienced handicappers and analysts rely heavily on sports betting probability software instead of basic pick sites. Probability-focused engines measure overall performance across huge samples instead of overreacting to single-game results.
A Baseball Simulation Example
To see why modern tools rely on monte carlo simulations instead of simple static formulas, picture two evenly matched teams playing mid-season.
The home team starts an ace who has shown top-tier command for a month. The away team starts a veteran known for inducing soft contact, though he rarely strikes guys out. Both lineups are average overall, but the home team hits left-handed pitching much better. Forecasts call for mild weather with a slight breeze toward right field.
A simple model might check overall records and pick the home team simply because they won a few more recent games.
An advanced projection system works completely differently.
It projects every batter against the starting pitcher, factoring in park effects, weather, bullpen usage, defense, rest, and lineup order. Then it runs the game through thousands of computer simulations.
In one simulation, a early three-run homer forces a quick bullpen call. In another, great outfield defense saves two runs. Some runs finish in nine innings, while others go into extras after late rallies.
After running thousands of iterations, the model reveals that the home team wins roughly 57 percent of the time, leaving the visitors with 43 percent, while projecting an average total of 8.2 runs.
Simulations do not attempt to predict the exact script of a single night. They show the distribution of likely outcomes under specific conditions. That approach handles baseball variance far better than assuming a single result is locked in.
Fair Probability and Market Prices Are Different Things
Understanding the gap between internal model projections and market prices is a fundamental step in sports modeling. While related, they are distinct concepts that shouldn't be confused.
Say a model projects Team A with a 60 percent win probability. That number represents pure analytical output based on pitching, hitting, weather, bullpen health, and park factors.
The market price on that same game might reflect something different. Sportsbooks adjust lines based on public money flow, injury updates, liability, and risk management. As a result, the market's implied probability might sit above or below what your model calculated.
A sharp process compares those two numbers without assuming either is automatically right. Models are judged on how accurately their probabilities line up with long-term results over hundreds of games.
This is why experienced analysts spend time evaluating probability gaps rather than posting daily winner lists. Reliable, well-calibrated numbers offer far more long-term value than short-term luck.
ATSwins.ai uses this approach by focusing on simulations, statistical modeling, and objective probabilities instead of framing projections as guarantees. The goal is to deliver clear data that users can process logically.
Where MLB Prediction Software Commonly Falls Short
Even top-tier modeling platforms hit hurdles. Baseball changes fast, and no program accounts for every single real-world event perfectly.
Late lineup changes stay tricky. If a marquee hitter gets scratched an hour before first pitch, team offense drops instantly. If software updates slowly, it ends up running on old inputs.
Managing relief usage is tough too. Managers don't follow rigid rules every night. A reliever who threw thirty pitches yesterday might technically be ready, but his manager might hold him out unless necessary. Algorithms struggle to capture human managerial choices perfectly.
Weather can swing unexpectedly. Wind can turn right before first pitch, temperatures can drop, or rain delays can cut a starter's night short. Tiny environmental shifts alter scoring output.
Small sample sizes bring noise. When a rookie comes up and hits well for two weeks, solid platforms avoid assuming that short stretch reflects his true baseline skill. Good models weight short bursts against broader baseline averages to avoid overreacting.
Injuries add noise too. Players often play through minor tweaks that hamper performance in ways stats don't immediately capture. Defensive positioning shifts, stolen base calls, and bench management also introduce real variance.
The best software accepts these blind spots rather than hiding them. Honest platforms update inputs constantly while keeping inherent variance front and center.
How ATSwins Approaches Baseball Forecasting
At ATSwins.ai, baseball forecasts rely on structured data rather than flashy claims. The platform combines simulation models, sports performance forecasting, and core methods used in sports betting modeling software to assess every game through clear probability metrics.
Rather than trying to pick winners, the process looks at the full spread of probable outcomes. Starter projections, matchup edges, bullpen loads, defense, travel, recent form, weather shifts, and simulation outputs all feed into the final distribution.
Every run accepts that baseball is fundamentally random in short bursts. The goal isn't to deny that randomness, but to measure it accurately.
For instance, a pitcher might carry a clean ERA while his underlying numbers show trouble ahead. Declining velocity, rising walk rates, or weaker contact metrics signal trouble before the ERA spikes. Catching those shifts early keeps projections ahead of surface-level numbers.
Projections adapt as new data comes in. Confirmed lineups, bullpen news, weather updates, and late scratches adjust the output right up until first pitch.
This dynamic approach fits core statistical principles: as inputs get clearer, projections get sharper. Models refine their output as uncertainty shrinks leading into game time.
The end goal isn't predicting every individual game correctly. No software can do that in a sport as unpredictable as baseball. The goal is building consistent, well-calibrated probability distributions using clean data every step of the way.
Why Data Quality Matters More Than Model Complexity
It is easy to assume that complex algorithms automatically deliver better forecasts. In reality, output quality depends much more on clean inputs than on mathematical tricks.
A complex neural network fed messy or outdated data will lose to a simple model running on accurate inputs every time. Math cannot magically create truth out of bad data.
Good forecasting relies on solid inputs. Starting lineups, pitch-tracking metrics, injury updates, bullpen status, weather, travel, and defensive stats form the foundation before calculations even begin.
Analysts sum this up with a classic line: garbage in, garbage out. Fancy math won't save bad inputs.
That makes data cleaning a huge part of the daily workflow. Missing information must be handled properly, numbers need constant updates, and weird anomalies must be filtered out. Fixing small data issues usually yields bigger accuracy gains than switching to a more complicated algorithm.
Model checking matters just as much. Solid platforms continuously test their probabilities against actual results, tracking calibration, error rates, and long-term trends to keep projections aligned with changing league environments.
That focus on clean inputs and honest tracking is what separates real modeling from platforms that just throw out wild predictions without validation.
Conclusion
MLB game prediction software has moved far beyond simple pick-generating tools. Modern platforms combine individual projections, advanced metrics, machine learning, monte carlo simulations, and probability distributions to estimate how games unfold. While technology has come a long way, baseball remains inherently unpredictable.
The best forecasting systems respect that reality. Instead of claiming perfection, they focus on building well-calibrated probabilities that adjust as fresh news arrives. That systematic process keeps projections objective, clear, and tied to real evidence.
Whether you are comparing MLB game prediction software options, looking into sports betting probability software, or studying sports performance forecasting, knowing how these platforms build their numbers gives you better context for using their outputs. Forecasting isn't about removing chance. It is about measuring chance as cleanly as possible using solid data, sound math, and constant testing.
ATSwins.ai applies this mindset by pairing predictive analytics and simulations into a clean forecasting platform built for smart evaluation. Instead of relying on hype or bold claims, it offers objective analysis and probability-based metrics that move with the game.
Frequently Asked Questions
Is MLB game prediction software always accurate?
No. Baseball carries high inherent randomness, and no platform hits every game. Even top models expect misses because unexpected injuries, rain delays, manager decisions, and fluke bounces happen all season long. The goal is estimating realistic probabilities rather than expecting perfection.
What statistics matter most in baseball forecasting?
Starting pitching, bullpen readiness, lineup depth, defense, park dimensions, weather, rest schedules, and roster health all play major roles. Modern models also lean heavily on Statcast indicators like exit velocity, launch angles, pitch movement, and expected metrics to improve accuracy.
Does machine learning guarantee better predictions?
No. Machine learning is a helpful tool, but output quality still hinges on clean data, proper tuning, rigorous testing, and accurate calibration. Advanced algorithms cannot fix bad inputs.
Why do prediction models disagree?
Models weigh variables differently. One system might weigh recent hot streaks heavily, while another focuses on long-term baseline talent, underlying Statcast numbers, or simulation distributions. Because different analytical methods process the same dataset in unique ways, models naturally arrive at different probabilities for the same game.