


BOWLING GREEN
BOWLING GREENBGSU
2-7 | Road
10

WESTERN MICHIGAN
W MICHIGANWMU
6-3 | Home
23
Key Game

KEY GAME
Ryan Kingston
#30 | Punter@

KEY GAME
Ryan Millmore
#25 | Punter| Player | |
|---|---|
| Ryan Kingston | None-None |
| Ryan Millmore | None-None |
None-None
W-L
None-None
AI Model Win Probability
BOWLING GREEN
15%
W MICHIGAN
85%
BOWLING GREEN
18%
Book Odds: +466
W MICHIGAN
86%
Book Odds: -590
AI Model Projected Total
AI Projection
51.0
Projected
Book Total
45.0
Over / Under Line
▲
Edge: +6.0 (Over)
Over 45.0
64%
Under 45.0
36%
AI Model Spread Expectation
AI Spread Proj
-18.6
WESTERN MICHIGAN
Book Spread
-14
Book Line
▲ Edge: +4.6 points (Western Michigan)
Spread Distribution
AI Model
+42+28+140-14-28-42
Distribution centered around WMU -18.6 expected margin.
Margin of Victory (WMU)
BGSU By 1-6 points
5.0%
BGSU By 7-13 points
2.6%
WMU By 1-6 points
9.6%
WMU By 7-13 points
16.4%
AI Model Projected Score
Bowling Green
16.2
BOWLING GREEN
Book Implied: 15.50
Western Michigan
34.8
WESTERN MICHIGAN
Book Implied: 29.50
Simulated Score
Bowling Green
16
BOWLING GREEN
Book Implied: 15.50
Western Michigan
29
WESTERN MICHIGAN
Book Implied: 29.50
Projections Grades
Moneyline (ML)
Agreement
👑 Top Selection
AI
W Michigan
Win
85% Win Prob
A
Sim
W Michigan
Win
90% Win Prob
A
Point Spread (ATS)
Divergence
AI
W Michigan (-14)
Loss
Proj Spread: -18.6
B
Sim
Bowling Green (+14)
Win
Proj Spread: +13.0
C
Over/Under (Total)
Divergence
AI
o45.0
Loss
Proj Total: 51.0
B
Sim
u45.0
Win
Proj Total: 45.0
D
Head-to-Head History
Date
Game
Score
Oct 31, 2026
BGSU @ WMU
10 - 23
Nov 12, 2024
WMU @ BGSU
13 - 31
Nov 21, 2023
BGSU @ WMU
34 - 10
Nov 2, 2022
WMU @ BGSU
9 - 13
Oct 26, 2019
BGSU @ WMU
10 - 49
Key Model Drivers
Rushing Yards (L5)
+41.8% more
Western Michigan: 174.1
vs
Bowling Green: 122.8
Turnovers (L5)
+8.7% more
Western Michigan: 1.4
vs
Bowling Green: 1.3
Post-Mortem Analysis
Metric
Projected
Actual
Score Game
BGSU Score
16.2
10
WMU Score
34.8
23
Team Stats Splits (Home / Away)
First Downs
18.5 / 17.8
15.0 / 16.0
Rushing Yards
174.1 / 122.8
190.0 / 125.0
Third Down Efficiency
0.4 / 0.5
0.29 / 0.44
Time of Possession
0.5 / 0.5
0.46 / 0.54
Total Yards
339.8 / 318.5
336.0 / 274.0
Turnovers
1.4 / 1.3
2.0 / 3.0
Public Market Splits
Moneyline
Open: +525 / -750
→
+466 / -590
↓
Spread (ATS)
Open: +15.5 / -15.5
→
+14 / -14
↓
Total (O/U)
Open: 43.5
→
45
↑
Situational Trends
📊 Win-Loss
BGSU
3-7-0
(30.0%)
Margin: -9.6
ATS +/-: -1.9
WMU
Advantage
7-3-0
(70.0%)
Margin: 9.1
ATS +/-: +2.6
🎯 ATS (Spread)
BGSU
Advantage
5-5-0
(50.0%)
Margin: -9.6
ATS +/-: -1.9
WMU
3-6-0
(33.3%)
Margin: 9.1
ATS +/-: +2.6
⚖️ Over/Under
BGSU
7-3-0
O: 70.0% / U: 30.0%
Total +/-: +2.9
WMU
5-5-0
O: 50.0% / U: 50.0%
Total +/-: -1.1
Season to Date Model Accuracy
AI Model
SIM Engine
WMU
BGSU
WMU
BGSU
ML
90%
9-1
70%
7-3
70%
7-3
70%
7-3
ATS
50%
5-5
60%
6-4
80%
8-2
50%
5-5
TTL
50%
5-5
90%
9-1
50%
5-5
60%
6-4
Contextual Game News

Air Force Ground Game Overpowers UConn in 35-26 Victory

Maddux Madsen's Zero-INT Start Places Him Among Nation's Elite Q…
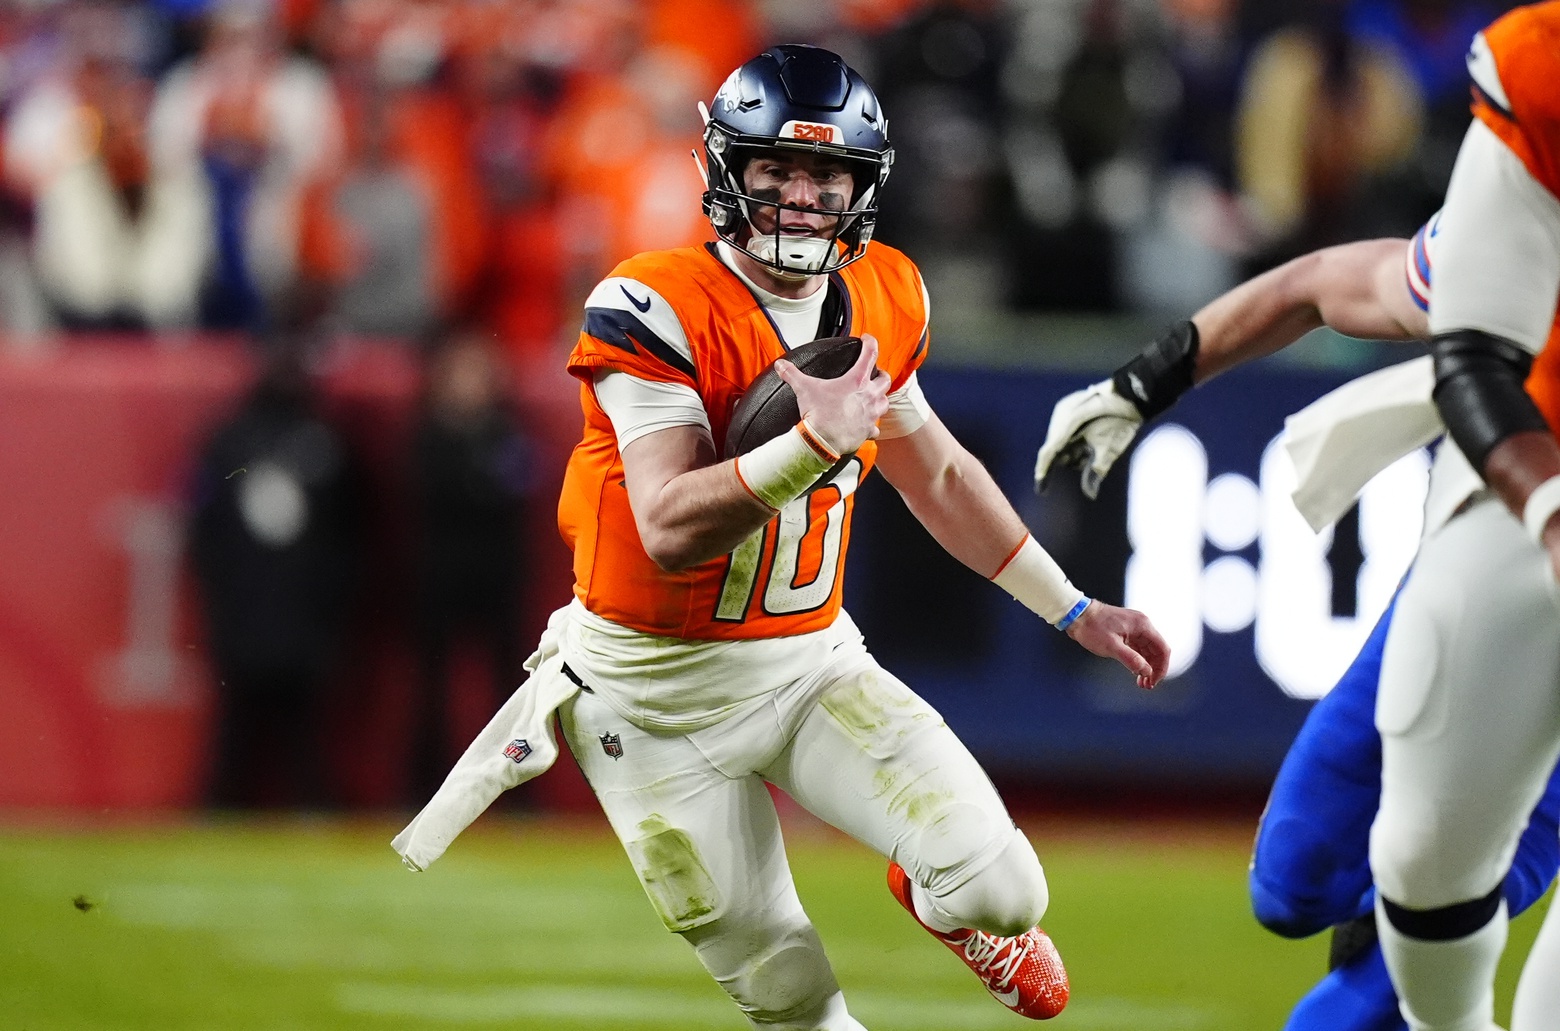
Ryan Fitzpatrick Unleashes Scathing Critique of Bo Nix Despite B…

Boise State vs. Oregon State: Who Holds the Edge in the Pac-12 T…
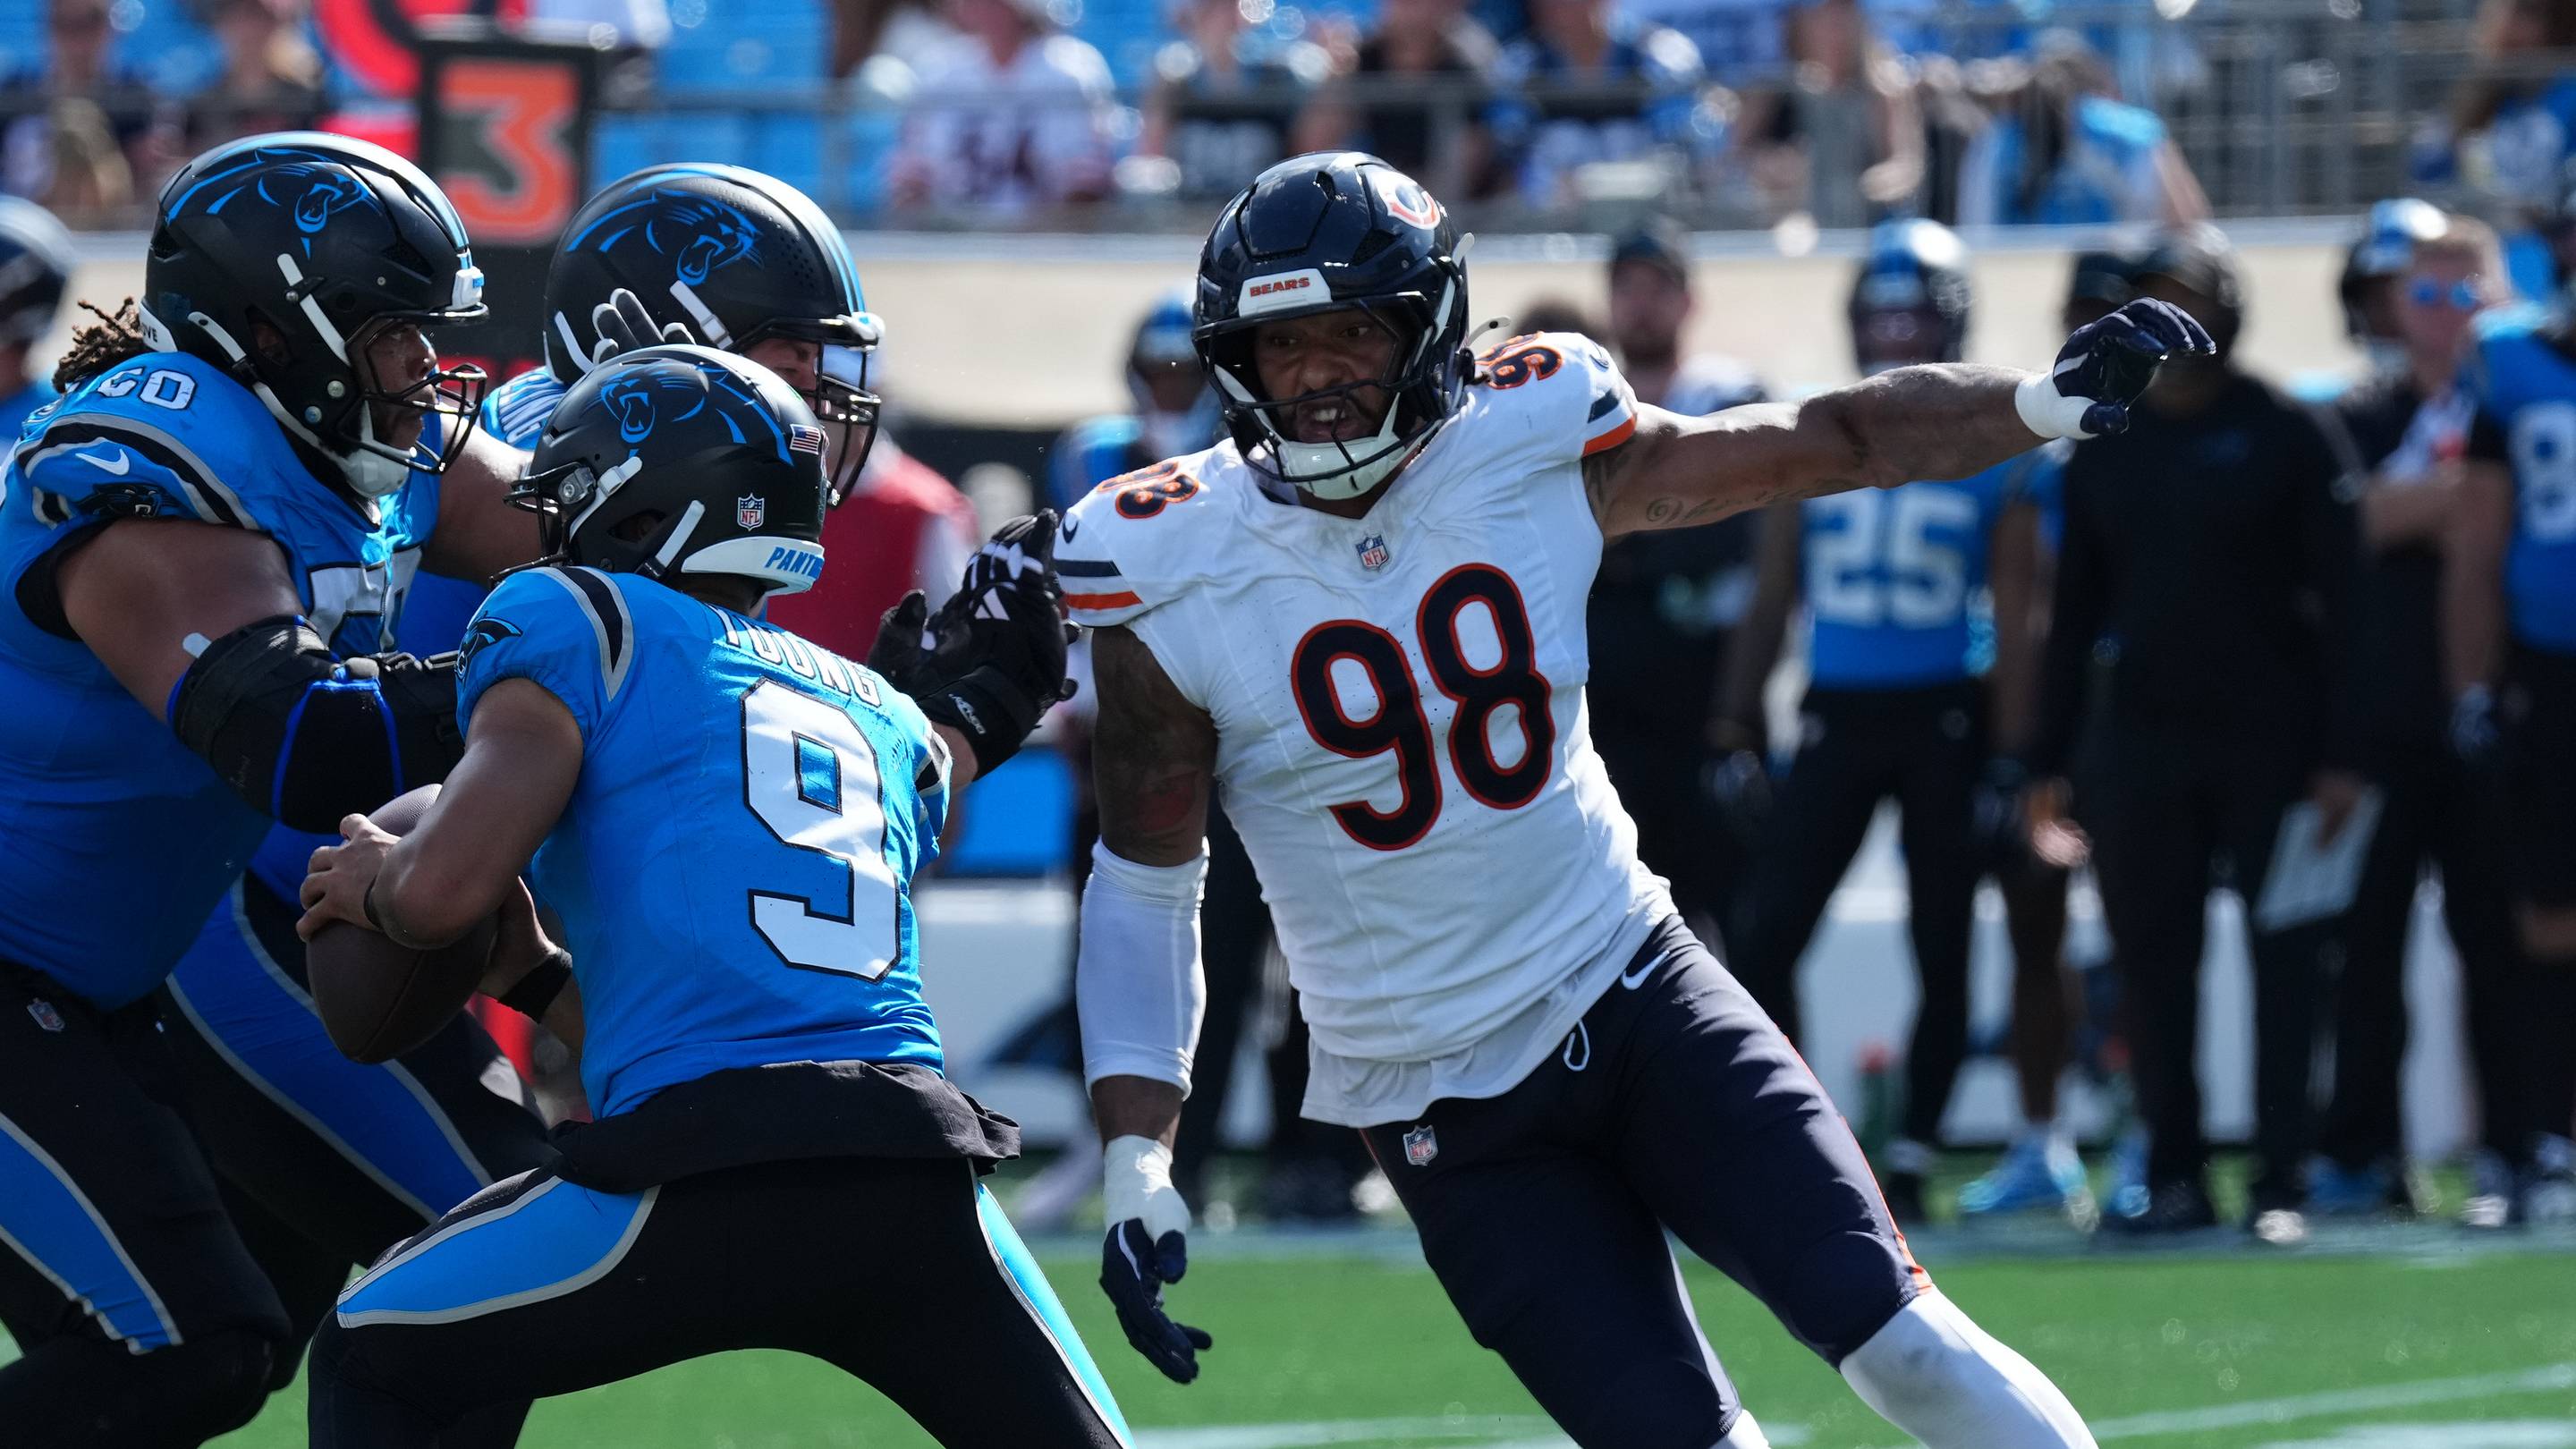
Bears May Be Without Two Key Starters Against Falcons in Week 6