



OTTAWA
SENATORSOTT
5-1-0 | Road
4


NEW JERSEY
DEVILSNJ
2-3-0 | Home
1
Goaltending

GOALTENDER
Linus Ullmark
#35 | Goaltender@

GOALTENDER
Jonas Siegenthaler
#71 | Defense| Player | W-L-OTL | GAA | SV% | SO |
|---|---|---|---|---|
| Linus Ullmark | None-None | 1.00 | 0.967 | -- |
| Jonas Siegenthaler | None-None | -- | -- | -- |
None-None
W-L-OTL
None-None
1.00
GAA
--
0.967
Save %
--
--
SO
--
AI Model Win Probability
SENATORS
47%
DEVILS
53%
SENATORS
49%
Book Odds: +104
DEVILS
54%
Book Odds: -115
AI Model Projected Total
AI Projection
6.0
Projected
Book Total
6.0
Over / Under Line
Over 6.0
49%
Under 6.0
51%
AI Model Spread Expectation
AI Spread Proj
-1.6
NEW JERSEY
Book Spread
-1.5
Book Line
▲ Edge: +0.1 points (New Jersey)
Spread Distribution
AI Model
+6+4+20-2-4-6
Distribution centered around NJ -1.6 expected margin.
Margin of Victory (NJ)
OTT By 1 goal
8.6%
OTT By 2-3 goals
5.5%
NJ By 1 goal
18.9%
NJ By 2-3 goals
34.9%
AI Model Projected Score
Ottawa
2.2
OTTAWA
Book Implied: 2.20
New Jersey
3.8
NEW JERSEY
Book Implied: 3.80
Simulated Score
Ottawa
4
OTTAWA
Book Implied: 2.20
New Jersey
3
NEW JERSEY
Book Implied: 3.80
Projections Grades
Moneyline (ML)
Divergence
AI
Devils
Loss
53% Win Prob
D
Sim
Senators
Win
70% Win Prob
A
Puck Line (ATS)
Divergence
AI
Devils (-1.5)
Loss
Proj Goals: -1.6
D
Sim
Senators (+1.5)
Win
Proj Goals: -1.0
A
Over/Under (Total)
Divergence
AI
u6.0
Win
Proj Total: 6.0
D
Sim
o6.0
Loss
Proj Total: 7.0
A
Head-to-Head History
Date
Game
Score
Oct 12, 2026
OTT @ NJ
4 - 1
Apr 12, 2026
OTT @ NJ
3 - 4
Jan 31, 2026
NJ @ OTT
1 - 4
Dec 9, 2025
NJ @ OTT
4 - 3
Sep 28, 2025
NJ @ OTT
0 - 2
Key Model Drivers
Shots on Goal (L5)
+57.4% more
New Jersey: 38.2
vs
Ottawa: 24.3
Power Play % (L5)
+16.5%
New Jersey: 29.4%
vs
Ottawa: 13.0%
Blocked Shots (L5)
+42.7% more
Ottawa: 16.8
vs
New Jersey: 9.6
Hits (L5)
+38.7% more
Ottawa: 26.5
vs
New Jersey: 16.3
Post-Mortem Analysis
Metric
Projected
Actual
Score Game
OTT Score
2.2
4
NJ Score
3.8
1
Team Stats Splits (Home / Away)
Blocked Shots
9.6 / 16.8
13.0 / 30.0
Faceoff %
50.5 / 53.8
47.3 / 52.7
Hits
16.3 / 26.5
11.0 / 21.0
Power Play %
29.4 / 13.0
0.0 / 20.0
Shots on Goal
38.2 / 24.3
30.0 / 20.0
Takeaways
4.2 / 4.8
4.0 / 4.0
Public Market Splits
Moneyline
Open: +110 / -130
→
+104 / -115
↓
Spread (ATS)
Open: +1.5 / -1.5
→
+1.5 / -1.5
Total (O/U)
Open: 5.5
→
6
↑
Season to Date Model Accuracy
AI Model
SIM Engine
NJ
OTT
NJ
OTT
ML
50%
7-7
43%
6-8
57%
8-6
50%
7-7
ATS
50%
7-7
29%
4-10
50%
7-7
64%
9-5
TTL
33%
4-8-2
50%
7-7
50%
6-6-2
57%
8-6
Contextual Game News
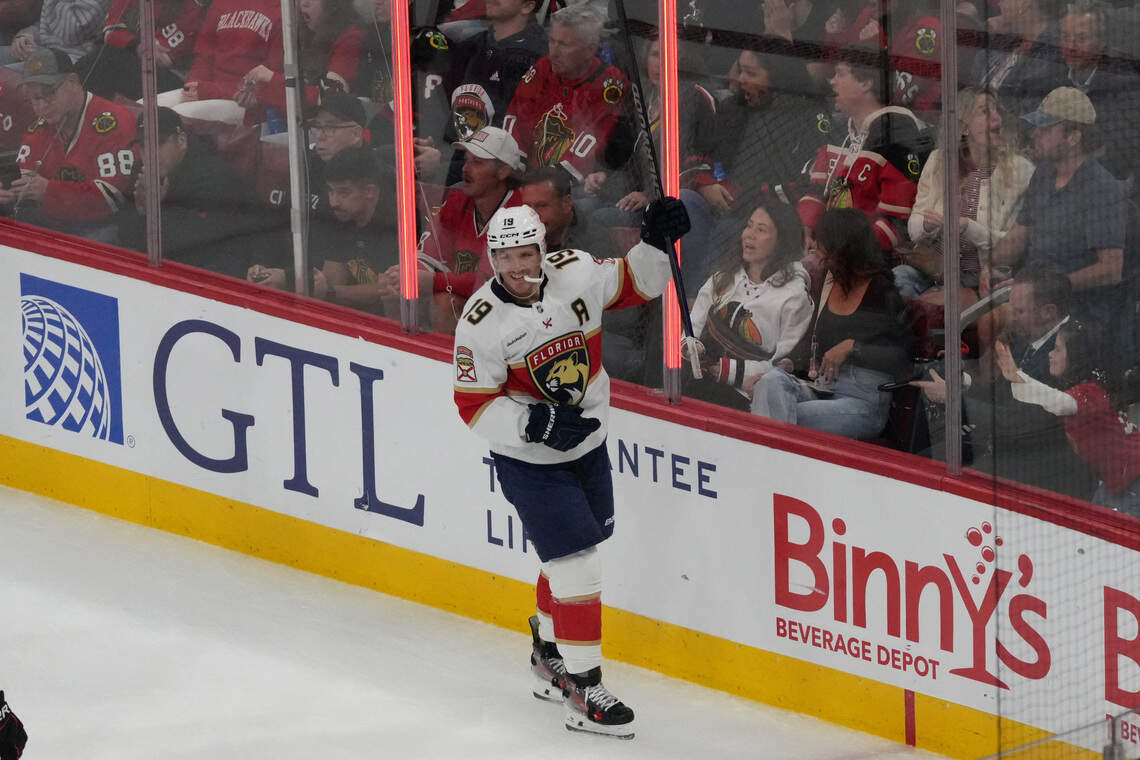
Florida Panthers' October to Remember: Five Hat Tricks, Record-B…

Philly Sports' October Nightmare: Injuries, Losing Streaks, and …
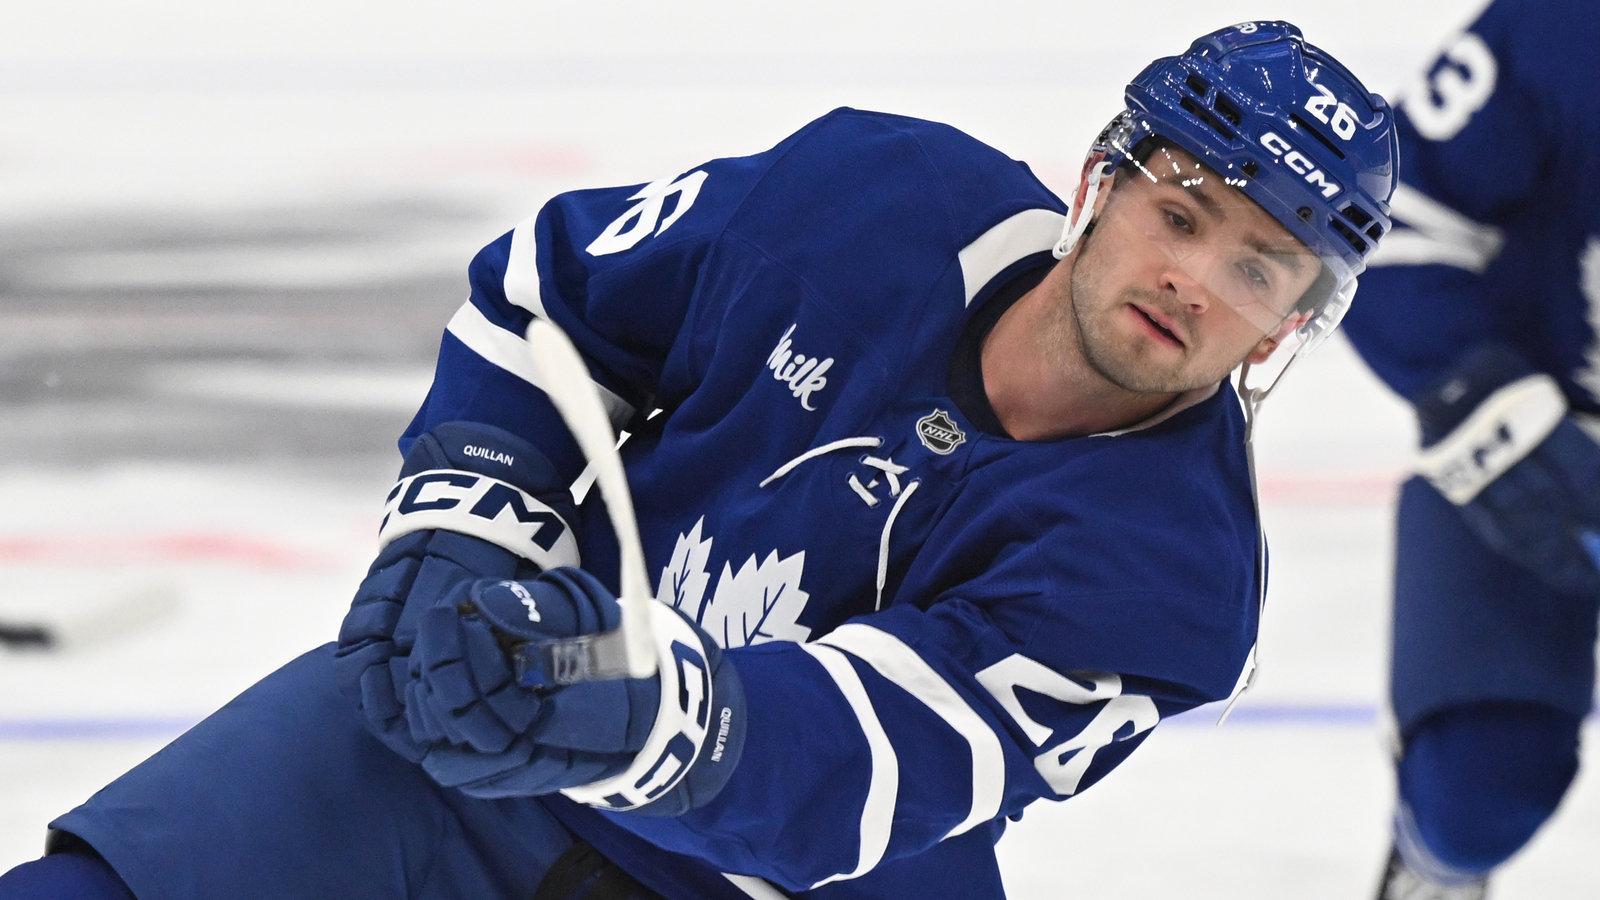
Canucks Promote Quillan, Place Chytil on Injured Reserve

Hayden Hodgson Faces NHL Player Safety Hearing After Elbow on Br…
Islanders' Logan Stanley Proving Doubters Wrong with Stellar Two…