



VANCOUVER
CANUCKSVAN
2-5-0 | Road
2


NEW YORK
RANGERSNYR
5-2-0 | Home
6
Goaltending

GOALTENDER
Kevin Lankinen
#32 | Goaltender@

GOALTENDER
Dylan Garand
#33 | Goaltender| Player | W-L-OTL | GAA | SV% | SO |
|---|---|---|---|---|
| Kevin Lankinen | None-None | 6.00 | 0.760 | -- |
| Dylan Garand | None-None | 2.00 | 0.905 | -- |
None-None
W-L-OTL
None-None
6.00
GAA
Ldr 2.00
0.760
Save %
Ldr 0.905
--
SO
--
AI Model Win Probability
CANUCKS
29%
RANGERS
71%
CANUCKS
31%
Book Odds: +225
RANGERS
74%
Book Odds: -278
AI Model Projected Total
AI Projection
7.5
Projected
Book Total
6.5
Over / Under Line
▲
Edge: +1.0 (Over)
Over 6.5
66%
Under 6.5
34%
AI Model Spread Expectation
AI Spread Proj
+1.5
VANCOUVER
Book Spread
+1.5
Book Line
Spread Distribution
AI Model
+6+4+20-2-4-6
Distribution centered around VAN +1.5 expected margin.
Margin of Victory (VAN)
VAN By 1 goal
9.2%
VAN By 2-3 goals
6.1%
NYR By 1 goal
19.1%
NYR By 2-3 goals
34.1%
AI Model Projected Score
Vancouver
3
VANCOUVER
Book Implied: 2.50
New York
4.5
NEW YORK
Book Implied: 4
Simulated Score
Vancouver
2
VANCOUVER
Book Implied: 2.50
New York
3
NEW YORK
Book Implied: 4
Projections Grades
Moneyline (ML)
Agreement
👑 Top Selection
AI
Rangers
Win
71% Win Prob
A
Sim
Rangers
Win
69% Win Prob
A
Puck Line (ATS)
Agreement
AI
Canucks (-1.5)
Win
Proj Goals: +1.5
D
Sim
Canucks (+1.5)
Loss
Proj Goals: +1.0
B
Over/Under (Total)
Divergence
👑 Top Selection
AI
o6.5
Win
Proj Total: 7.5
A
Sim
u6.5
Loss
Proj Total: 5.0
A
Head-to-Head History
Date
Game
Score
Oct 11, 2026
VAN @ NYR
2 - 6
Dec 16, 2025
VAN @ NYR
3 - 0
Oct 28, 2025
NYR @ VAN
2 - 0
Mar 22, 2025
VAN @ NYR
3 - 5
Nov 19, 2024
NYR @ VAN
4 - 3
Key Model Drivers
Hits (L5)
+24.8% more
New York: 28.9
vs
Vancouver: 23.2
Faceoff % (L5)
+3.4%
New York: 52.1%
vs
Vancouver: 48.7%
Blocked Shots (L5)
+8.3% more
Vancouver: 15.2
vs
New York: 13.9
Post-Mortem Analysis
Metric
Projected
Actual
Score Game
VAN Score
3.0
2
NYR Score
4.5
6
Team Stats Splits (Home / Away)
Blocked Shots
13.9 / 15.2
14.0 / 14.0
Faceoff %
52.1 / 48.7
62.0 / 38.0
Hits
28.9 / 23.2
22.0 / 33.0
Power Play %
24.3 / 24.8
50.0 / 0.0
Shots on Goal
22.8 / 21.5
25.0 / 21.0
Takeaways
4.8 / 4.8
3.0 / 7.0
Public Market Splits
Moneyline
Open: +190 / -230
→
+225 / -278
↑
Spread (ATS)
Open: +1.5 / -1.5
→
+1.5 / -1.5
Total (O/U)
Open: 6.5
→
6.5
Season to Date Model Accuracy
AI Model
SIM Engine
NYR
VAN
NYR
VAN
ML
64%
9-5
80%
12-3
50%
7-7
73%
11-4
ATS
57%
8-6
47%
7-8
50%
7-7
47%
7-8
TTL
57%
8-6
47%
7-8
57%
8-6
53%
8-7
Contextual Game News
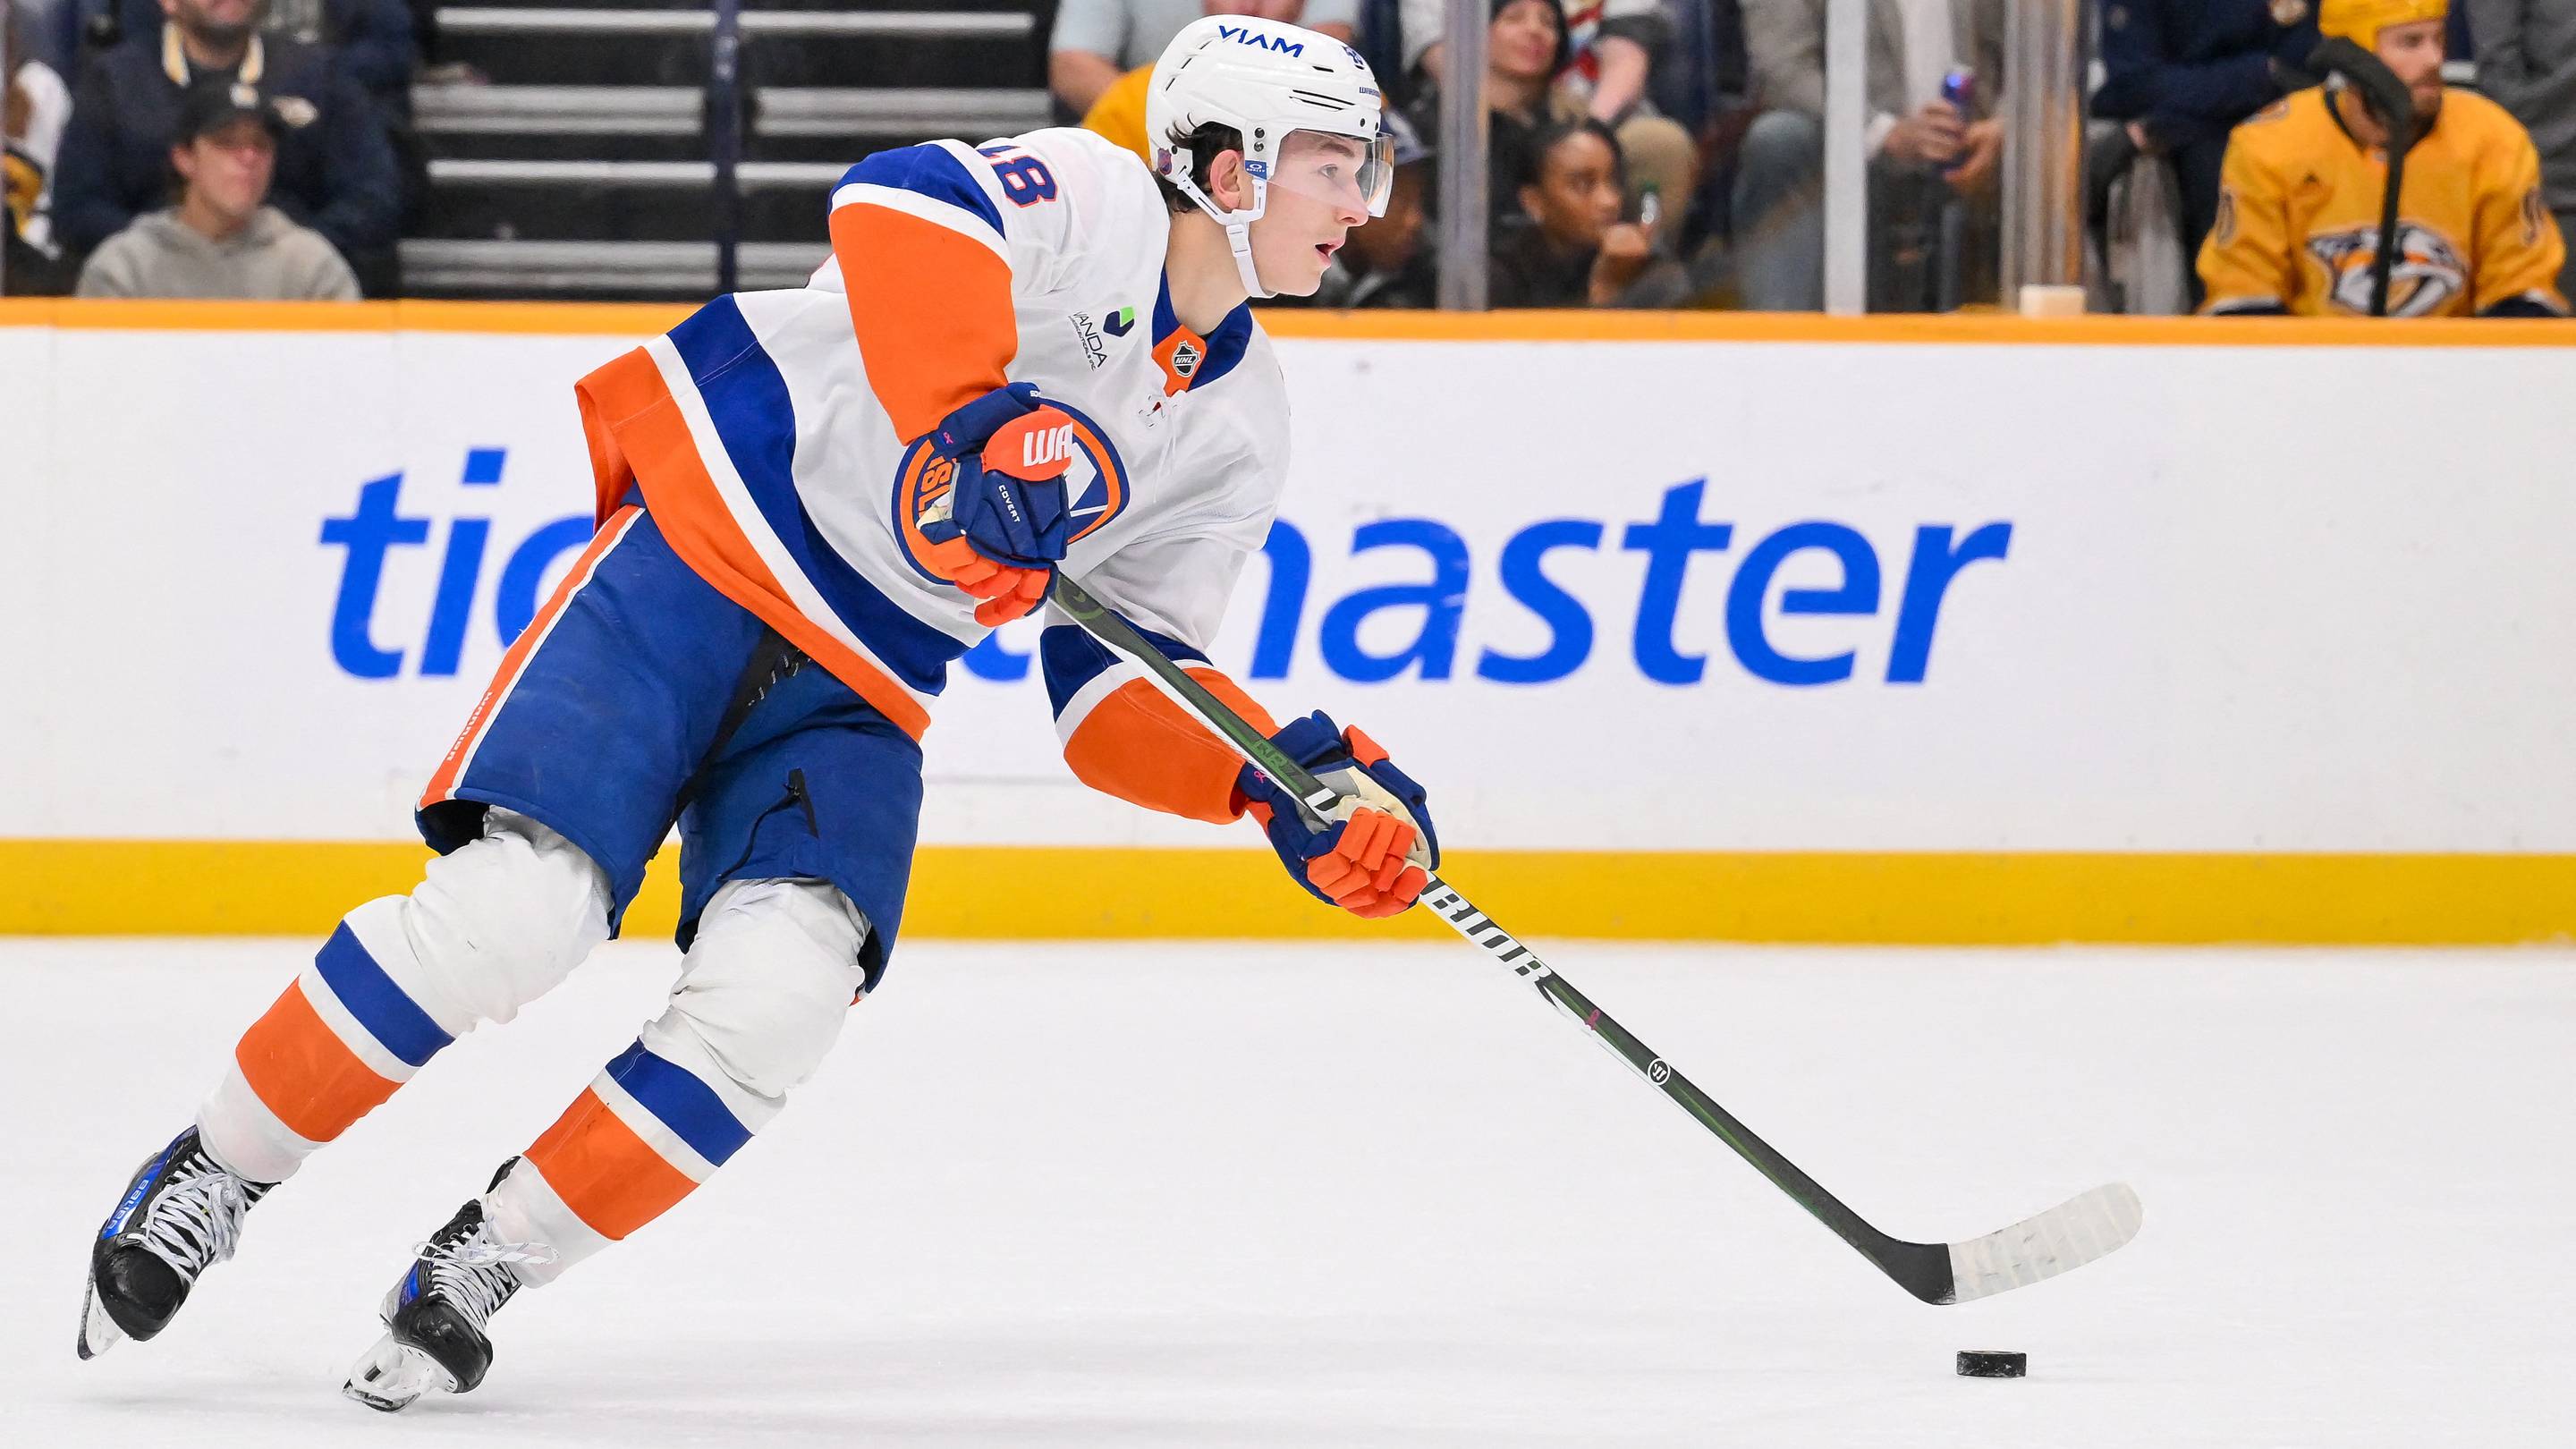
Matthew Schaefer's Historic Workload Not Slowing Elite Productio…

Elias Pettersson Unlikely to Accept Trade to Montreal Canadiens,…

Blue Jackets Feel the Sting of Losing Ivan Provorov as Defensive…

Adam Fox's $9.5M Deal Emerges as NHL's Biggest Steal as Market S…

Peter Laviolette Opens Up About Rangers Tenure and New Chapter w…