



CAROLINA
PANTHERSCAR
4-5 | Road
20


NEW ORLEANS
SAINTSNO
3-6 | Home
17
Key Game

KEY GAME
Sam Martin
#6 | Punter@

KEY GAME
Ryan Wright
#17 | Punter| Player | |
|---|---|
| Sam Martin | None-None |
| Ryan Wright | None-None |
None-None
W-L
None-None
AI Model Win Probability
PANTHERS
49%
SAINTS
51%
▲ Edge: +1% (NO)
PANTHERS
54%
Book Odds: -118
SAINTS
51%
Book Odds: -102
AI Model Projected Total
AI Projection
50.0
Projected
Book Total
48.5
Over / Under Line
▲
Edge: +1.5 (Over)
Over 48.5
55%
Under 48.5
45%
AI Model Spread Expectation
AI Spread Proj
-1.0
NEW ORLEANS
Book Spread
+1.5
Book Line
▲ Edge: +2.5 points (New Orleans)
Spread Distribution
AI Model
+42+28+140-14-28-42
Distribution centered around NO -1.0 expected margin.
Margin of Victory (NO)
CAR By 1-6 points
16.1%
CAR By 7-13 points
14.6%
NO By 1-6 points
16.7%
NO By 7-13 points
16.1%
AI Model Projected Score
Carolina
24.5
CAROLINA
Book Implied: 25
New Orleans
25.5
NEW ORLEANS
Book Implied: 23.50
Simulated Score
Carolina
21
CAROLINA
Book Implied: 25
New Orleans
23
NEW ORLEANS
Book Implied: 23.50
Projections Grades
Moneyline (ML)
Agreement
AI
Saints
Loss
51% Win Prob
D
Sim
Saints
Loss
57% Win Prob
D
Point Spread (ATS)
Agreement
AI
Saints (+1.5)
Loss
Proj Spread: -1.0
D
Sim
Saints (+1.5)
Loss
Proj Spread: -2.0
D
Over/Under (Total)
Divergence
AI
o48.5
Loss
Proj Total: 50.0
C
Sim
u48.5
Win
Proj Total: 44.0
A
Head-to-Head History
Date
Game
Score
Nov 15, 2026
CAR @ NO
20 - 17
Dec 14, 2025
CAR @ NO
17 - 20
Nov 9, 2025
NO @ CAR
17 - 7
Nov 3, 2024
NO @ CAR
22 - 23
Sep 8, 2024
CAR @ NO
10 - 47
Key Model Drivers
Rushing Yards (L5)
+10.5% more
New Orleans: 106.0
vs
Carolina: 95.9
First Downs (L5)
+11.2% more
Carolina: 21.7
vs
New Orleans: 19.3
Turnovers (L5)
+10.1% more
Carolina: 1.9
vs
New Orleans: 1.7
Post-Mortem Analysis
Metric
Projected
Actual
Score Game
CAR Score
24.5
20
NO Score
25.5
17
Team Stats Splits (Home / Away)
First Downs
19.3 / 21.7
19.0 / 18.0
Net Passing Yards
219.3 / 233.3
173.0 / 186.0
Rushing Yards
106.0 / 95.9
49.0 / 97.0
Third Down Efficiency
0.4 / 0.4
0.38 / 0.29
Time of Possession
0.5 / 0.5
0.48 / 0.52
Total Yards
325.4 / 329.2
222.0 / 283.0
Turnovers
1.7 / 1.9
2.0 / 0.0
Yards Per Play
5.0 / 5.1
3.6 / 4.4
Public Market Splits
Moneyline
Open: -102 / -118
→
-118 / -102
↓
Spread (ATS)
Open: +1.5 / -1.5
→
-1.5 / +1.5
↓
Total (O/U)
Open: 43.5
→
48.5
↑
Situational Trends
📊 Win-Loss
CAR
Advantage
4-5-0
(44.4%)
Margin: -1.9
ATS +/-: -1.7
NO
3-6-0
(33.3%)
Margin: -3.8
ATS +/-: -2.5
🎯 ATS (Spread)
CAR
Advantage
4-5-0
(44.4%)
Margin: -1.9
ATS +/-: -1.7
NO
3-6-0
(33.3%)
Margin: -3.8
ATS +/-: -2.5
⚖️ Over/Under
CAR
4-5-0
O: 44.4% / U: 55.6%
Total +/-: +5.1
NO
5-4-0
O: 55.6% / U: 44.4%
Total +/-: +3.2
Season to Date Model Accuracy
AI Model
SIM Engine
NO
CAR
NO
CAR
ML
44%
4-5
33%
3-6
33%
3-6
56%
5-4
ATS
33%
3-6
44%
4-5
33%
3-6
56%
5-4
TTL
11%
1-8
62%
5-3-1
33%
3-6
50%
4-4-1
Contextual Game News
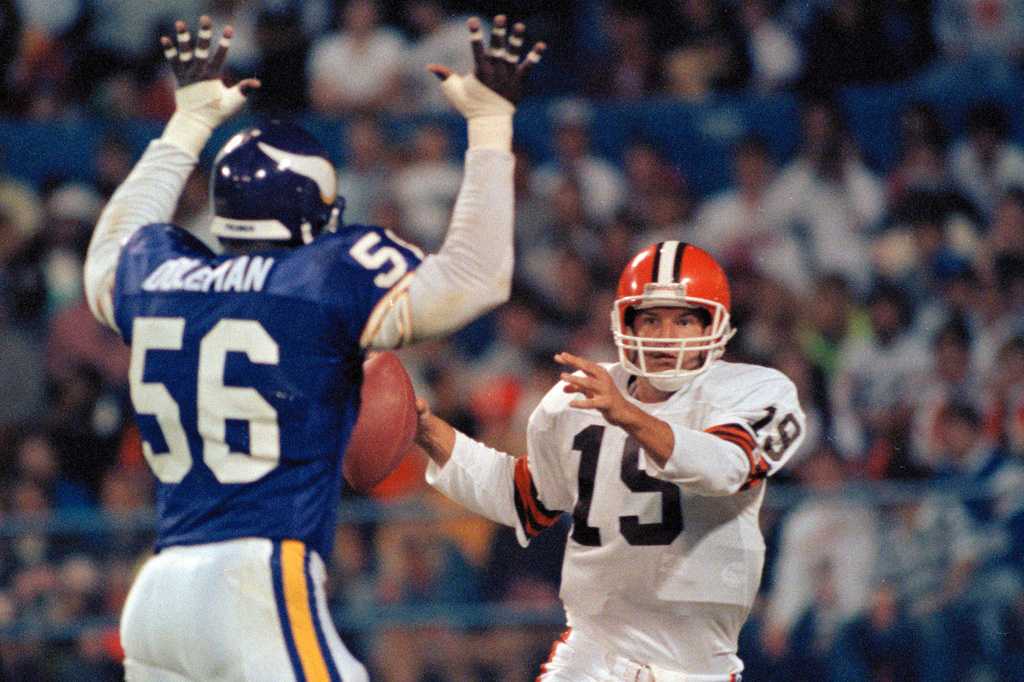
Bernie Kosar Celebrates One Year After Liver Transplant, Credits…

Stephen A. Smith Blasts Cam Skattebo's Backflip as 'Stupid' Desp…

Colts Coach Shane Steichen Noncommittal on Daniel Jones as Start…

Colts Coach Shane Steichen Noncommittal on Daniel Jones as Start…
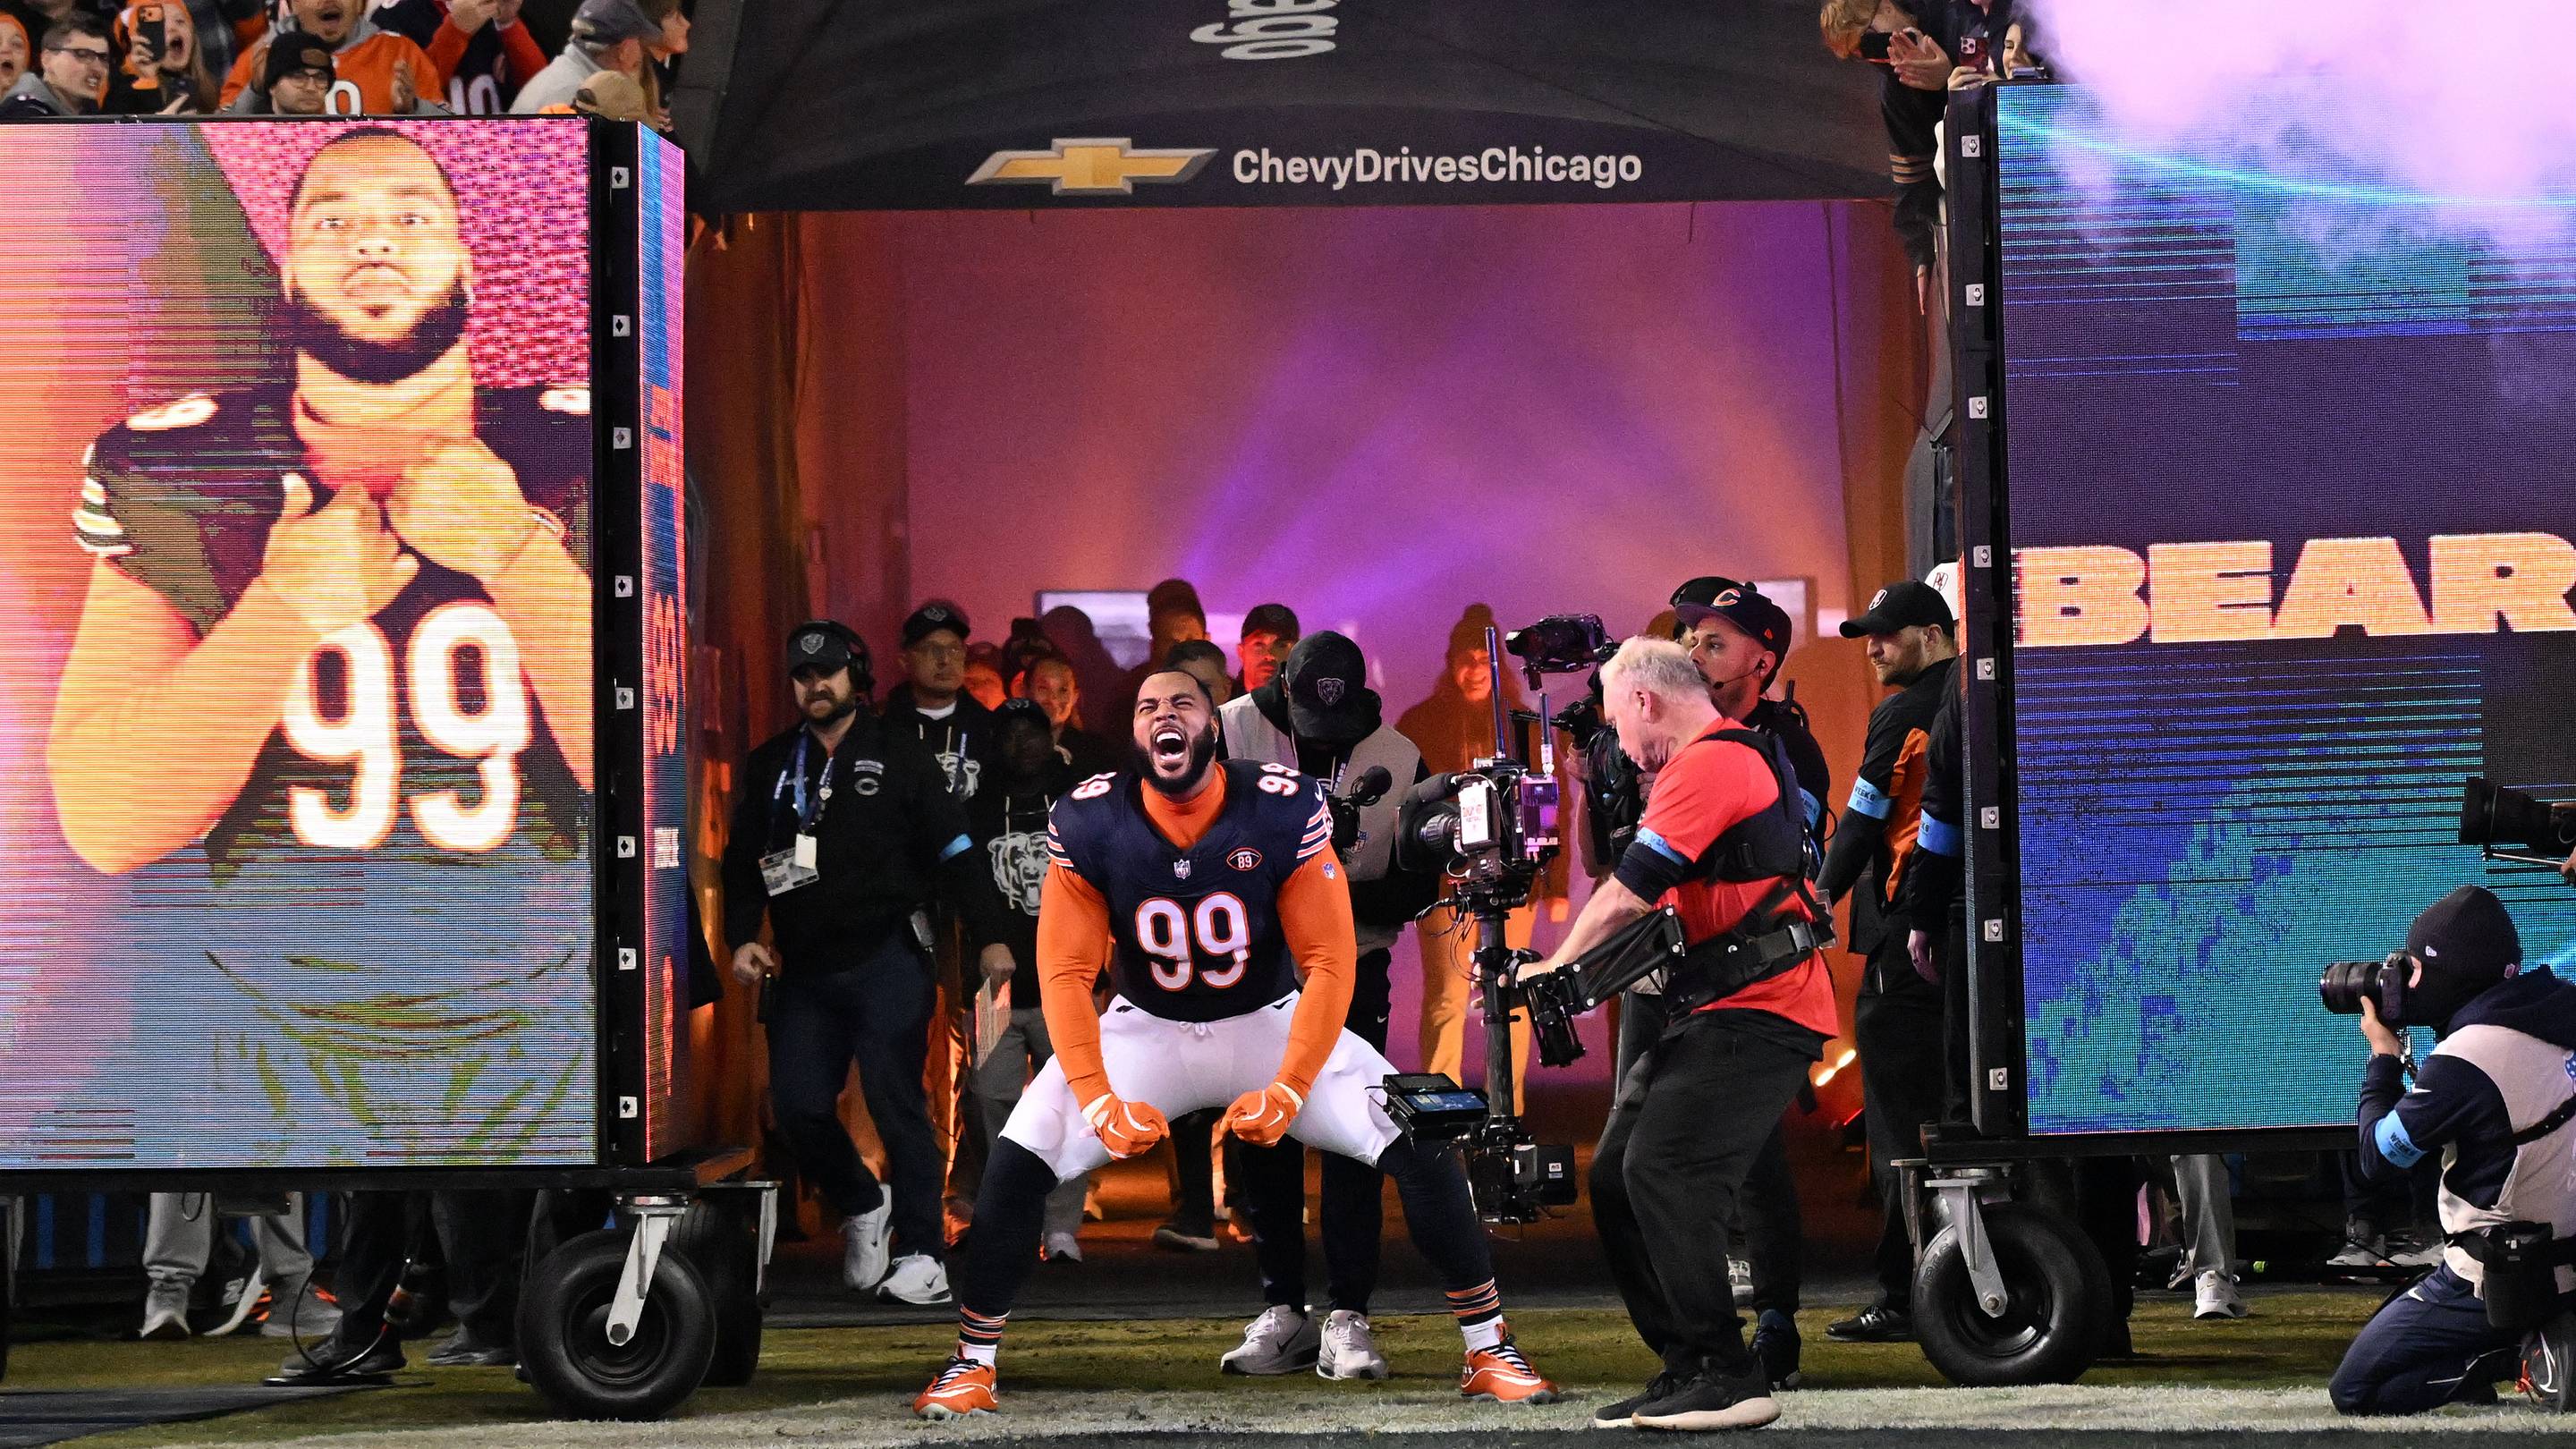
Jeffery Simmons Ready to Roll: Bears DT Expects to Play, Armed w…