



NEW ENGLAND
PATRIOTSNE
5-5 | Road
10


DETROIT
LIONSDET
7-2 | Home
35
Key Game

KEY GAME
Mitch Wishnowsky
#19 | Punter@
KEY GAME
Jack Fox
#3 | Punter| Player | |
|---|---|
| Mitch Wishnowsky | None-None |
| Jack Fox | None-None |
None-None
W-L
None-None
AI Model Win Probability
PATRIOTS
47%
LIONS
53%
▲ Edge: +4% (NE)
PATRIOTS
44%
Book Odds: +130
LIONS
59%
Book Odds: -144
AI Model Projected Total
AI Projection
48.6
Projected
Book Total
51.0
Over / Under Line
▼
Edge: +2.4 (Under)
Over 51.0
44%
Under 51.0
56%
AI Model Spread Expectation
AI Spread Proj
+1.0
NEW ENGLAND
Book Spread
+2.5
Book Line
▲ Edge: +1.5 points (New England)
Spread Distribution
AI Model
+42+28+140-14-28-42
Distribution centered around NE +1.0 expected margin.
Margin of Victory (NE)
NE By 1-6 points
16.1%
NE By 7-13 points
14.6%
DET By 1-6 points
16.7%
DET By 7-13 points
16.1%
AI Model Projected Score
New England
23.8
NEW ENGLAND
Book Implied: 24.20
Detroit
24.8
DETROIT
Book Implied: 26.80
Simulated Score
New England
20
NEW ENGLAND
Book Implied: 24.20
Detroit
28
DETROIT
Book Implied: 26.80
Projections Grades
Moneyline (ML)
Agreement
AI
Lions
Win
53% Win Prob
D
Sim
Lions
Win
79% Win Prob
A
Point Spread (ATS)
Divergence
AI
Patriots (+2.5)
Loss
Proj Spread: +1.0
C
Sim
Lions (-2.5)
Win
Proj Spread: -8.0
A
Over/Under (Total)
Agreement
AI
u51.0
Win
Proj Total: 48.6
C
Sim
u51.0
Win
Proj Total: 48.0
B
Head-to-Head History
Date
Game
Score
Nov 15, 2026
NE @ DET
10 - 35
Oct 9, 2022
DET @ NE
0 - 29
Sep 23, 2018
NE @ DET
10 - 26
Nov 23, 2014
DET @ NE
9 - 34
Nov 25, 2010
NE @ DET
45 - 24
Key Model Drivers
Rushing Yards (L5)
+21.5% more
Detroit: 136.3
vs
New England: 112.3
Turnovers (L5)
+58.6% more
New England: 2.3
vs
Detroit: 0.9
Net Passing Yards (L5)
+15.9% more
New England: 261.0
vs
Detroit: 219.6
Yards Per Play (L5)
+10.3% more
New England: 6.2
vs
Detroit: 5.6
Post-Mortem Analysis
Metric
Projected
Actual
Score Game
NE Score
23.8
10
DET Score
24.8
35
Team Stats Splits (Home / Away)
First Downs
21.6 / 20.6
22.0 / 12.0
Net Passing Yards
219.6 / 261.0
303.0 / 90.0
Rushing Yards
136.3 / 112.3
191.0 / 61.0
Third Down Efficiency
0.4 / 0.4
0.53 / 0.31
Time of Possession
0.5 / 0.5
0.55 / 0.45
Total Yards
355.9 / 373.2
494.0 / 151.0
Turnovers
0.9 / 2.3
2.0 / 1.0
Yards Per Play
5.6 / 6.2
7.3 / 2.7
Public Market Splits
Moneyline
Open: +105 / -125
→
+130 / -144
↑
Spread (ATS)
Open: +1.5 / -1.5
→
+2.5 / -2.5
↑
Total (O/U)
Open: 48.5
→
51
↑
Situational Trends
📊 Win-Loss
NE
5-5-0
(50.0%)
Margin: -2.1
ATS +/-: -2.8
DET
Advantage
7-2-0
(77.8%)
Margin: 6.4
ATS +/-: +2.7
🎯 ATS (Spread)
NE
3-6-1
(33.3%)
Margin: -2.1
ATS +/-: -2.8
DET
Advantage
4-4-1
(50.0%)
Margin: 6.4
ATS +/-: +2.7
⚖️ Over/Under
NE
6-4-0
O: 60.0% / U: 40.0%
Total +/-: +0.3
DET
5-4-0
O: 55.6% / U: 44.4%
Total +/-: -0.8
Season to Date Model Accuracy
AI Model
SIM Engine
DET
NE
DET
NE
ML
89%
8-1
80%
8-2
67%
6-3
80%
8-2
ATS
50%
4-4-1
22%
2-7-1
75%
6-2-1
44%
4-5-1
TTL
44%
4-5
20%
2-8
44%
4-5
50%
5-5
Contextual Game News

Michael Irvin Blasts ESPN's Handling of Troy Aikman: 'A Bad Deci…

Broncos Lock Down Riley Moss with Four-Year, $67 Million Extensi…

John Lynch Hints at Mike Evans' Possible Return for 49ers' Mexic…

Broncos Lock Up Riley Moss with $67 Million Extension: Inside th…
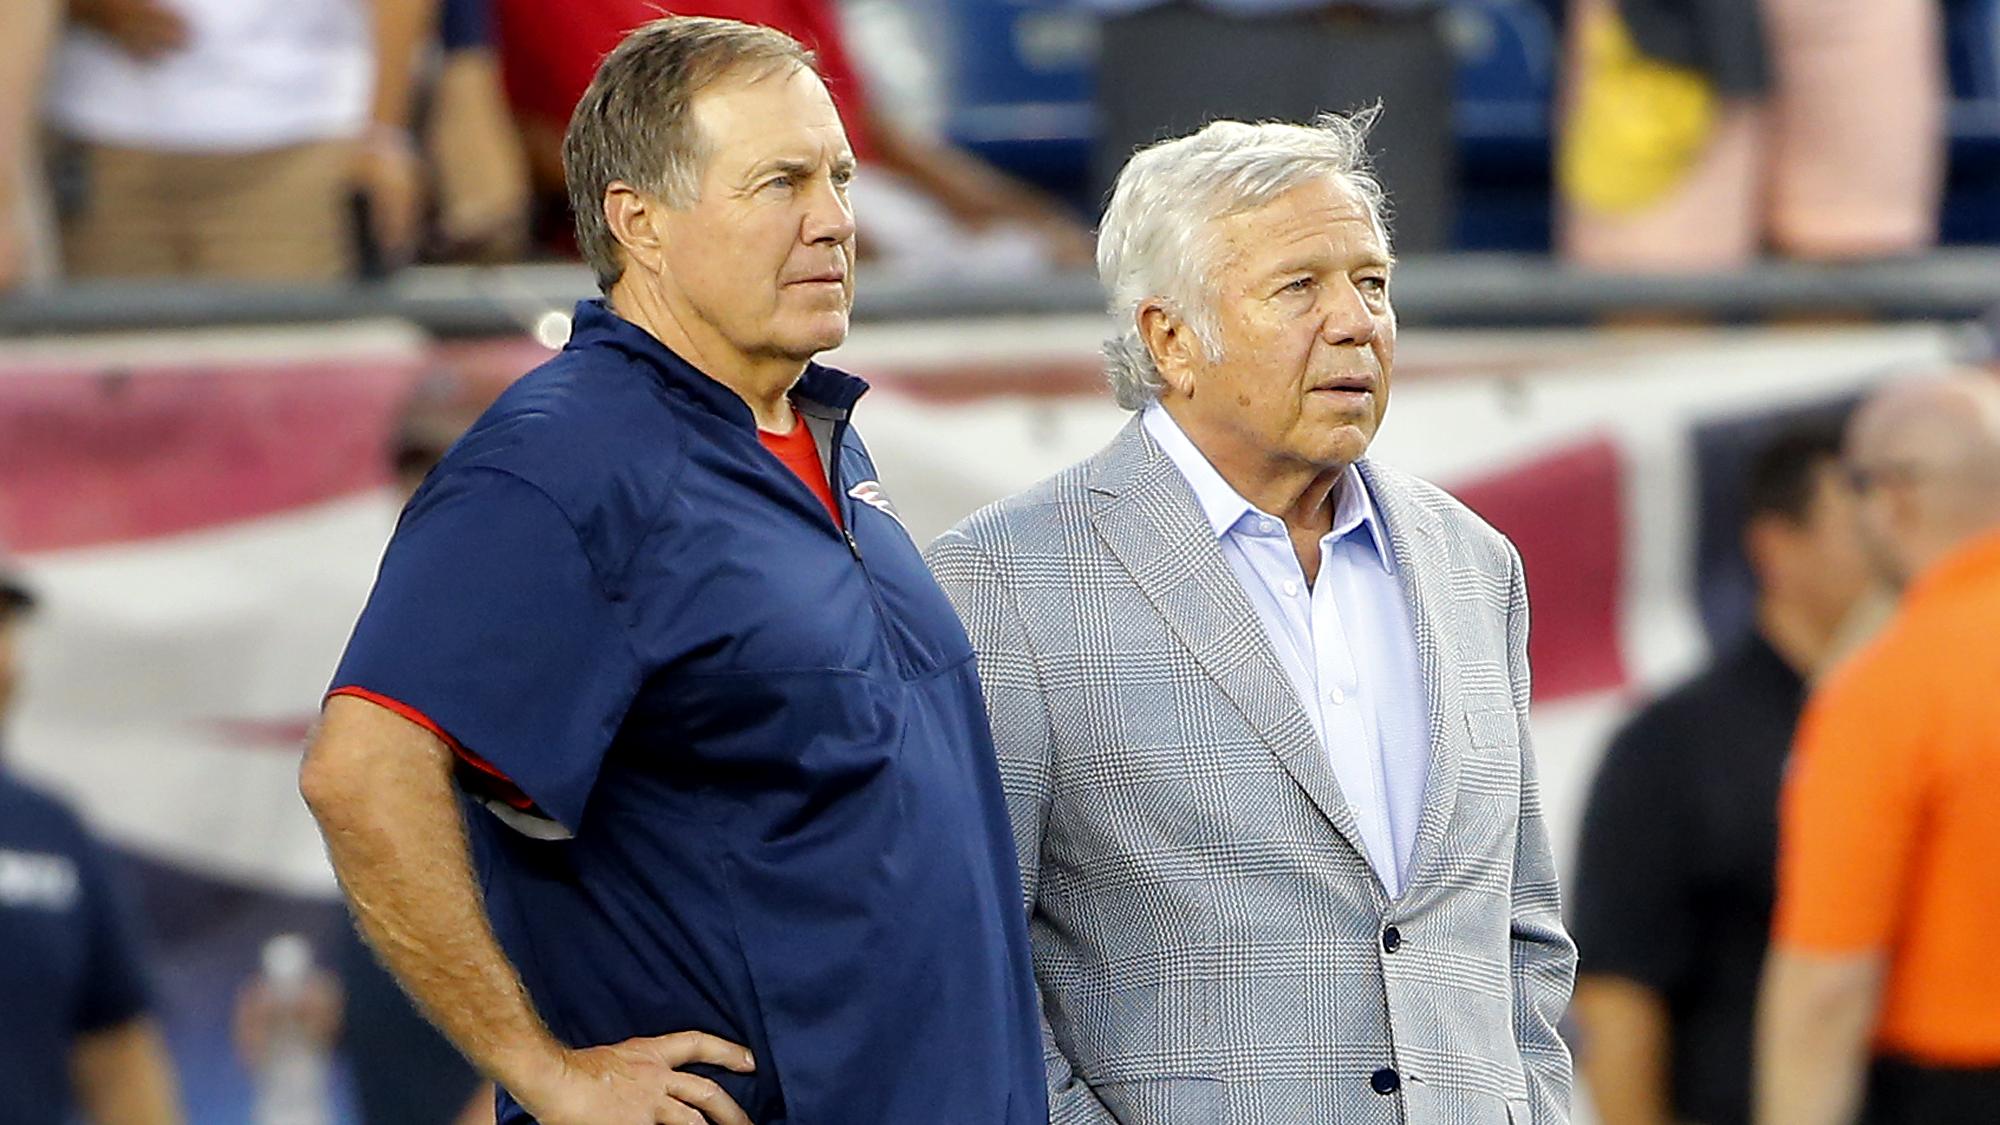
Belichick and Kraft Move One Step Closer to Pro Football Hall of…