



DETROIT
RED WINGSDET
4-3-3 | Road
5


VANCOUVER
CANUCKSVAN
2-9-1 | Home
2
Goaltending

GOALTENDER
John Gibson
#36 | Goaltender@

GOALTENDER
Kevin Lankinen
#32 | Goaltender| Player | W-L-OTL | GAA | SV% | SO |
|---|---|---|---|---|
| John Gibson | None-None | 1.50 | 0.800 | -- |
| Kevin Lankinen | None-None | 5.00 | 0.839 | -- |
None-None
W-L-OTL
None-None
1.50 Ldr
GAA
5.00
0.800
Save %
Ldr 0.839
--
SO
--
AI Model Win Probability
RED WINGS
68%
CANUCKS
32%
▲ Edge: +5.20% (DET)
RED WINGS
63%
Book Odds: -169
CANUCKS
40%
Book Odds: +152
AI Model Projected Total
AI Projection
6.5
Projected
Book Total
6.5
Over / Under Line
Over 6.5
49%
Under 6.5
51%
AI Model Spread Expectation
AI Spread Proj
+1.5
VANCOUVER
Book Spread
+1.5
Book Line
Spread Distribution
AI Model
-6-4-20+2+4+6
Distribution centered around VAN +1.5 expected margin.
Margin of Victory (VAN)
DET By 1 goal
19.1%
DET By 2-3 goals
34.1%
VAN By 1 goal
9.2%
VAN By 2-3 goals
6.1%
AI Model Projected Score
Detroit
4
DETROIT
Book Implied: 4
Vancouver
2.5
VANCOUVER
Book Implied: 2.50
Simulated Score
Detroit
4
DETROIT
Book Implied: 4
Vancouver
2
VANCOUVER
Book Implied: 2.50
Projections Grades
Moneyline (ML)
Agreement
👑 Top Selection
AI
Red Wings
Win
68% Win Prob
A
Sim
Red Wings
Win
84% Win Prob
A
Puck Line (ATS)
Divergence
AI
Canucks (-1.5)
Win
Proj Goals: +1.5
D
Sim
Red Wings (-1.5)
Win
Proj Goals: -2.0
B
Over/Under (Total)
Divergence
AI
u6.5
Loss
Proj Total: 6.5
D
Sim
u6.5
Loss
Proj Total: 6.0
B
Head-to-Head History
Date
Game
Score
Oct 22, 2026
DET @ VAN
5 - 2
Jan 8, 2026
VAN @ DET
1 - 5
Dec 8, 2025
DET @ VAN
4 - 0
Feb 2, 2025
DET @ VAN
3 - 2
Dec 1, 2024
VAN @ DET
5 - 4
Key Model Drivers
Takeaways (L5)
+37.3% more
Detroit: 6.0
vs
Vancouver: 3.8
Shots on Goal (L5)
+33.5% more
Detroit: 27.2
vs
Vancouver: 18.1
Blocked Shots (L5)
+17.8% more
Detroit: 18.6
vs
Vancouver: 15.3
Power Play % (L5)
+8.3%
Vancouver: 33.5%
vs
Detroit: 25.3%
Post-Mortem Analysis
Metric
Projected
Actual
Score Game
DET Score
4.0
5
VAN Score
2.5
2
Team Stats Splits (Home / Away)
Blocked Shots
15.3 / 18.6
14.0 / 11.0
Faceoff %
46.3 / 46.7
50.0 / 50.0
Hits
23.2 / 24.1
25.0 / 21.0
Power Play %
33.5 / 25.3
25.0 / 25.0
Shots on Goal
18.1 / 27.2
13.0 / 31.0
Takeaways
3.8 / 6.0
5.0 / 3.0
Public Market Splits
Moneyline
Open: -170 / +142
→
-169 / +152
↓
Spread (ATS)
Open: -1.5 / +1.5
→
-1.5 / +1.5
Total (O/U)
Open: 6.5
→
6.5
Season to Date Model Accuracy
AI Model
SIM Engine
VAN
DET
VAN
DET
ML
85%
17-3
68%
13-6
70%
14-6
53%
10-9
ATS
55%
11-9
37%
7-12
45%
9-11
63%
12-7
TTL
50%
10-10
28%
5-13-1
55%
11-9
50%
9-9-1
Contextual Game News

Sedins' Rebuild Talk vs. Canucks' Actions: The Real Test in Vanc…

Carter Bear's AHL Hot Streak Raises Questions About Red Wings' O…
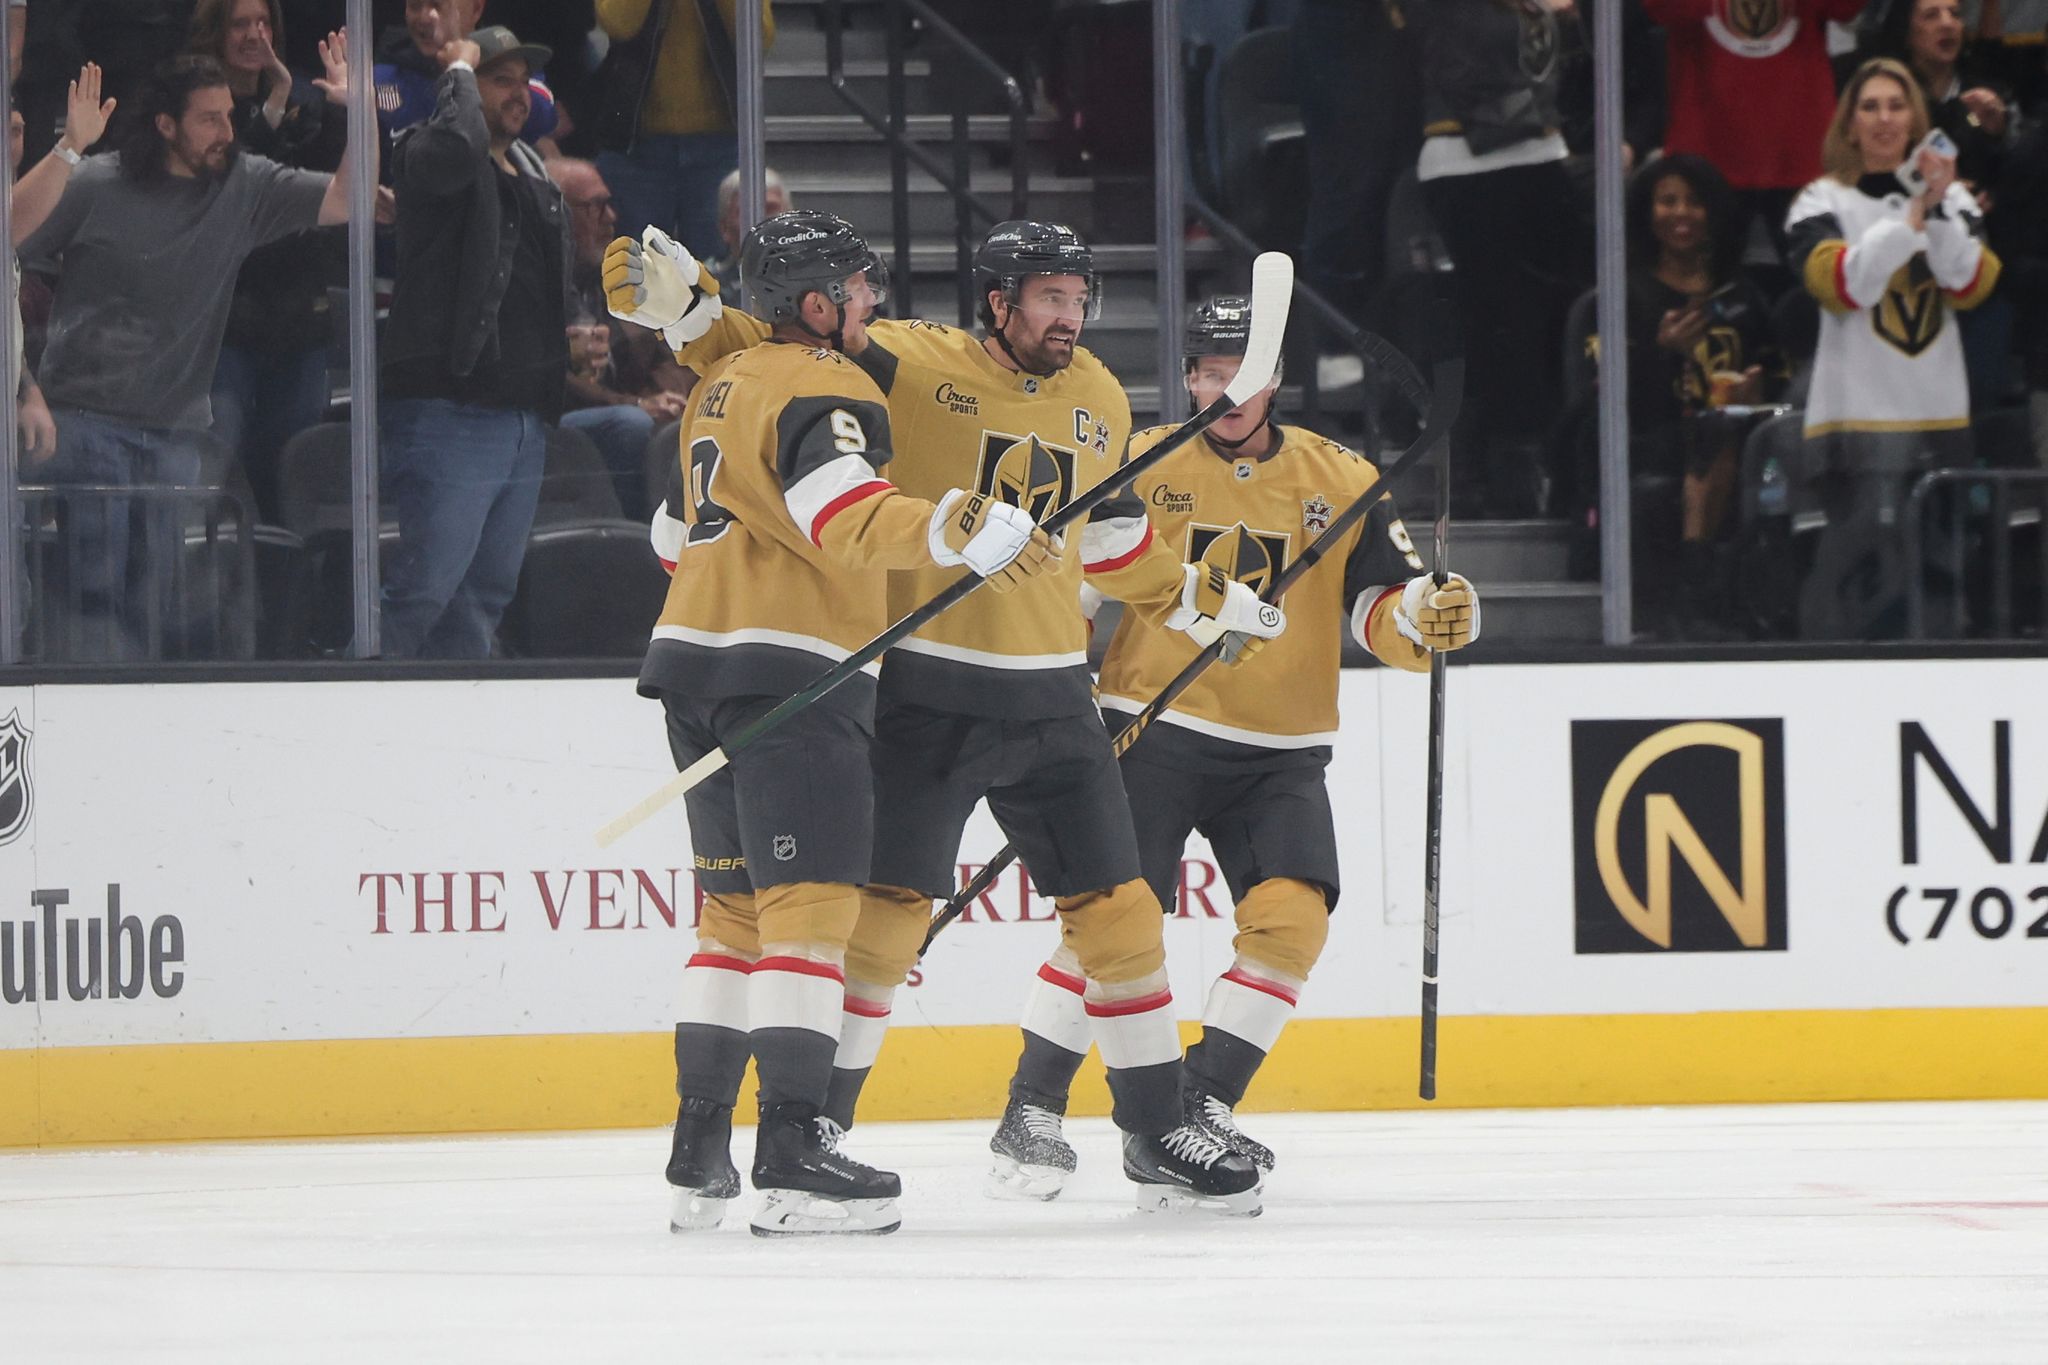
Mark Stone Nears Vegas Scoring Record as Golden Knights Down Uta…
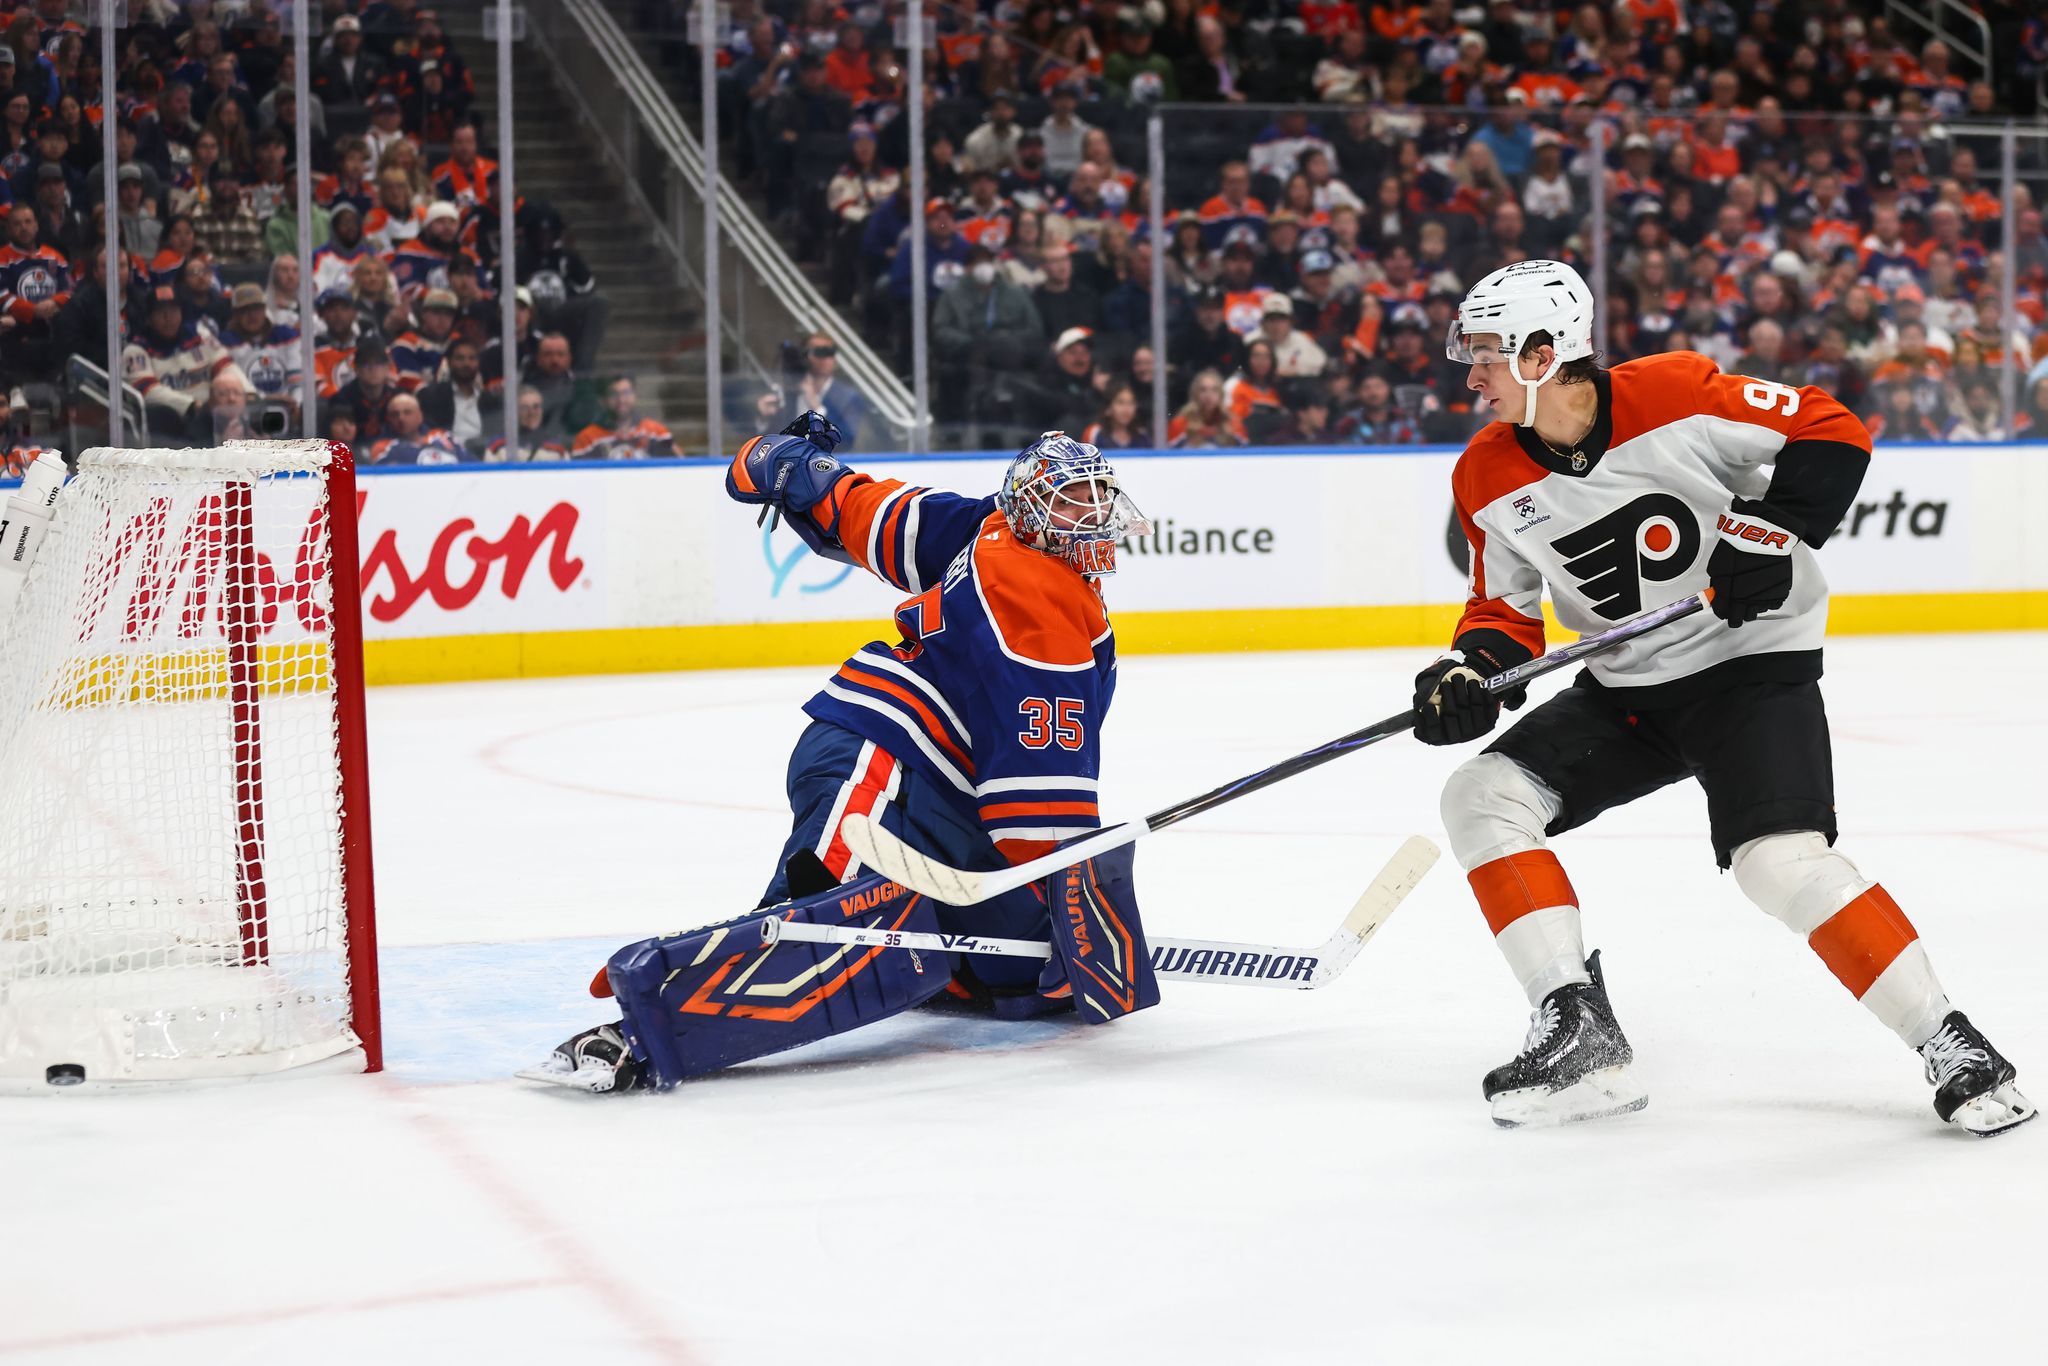
Bouchard's Overtime Heroics Lift Oilers to Third Straight Win
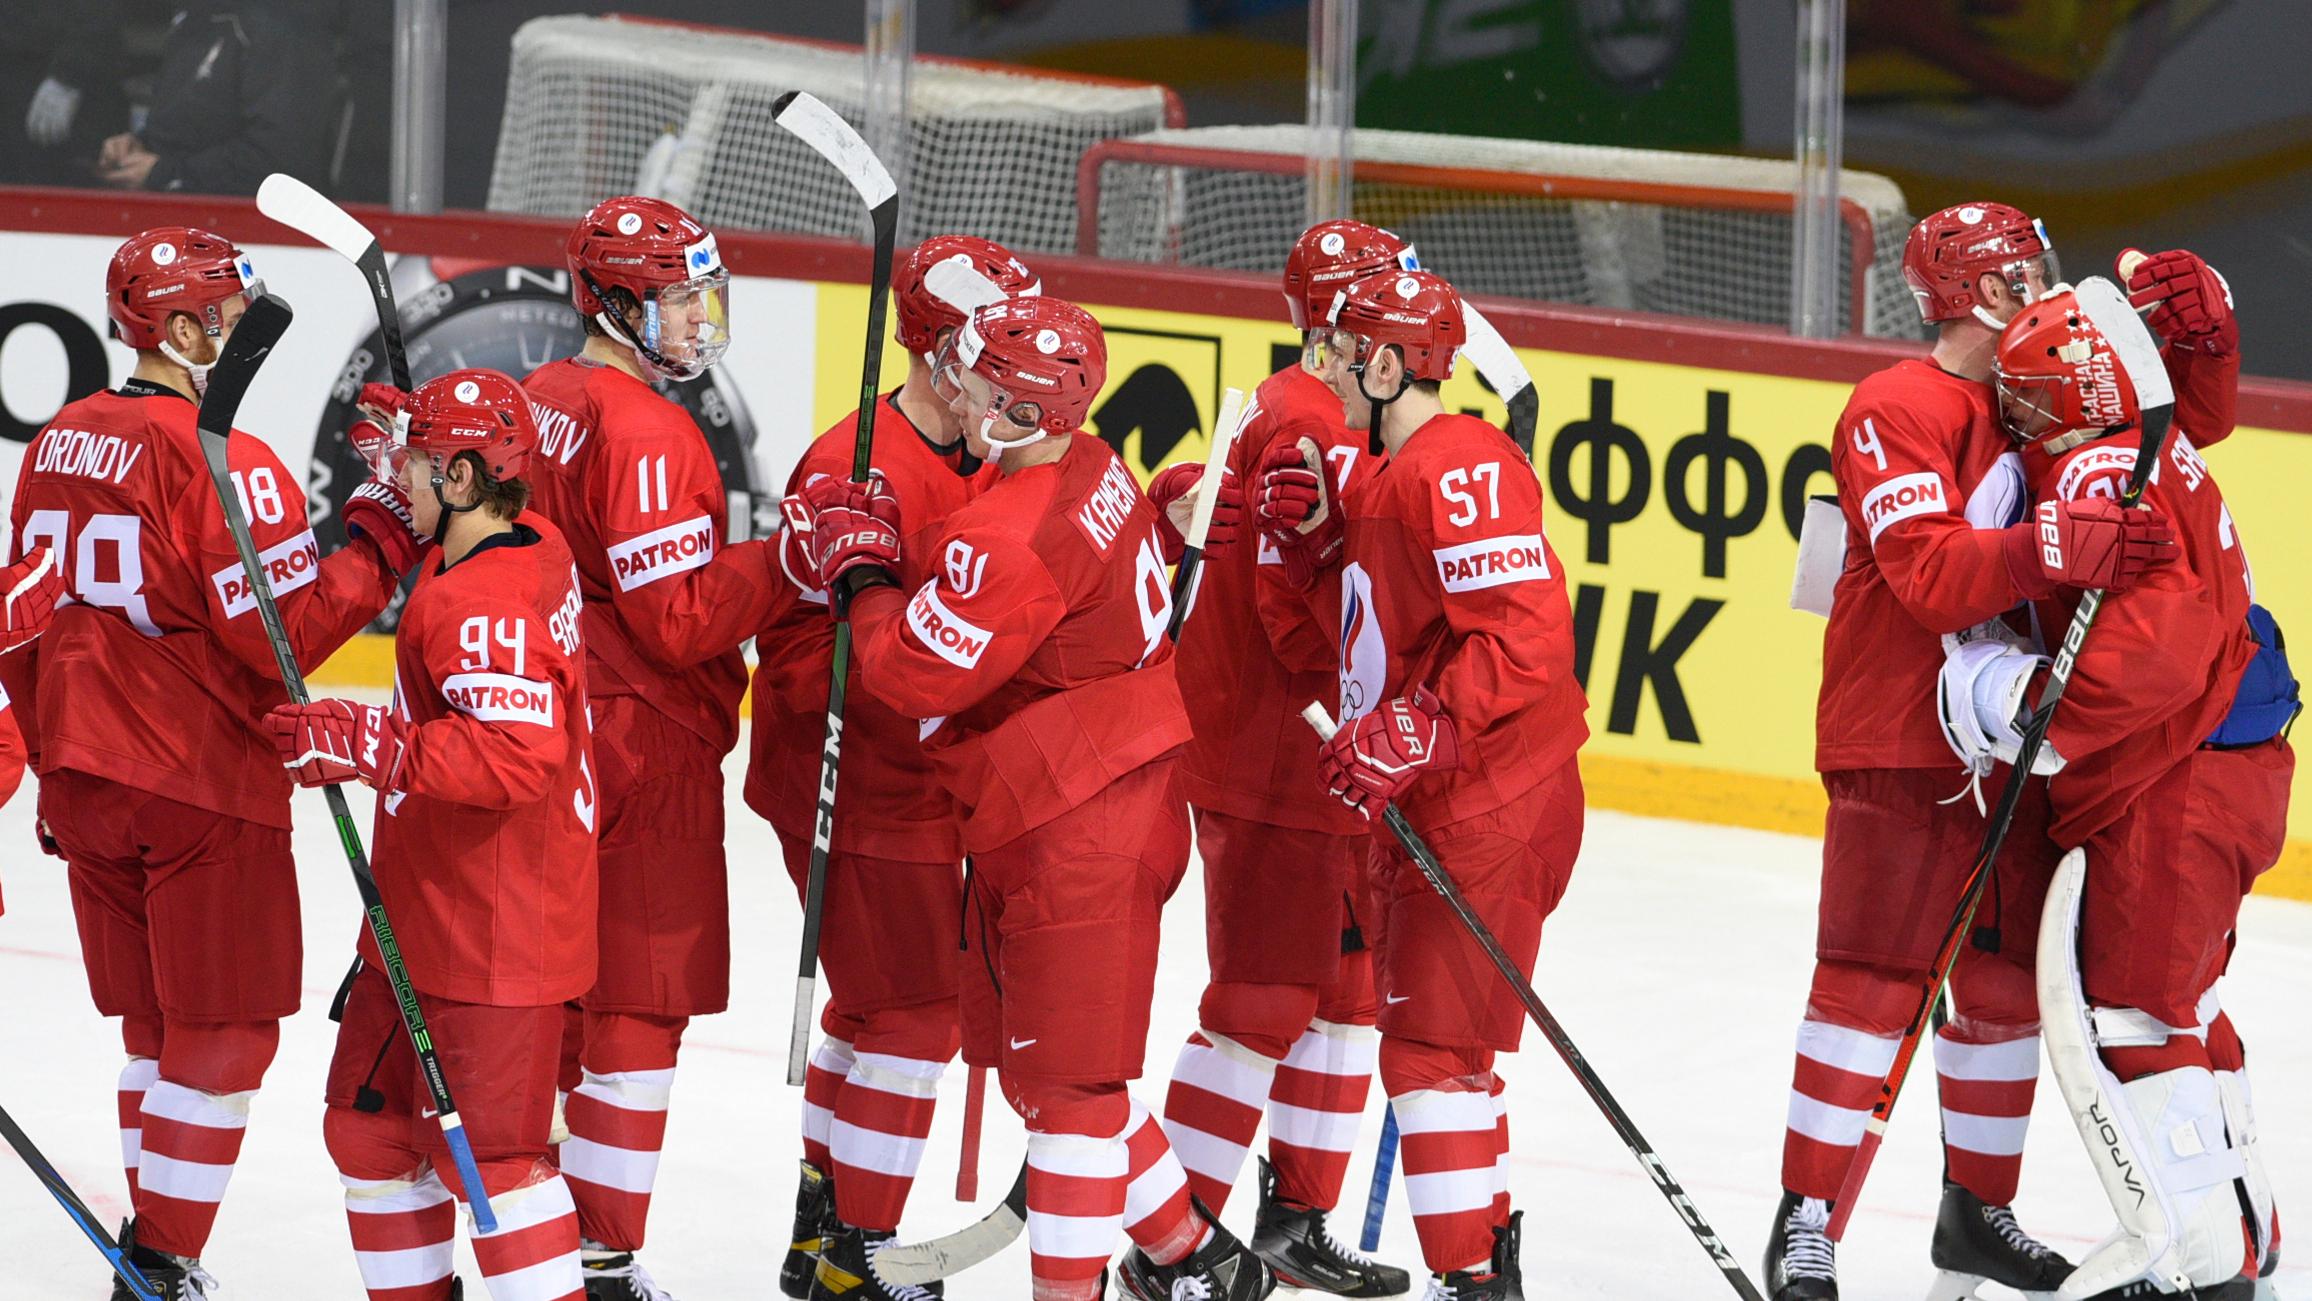
Canada Refuses Entry to Russian Players for World Junior Champio…