



PHILADELPHIA
EAGLESPHI
2-6 | Road
10


WASHINGTON
COMMANDERSWSH
2-4-1 | Home
27
Key Game

KEY GAME
Braden Mann
#10 | Punter@

KEY GAME
Tress Way
#10 | Punter| Player | |
|---|---|
| Braden Mann | None-None |
| Tress Way | None-None |
None-None
W-L
None-None
AI Model Win Probability
EAGLES
54%
COMMANDERS
46%
▲ Edge: +21.30% (PHI)
EAGLES
32%
Book Odds: +210
COMMANDERS
71%
Book Odds: -239
AI Model Projected Total
AI Projection
45.5
Projected
Book Total
40.5
Over / Under Line
▲
Edge: +5.0 (Over)
Over 40.5
65%
Under 40.5
35%
AI Model Spread Expectation
AI Spread Proj
-1.5
PHILADELPHIA
Book Spread
+5.5
Book Line
▲ Edge: +7.0 points (Philadelphia)
Spread Distribution
AI Model
-42-28-140+14+28+42
Distribution centered around PHI -1.5 expected margin.
Margin of Victory (PHI)
PHI By 1-6 points
16.8%
PHI By 7-13 points
16.5%
WSH By 1-6 points
15.9%
WSH By 7-13 points
14.2%
AI Model Projected Score
Philadelphia
23.5
PHILADELPHIA
Book Implied: 17.50
Washington
22
WASHINGTON
Book Implied: 23
Simulated Score
Philadelphia
25
PHILADELPHIA
Book Implied: 17.50
Washington
22
WASHINGTON
Book Implied: 23
Projections Grades
Moneyline (ML)
Agreement
AI
Eagles
Loss
54% Win Prob
D
Sim
Eagles
Loss
62% Win Prob
C
Point Spread (ATS)
Agreement
👑 Top Selection
AI
Eagles (+5.5)
Loss
Proj Spread: -1.5
A
Sim
Eagles (+5.5)
Loss
Proj Spread: -3.0
A
Over/Under (Total)
Agreement
👑 Top Selection
AI
o40.5
Loss
Proj Total: 45.5
B
Sim
o40.5
Loss
Proj Total: 47.0
A
Head-to-Head History
Date
Game
Score
Nov 1, 2026
PHI @ WSH
10 - 27
Sep 13, 2026
WSH @ PHI
22 - 24
Jan 4, 2026
WSH @ PHI
24 - 17
Dec 20, 2025
PHI @ WSH
29 - 18
Jan 26, 2025
WSH @ PHI
23 - 55
Key Model Drivers
Turnovers (L5)
+35.0% more
Philadelphia: 0.7
vs
Washington: 0.3
Third Down Efficiency (L5)
+10.0% more
Philadelphia: 0.4
vs
Washington: 0.3
Rushing Yards (L5)
+33.5% more
Washington: 112.4
vs
Philadelphia: 84.2
Total Yards (L5)
+20.6% more
Washington: 321.6
vs
Philadelphia: 266.6
Post-Mortem Analysis
Metric
Projected
Actual
Score Game
PHI Score
23.5
10
WSH Score
22.0
27
Team Stats Splits (Home / Away)
First Downs
17.9 / 17.9
16.0 / 17.0
Net Passing Yards
209.2 / 182.4
204.0 / 177.0
Rushing Yards
112.4 / 84.2
135.0 / 91.0
Third Down Efficiency
0.3 / 0.4
0.38 / 0.33
Time of Possession
0.5 / 0.5
0.44 / 0.56
Total Yards
321.6 / 266.6
339.0 / 268.0
Turnovers
0.3 / 0.7
1.0 / 2.0
Yards Per Play
5.2 / 4.4
5.9 / 3.9
Public Market Splits
Moneyline
Open: -125 / +105
→
+210 / -239
↑
Spread (ATS)
Open: -1.5 / +1.5
→
+5.5 / -5.5
↑
Total (O/U)
Open: 46.5
→
40.5
↓
Situational Trends
📊 Win-Loss
PHI
2-6-0
(25.0%)
Margin: -8.1
ATS +/-: -7.2
WSH
Advantage
2-4-1
(33.3%)
Margin: -3.3
ATS +/-: -0.1
🎯 ATS (Spread)
PHI
1-7-0
(12.5%)
Margin: -8.1
ATS +/-: -7.2
WSH
Advantage
4-3-0
(57.1%)
Margin: -3.3
ATS +/-: -0.1
⚖️ Over/Under
PHI
4-4-0
O: 50.0% / U: 50.0%
Total +/-: +0.6
WSH
4-3-0
O: 57.1% / U: 42.9%
Total +/-: +3.6
Season to Date Model Accuracy
AI Model
SIM Engine
WSH
PHI
WSH
PHI
ML
57%
4-3
50%
4-4
33%
2-4-1
50%
4-4
ATS
29%
2-5
25%
2-6
71%
5-2
62%
5-3
TTL
57%
4-3
43%
3-4-1
71%
5-2
57%
4-3-1
Contextual Game News

Eagles Urged to Consider Anthony Richardson as QB Solution Amid …
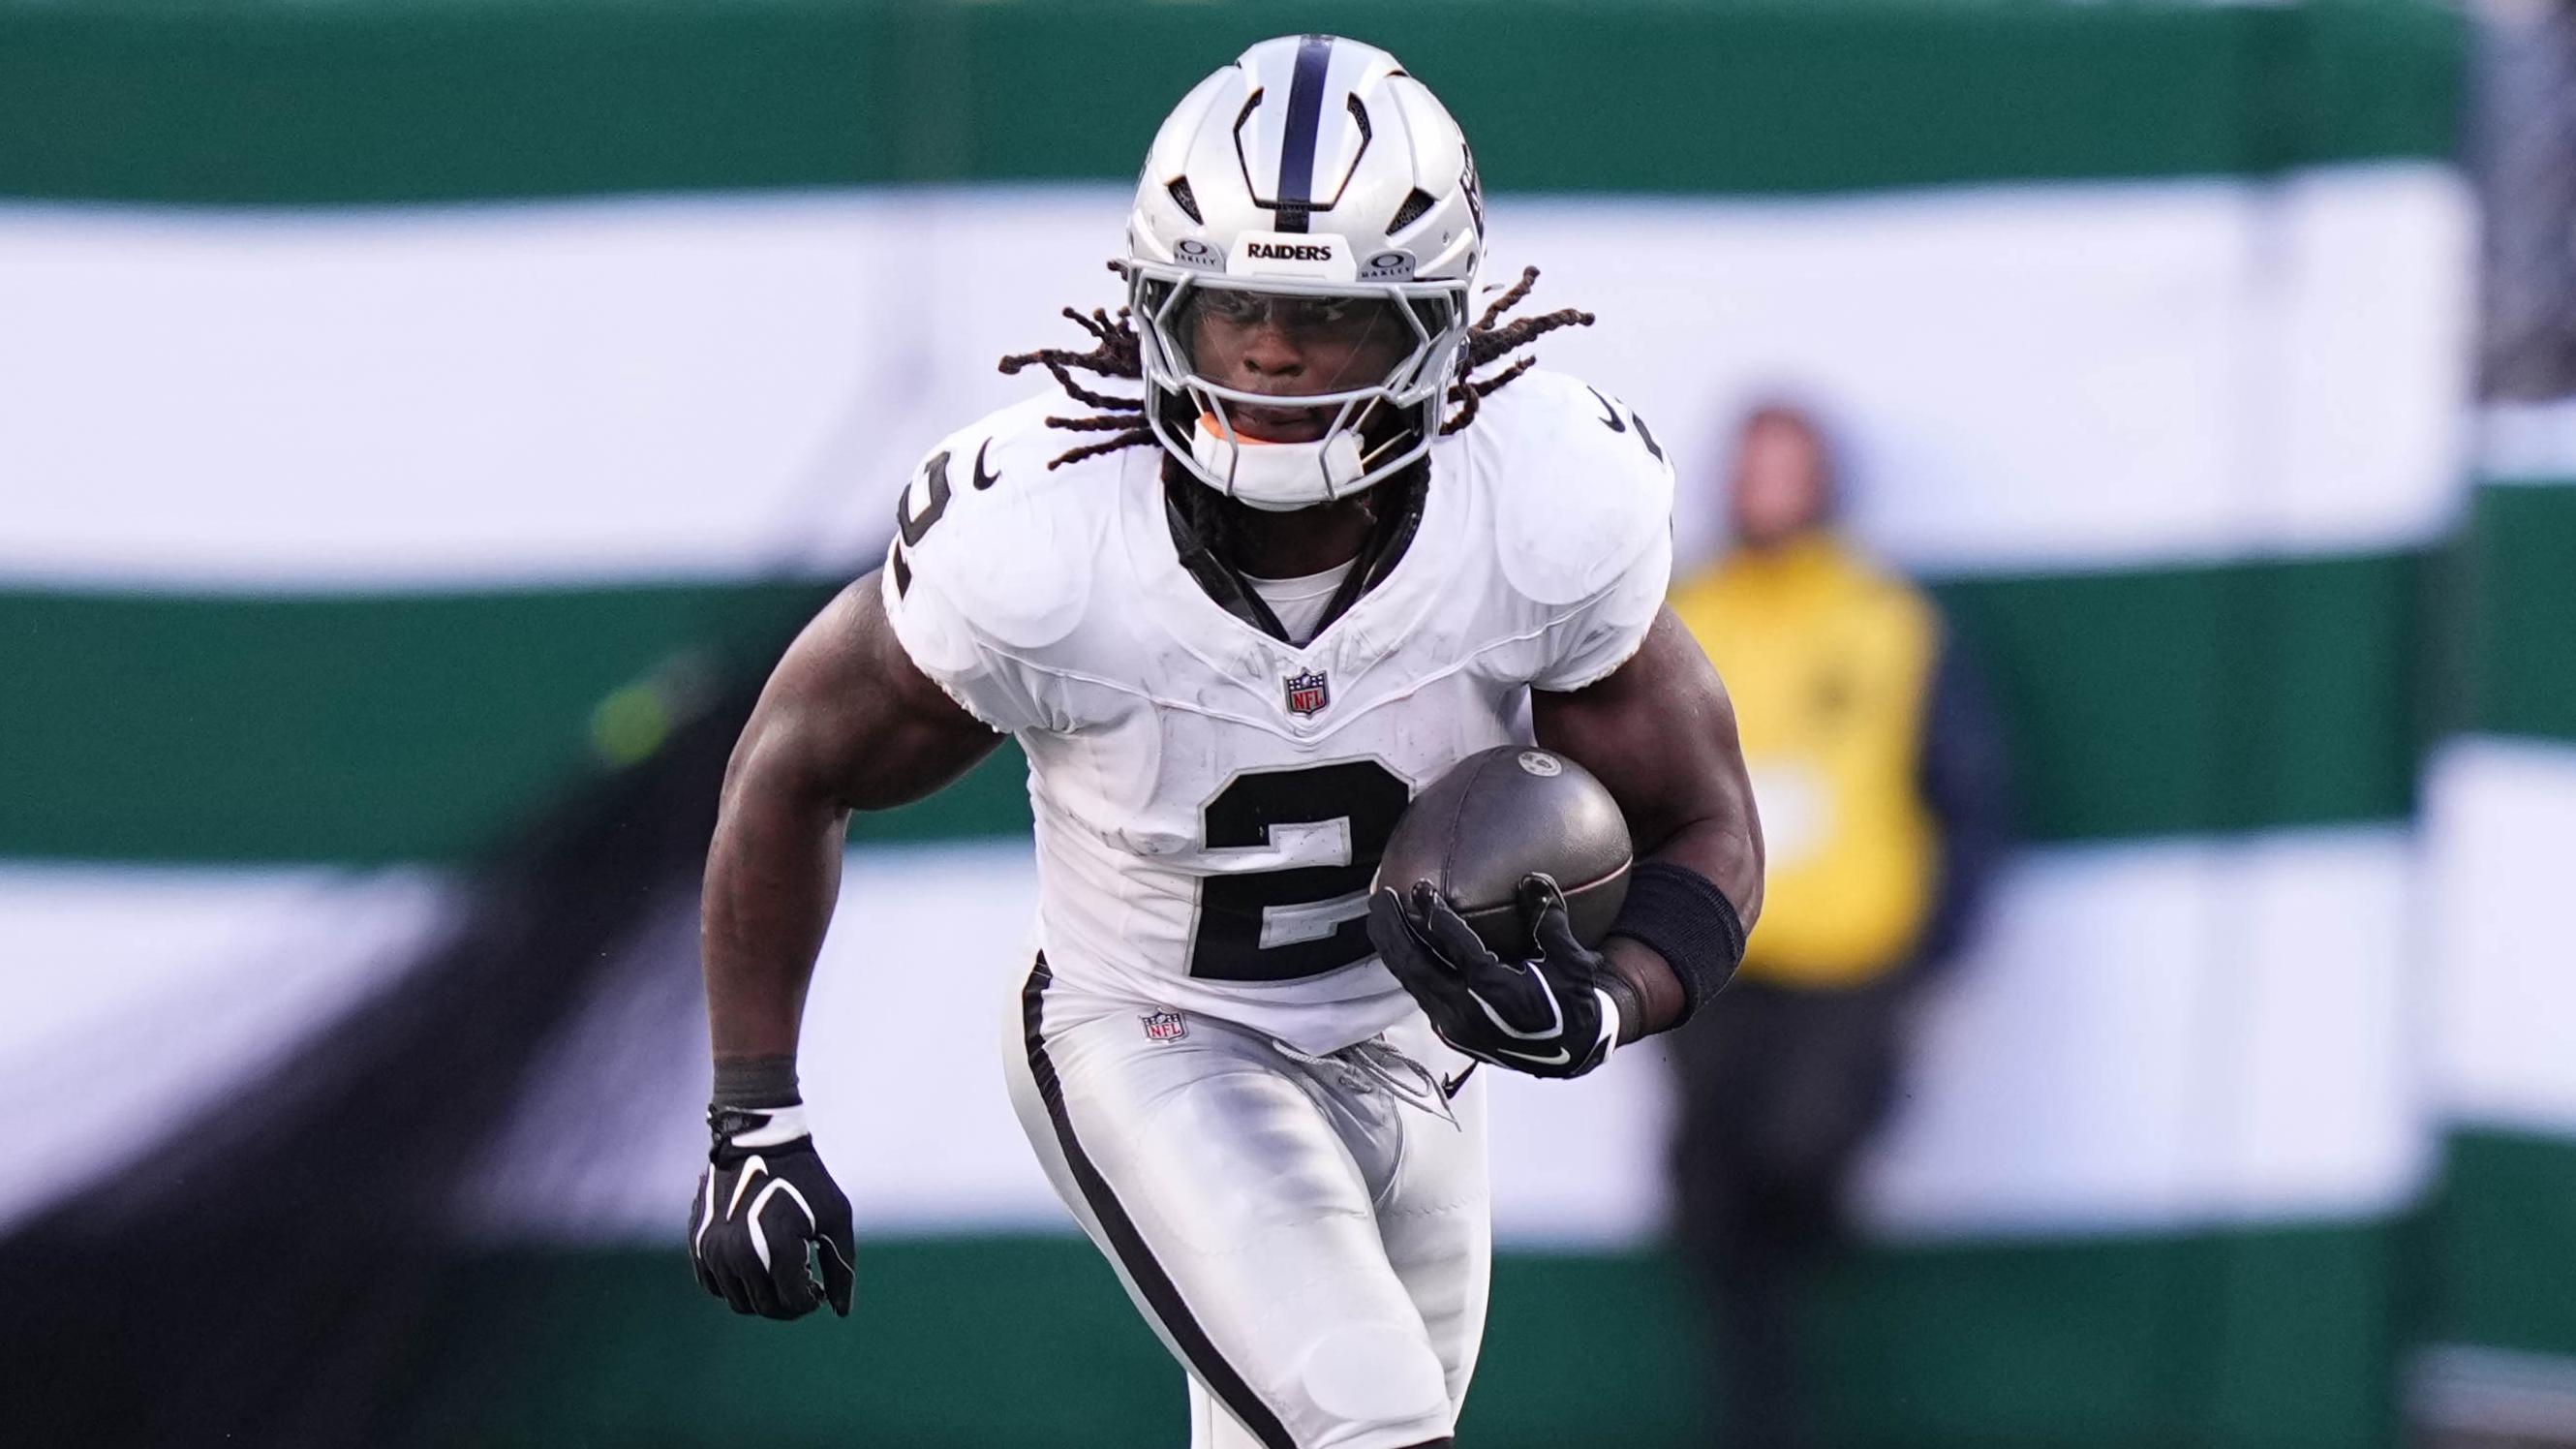
Raiders' Backfield Shakeup: Jeanty's Role in Flux as Washington …
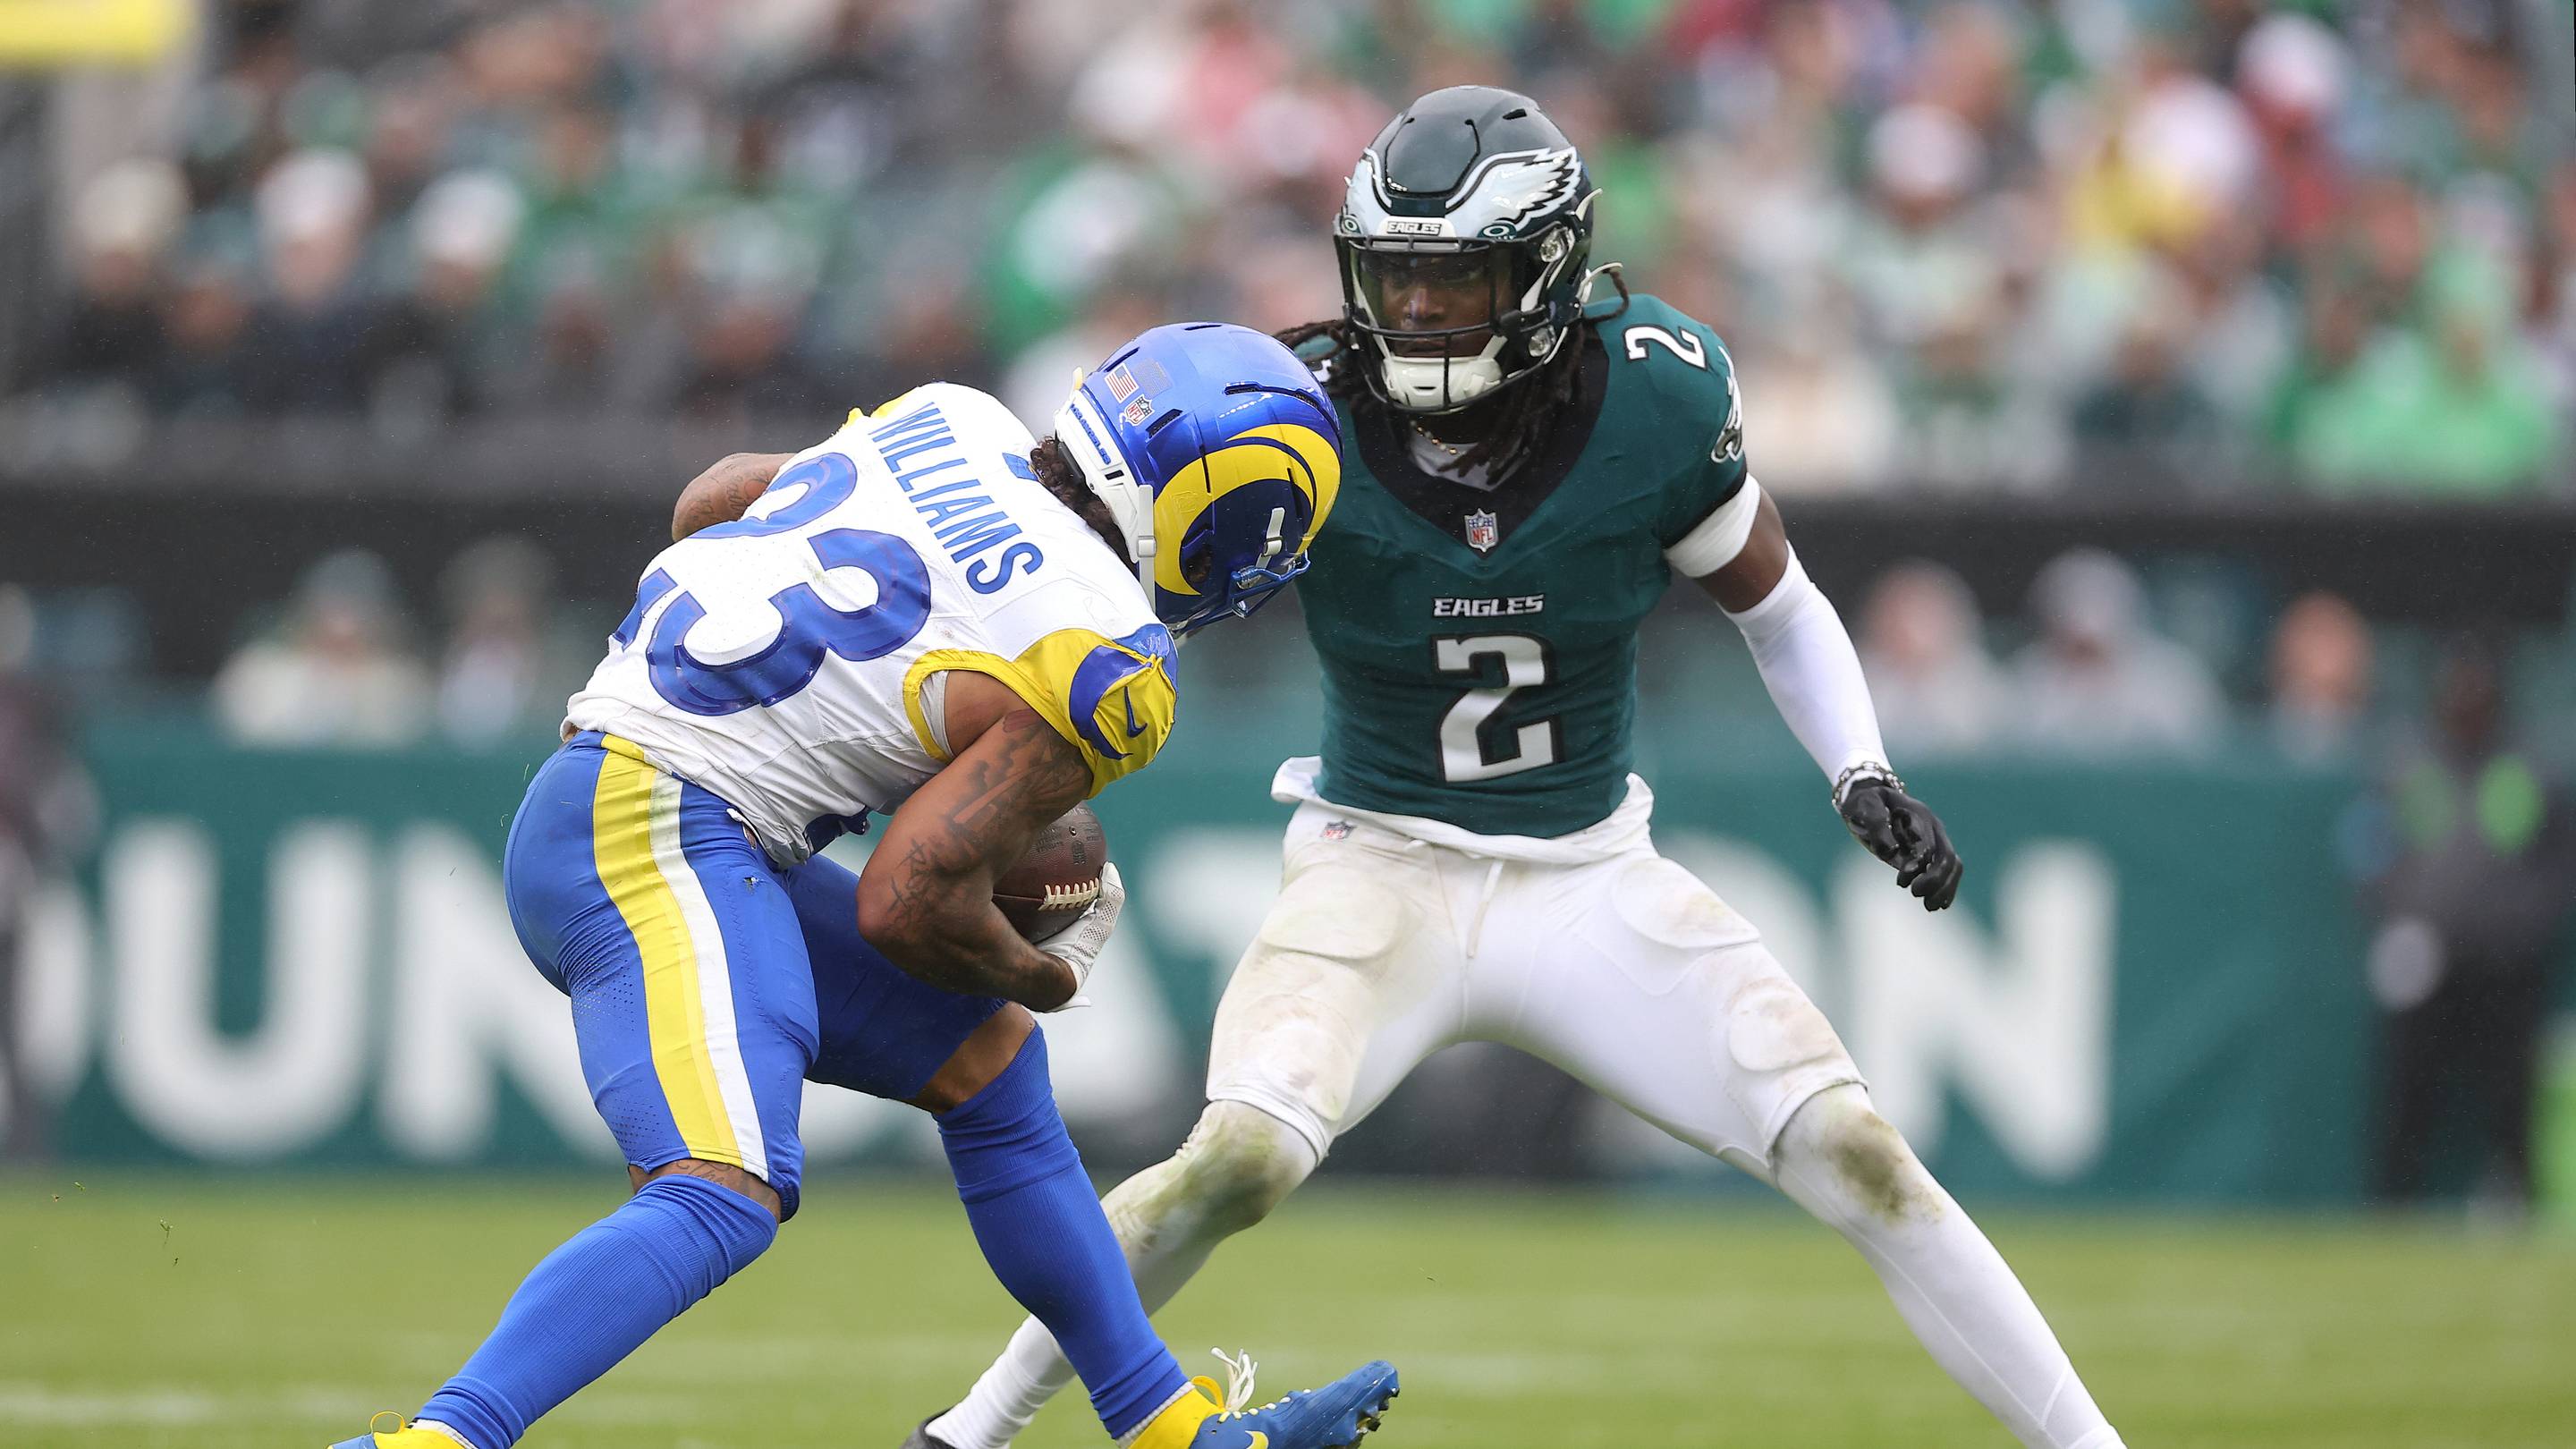
Bears' Deadline Focus Shifts to Cornerback, Not Khalil Mack
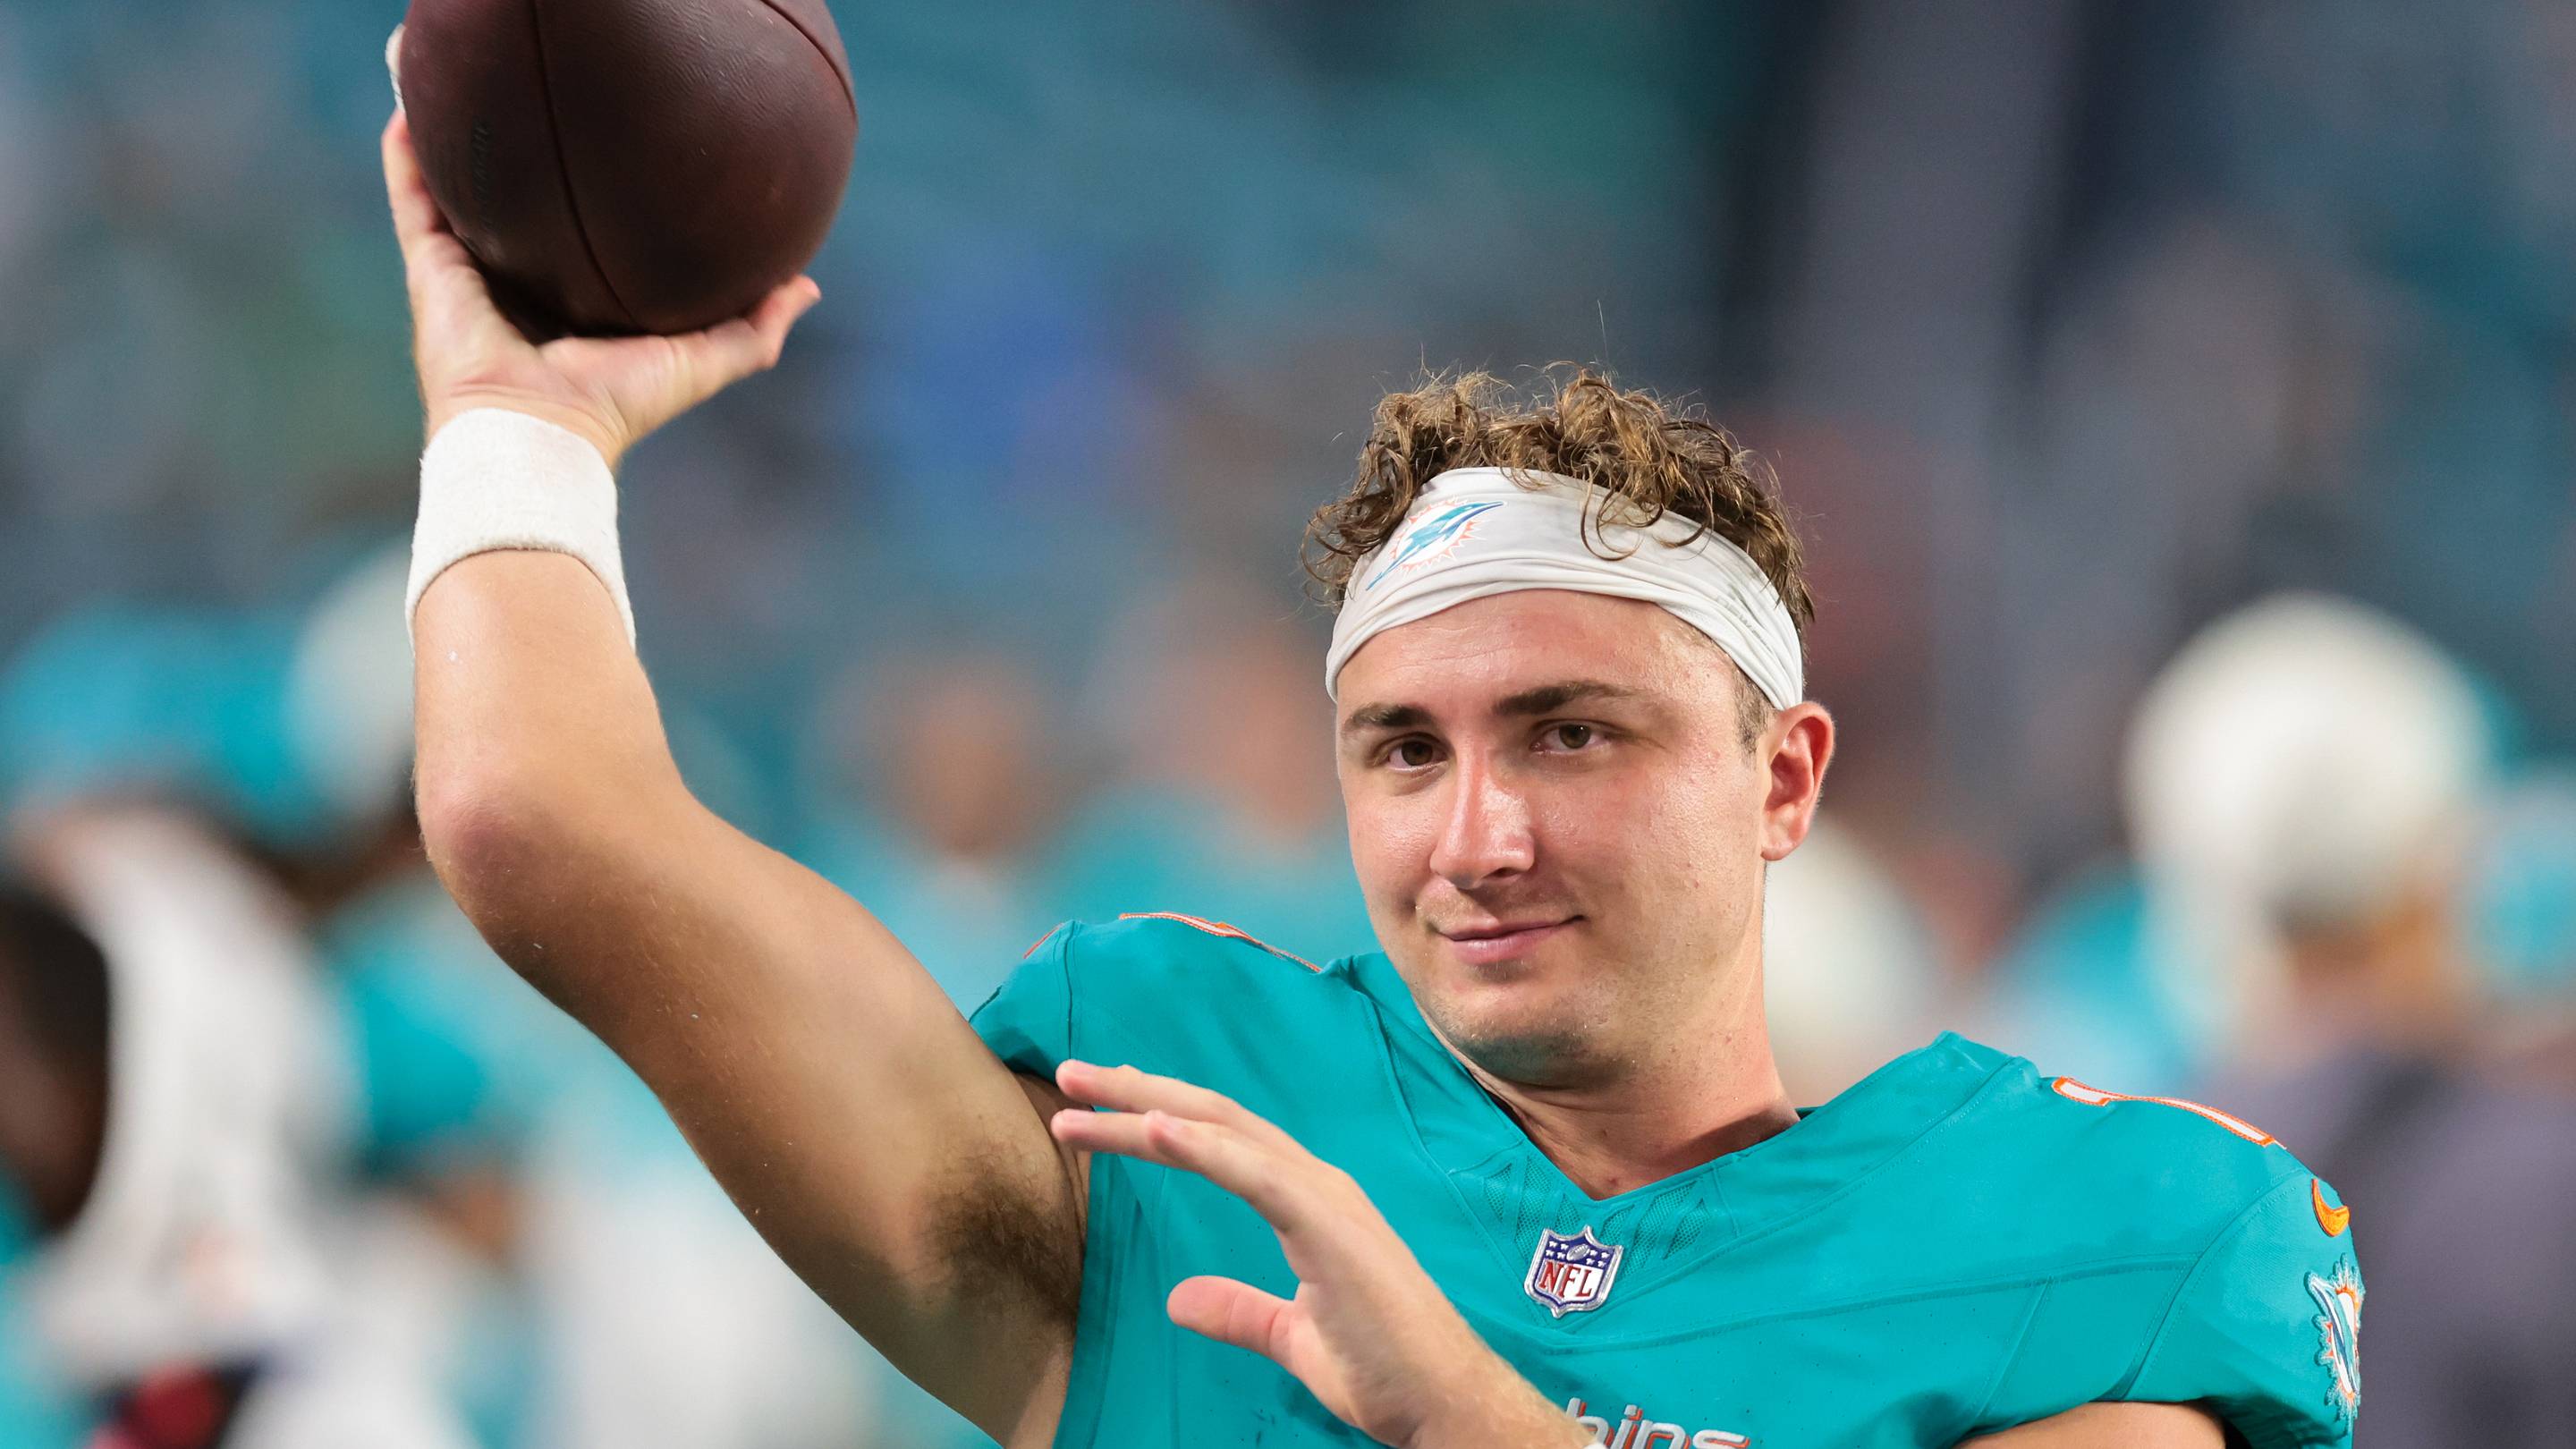
Packers Add QB Cam Miller to Practice Squad After Tom Brady's St…

Packers Super Bowl Champion Phil Vandersea Passes Away at 83 Aft…