



VANCOUVER
CANUCKSVAN
2-7-1 | Road
2


TAMPA BAY
LIGHTNINGTB
6-2-0 | Home
4
Goaltending

GOALTENDER
Kevin Lankinen
#32 | Goaltender@

GOALTENDER
Dennis Hildeby
#35 | Goaltender| Player | W-L-OTL | GAA | SV% | SO |
|---|---|---|---|---|
| Kevin Lankinen | None-None | 4.24 | 0.886 | -- |
| Dennis Hildeby | None-None | 2.01 | 0.857 | -- |
None-None
W-L-OTL
None-None
4.24
GAA
Ldr 2.01
0.886 Ldr
Save %
0.857
--
SO
--
AI Model Win Probability
CANUCKS
21%
LIGHTNING
79%
▲ Edge: +0.50% (TB)
CANUCKS
24%
Book Odds: +309
LIGHTNING
78%
Book Odds: -363
AI Model Projected Total
AI Projection
6.5
Projected
Book Total
6.5
Over / Under Line
Over 6.5
50%
Under 6.5
50%
AI Model Spread Expectation
AI Spread Proj
+1.5
VANCOUVER
Book Spread
+2.5
Book Line
▲ Edge: +1.0 points (Vancouver)
Spread Distribution
AI Model
+6+4+20-2-4-6
Distribution centered around VAN +1.5 expected margin.
Margin of Victory (VAN)
VAN By 1 goal
9.2%
VAN By 2-3 goals
6.1%
TB By 1 goal
19.1%
TB By 2-3 goals
34.1%
AI Model Projected Score
Vancouver
2.5
VANCOUVER
Book Implied: 2
Tampa Bay
4
TAMPA BAY
Book Implied: 4.50
Simulated Score
Vancouver
2
VANCOUVER
Book Implied: 2
Tampa Bay
3
TAMPA BAY
Book Implied: 4.50
Projections Grades
Moneyline (ML)
Agreement
👑 Top Selection
AI
Lightning
Win
79% Win Prob
A
Sim
Lightning
Win
69% Win Prob
A
Puck Line (ATS)
Agreement
👑 Top Selection
AI
Canucks (+2.5)
Win
Proj Goals: +1.5
A
Sim
Canucks (+2.5)
Win
Proj Goals: +1.0
A
Over/Under (Total)
Divergence
AI
u6.5
Win
Proj Total: 6.5
D
Sim
u6.5
Win
Proj Total: 5.0
A
Head-to-Head History
Date
Game
Score
Oct 17, 2026
VAN @ TB
2 - 4
Mar 19, 2026
TB @ VAN
6 - 2
Nov 16, 2025
VAN @ TB
6 - 2
Dec 8, 2024
TB @ VAN
4 - 2
Oct 15, 2024
VAN @ TB
1 - 4
Key Model Drivers
Shots on Goal (L5)
+46.5% more
Tampa Bay: 30.6
vs
Vancouver: 20.9
Blocked Shots (L5)
+28.2% more
Vancouver: 15.9
vs
Tampa Bay: 11.4
Power Play % (L5)
+5.9%
Vancouver: 12.9%
vs
Tampa Bay: 7.0%
Faceoff % (L5)
+2.7%
Vancouver: 45.9%
vs
Tampa Bay: 43.2%
Post-Mortem Analysis
Metric
Projected
Actual
Score Game
VAN Score
2.5
2
TB Score
4.0
4
Team Stats Splits (Home / Away)
Blocked Shots
11.4 / 15.9
21.0 / 16.0
Faceoff %
43.2 / 45.9
62.3 / 37.7
Hits
23.7 / 24.1
21.0 / 17.0
Power Play %
7.0 / 12.9
100.0 / 50.0
Shots on Goal
30.6 / 20.9
35.0 / 14.0
Takeaways
4.3 / 4.0
2.0 / 3.0
Public Market Splits
Moneyline
Open: +300 / -380
→
+309 / -363
↓
Spread (ATS)
Open: +1.5 / -1.5
→
+2.5 / -2.5
↑
Total (O/U)
Open: 6.5
→
6.5
Season to Date Model Accuracy
AI Model
SIM Engine
TB
VAN
TB
VAN
ML
57%
8-6
82%
14-3
79%
11-3
65%
11-6
ATS
50%
7-7
47%
8-9
50%
7-7
47%
8-9
TTL
46%
6-7-1
47%
8-9
54%
7-6-1
53%
9-8
Contextual Game News

Dylan Larkin Trade Stalls as Four Approved Teams Show Little Urg…

Sullivan Flags Rangers' Recurring Stick Penalties Despite League…
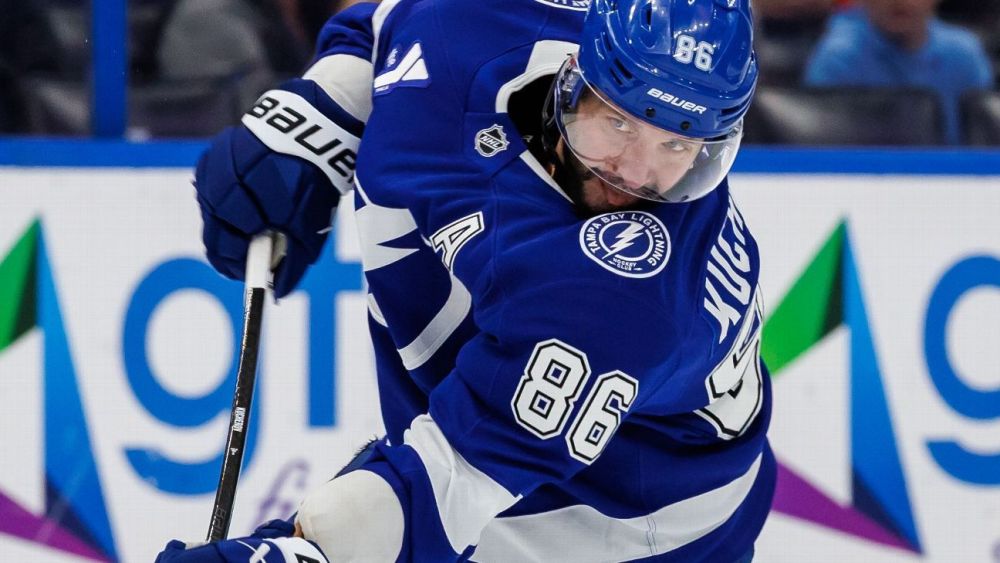
Kucherov Shines at Home as Lightning Extend Home Win Streak to S…

Gauthier's Hat Trick Heroics Lift Ducks Over Canucks in Thrillin…

Gauthier's Hat Trick Heroics Lift Ducks Over Canucks in High-Sco…