



SEATTLE
KRAKENSEA
5-2-0 | Road
3


PHILADELPHIA
FLYERSPHI
0-5-3 | Home
2
Goaltending

GOALTENDER
Philipp Grubauer
#31 | Goaltender@

GOALTENDER
Dan Vladar
#80 | Goaltender| Player | W-L-OTL | GAA | SV% | SO |
|---|---|---|---|---|
| Philipp Grubauer | None-None | 1.85 | 0.923 | -- |
| Dan Vladar | None-None | 1.85 | 0.935 | -- |
None-None
W-L-OTL
None-None
1.85
GAA
1.85
0.923
Save %
Ldr 0.935
--
SO
--
AI Model Win Probability
KRAKEN
43%
FLYERS
57%
▲ Edge: +4.40% (PHI)
KRAKEN
50%
Book Odds: -101
FLYERS
52%
Book Odds: -109
AI Model Projected Total
AI Projection
6.0
Projected
Book Total
6.0
Over / Under Line
Over 6.0
50%
Under 6.0
50%
AI Model Spread Expectation
AI Spread Proj
-1.6
PHILADELPHIA
Book Spread
-1.5
Book Line
▲ Edge: +0.1 points (Philadelphia)
Spread Distribution
AI Model
+6+4+20-2-4-6
Distribution centered around PHI -1.6 expected margin.
Margin of Victory (PHI)
SEA By 1 goal
8.6%
SEA By 2-3 goals
5.5%
PHI By 1 goal
18.9%
PHI By 2-3 goals
34.9%
AI Model Projected Score
Seattle
2.2
SEATTLE
Book Implied: 2.20
Philadelphia
3.8
PHILADELPHIA
Book Implied: 3.80
Simulated Score
Seattle
3
SEATTLE
Book Implied: 2.20
Philadelphia
2
PHILADELPHIA
Book Implied: 3.80
Projections Grades
Moneyline (ML)
Divergence
AI
Flyers
Loss
57% Win Prob
D
Sim
Kraken
Win
70% Win Prob
A
Puck Line (ATS)
Divergence
AI
Flyers (-1.5)
Loss
Proj Goals: -1.6
D
Sim
Kraken (+1.5)
Win
Proj Goals: -1.0
A
Over/Under (Total)
Divergence
AI
u6.0
Win
Proj Total: 6.0
D
Sim
u6.0
Win
Proj Total: 5.0
A
Head-to-Head History
Date
Game
Score
Oct 13, 2026
SEA @ PHI
3 - 2
Dec 28, 2025
PHI @ SEA
1 - 4
Oct 20, 2025
SEA @ PHI
2 - 5
Mar 8, 2025
SEA @ PHI
4 - 1
Oct 17, 2024
PHI @ SEA
4 - 6
Key Model Drivers
Hits (L5)
+38.0% more
Philadelphia: 23.1
vs
Seattle: 16.7
Shots on Goal (L5)
+27.3% more
Seattle: 26.5
vs
Philadelphia: 19.3
Takeaways (L5)
+19.8% more
Seattle: 5.9
vs
Philadelphia: 4.7
Power Play % (L5)
+5.2%
Seattle: 16.3%
vs
Philadelphia: 11.1%
Post-Mortem Analysis
Metric
Projected
Actual
Score Game
SEA Score
2.2
3
PHI Score
3.8
2
Team Stats Splits (Home / Away)
Blocked Shots
15.4 / 16.6
13.0 / 17.0
Faceoff %
49.9 / 49.9
55.4 / 44.6
Hits
23.1 / 16.7
31.0 / 13.0
Power Play %
11.1 / 16.3
0.0 / 20.0
Shots on Goal
19.3 / 26.5
26.0 / 31.0
Takeaways
4.7 / 5.9
4.0 / 5.0
Public Market Splits
Moneyline
Open: +110 / -130
→
-101 / -109
↓
Spread (ATS)
Open: +1.5 / -1.5
→
+1.5 / -1.5
Total (O/U)
Open: 5.5
→
6
↑
Season to Date Model Accuracy
AI Model
SIM Engine
PHI
SEA
PHI
SEA
ML
53%
8-7
57%
8-6
40%
6-9
43%
6-8
ATS
40%
6-9
50%
7-7
53%
8-7
64%
9-5
TTL
53%
8-7
23%
3-10-1
47%
7-8
46%
6-7-1
Contextual Game News

Sabres Shatter Season Block Record With 30 Stops In Win Over Kin…
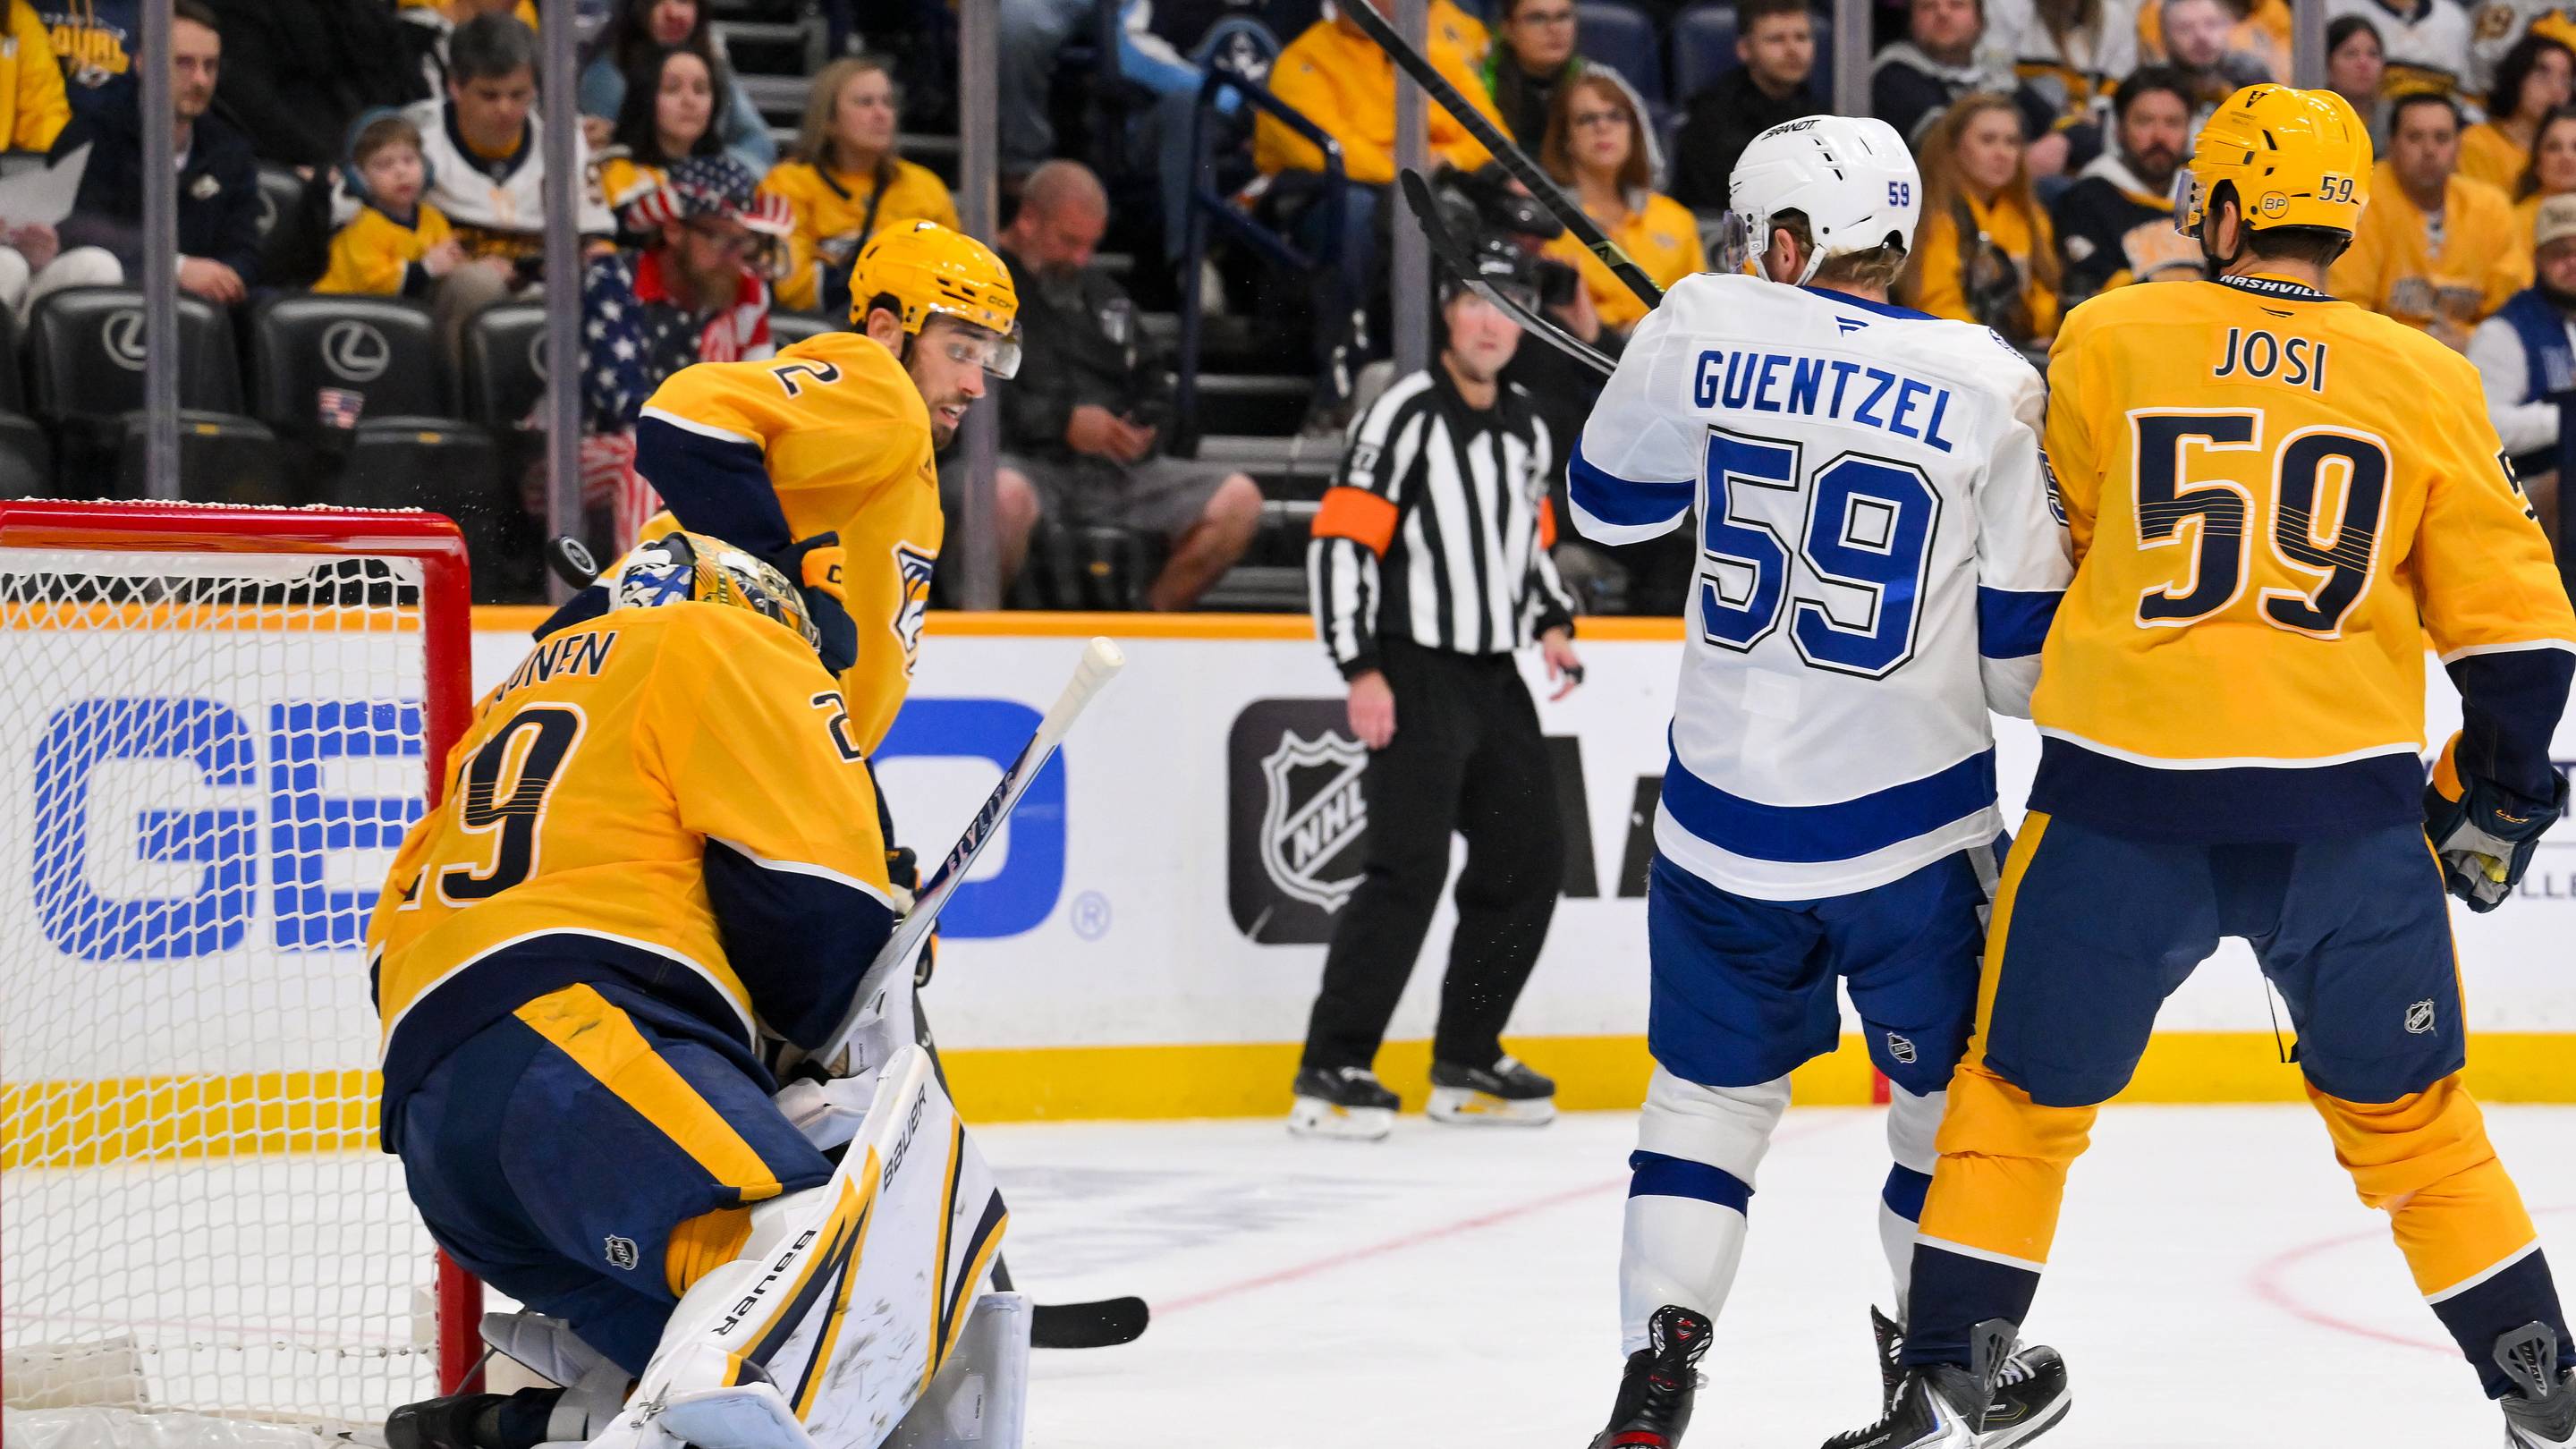
Predators' Penalty Kill Shines in Shootout Win Over Lightning

Elias Lindholm Silences Doubters with Stellar Third Season for B…

Nick Robertson Thriving with Penguins After Maple Leafs Stint

Lost Gear, Delayed Debut: Dakota Joshua's Unbelievable NHL Retur…