


OKLAHOMA
OKLAHOMAOU
4-3 | Road
23

MISSISSIPPI STATE
MISSISSIPPI STMSST
4-3 | Home
15
Key Game
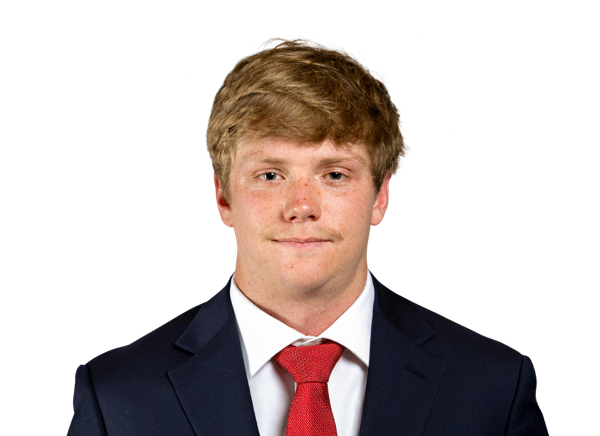
KEY GAME
Tate Sandell
#29 | Place kicker@
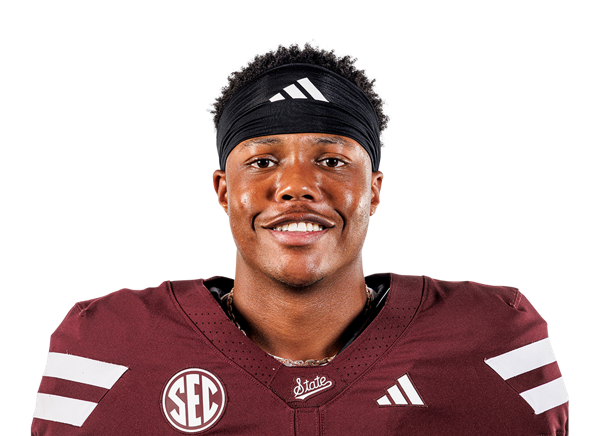
KEY GAME
Ethan Pulliam
#8 | Punter| Player | |
|---|---|
| Tate Sandell | None-None |
| Ethan Pulliam | None-None |
None-None
W-L
None-None
AI Model Win Probability
OKLAHOMA
60%
MISSISSIPPI ST
40%
▲ Edge: +5.40% (OU)
OKLAHOMA
54%
Book Odds: -119
MISSISSIPPI ST
48%
Book Odds: +108
AI Model Projected Total
AI Projection
51.6
Projected
Book Total
49.5
Over / Under Line
▲
Edge: +2.1 (Over)
Over 49.5
55%
Under 49.5
45%
AI Model Spread Expectation
AI Spread Proj
-4.0
OKLAHOMA
Book Spread
-1.5
Book Line
▲ Edge: +2.5 points (Oklahoma)
Spread Distribution
AI Model
-42-28-140+14+28+42
Distribution centered around OU -4.0 expected margin.
Margin of Victory (OU)
OU By 1-6 points
17.0%
OU By 7-13 points
18.0%
MSST By 1-6 points
14.7%
MSST By 7-13 points
12.1%
AI Model Projected Score
Oklahoma
27.8
OKLAHOMA
Book Implied: 25.50
Mississippi State
23.8
MISSISSIPPI STATE
Book Implied: 24
Simulated Score
Oklahoma
21
OKLAHOMA
Book Implied: 25.50
Mississippi State
42
MISSISSIPPI STATE
Book Implied: 24
Projections Grades
Moneyline (ML)
Divergence
AI
Oklahoma
Win
60% Win Prob
C
Sim
Mississippi St
Loss
98% Win Prob
A
Point Spread (ATS)
Divergence
AI
Oklahoma (-1.5)
Win
Proj Spread: -4.0
C
Sim
Mississippi St (+1.5)
Loss
Proj Spread: -21.0
A
Over/Under (Total)
Agreement
AI
o49.5
Loss
Proj Total: 51.6
C
Sim
o49.5
Loss
Proj Total: 63.0
A
Head-to-Head History
Date
Game
Score
Oct 24, 2026
OU @ MSST
23 - 15
Key Model Drivers
Turnovers (L5)
+35.5% more
Oklahoma: 2.5
vs
Mississippi State: 1.6
Rushing Yards (L5)
+76.6% more
Mississippi State: 143.4
vs
Oklahoma: 81.2
First Downs (L5)
+33.7% more
Mississippi State: 22.1
vs
Oklahoma: 16.5
Total Yards (L5)
+23.6% more
Mississippi State: 380.7
vs
Oklahoma: 307.9
Post-Mortem Analysis
Metric
Projected
Actual
Score Game
OU Score
27.8
23
MSST Score
23.8
15
Team Stats Splits (Home / Away)
First Downs
22.1 / 16.5
17.0 / 21.0
Rushing Yards
143.4 / 81.2
166.0 / 184.0
Third Down Efficiency
0.5 / 0.3
0.09 / 0.44
Time of Possession
0.5 / 0.5
0.45 / 0.55
Total Yards
380.7 / 307.9
352.0 / 467.0
Turnovers
1.6 / 2.5
2.0 / 1.0
Public Market Splits
Moneyline
Open: -125 / +105
→
-119 / +108
↓
Spread (ATS)
Open: -1.5 / +1.5
→
-1.5 / +1.5
Total (O/U)
Open: 46.5
→
49.5
↑
Situational Trends
📊 Win-Loss
OU
4-4-0
(50.0%)
Margin: 1.3
ATS +/-: -6.3
MSST
4-4-0
(50.0%)
Margin: -1.5
ATS +/-: +0.4
🎯 ATS (Spread)
OU
3-5-0
(37.5%)
Margin: 1.3
ATS +/-: -6.3
MSST
Advantage
4-4-0
(50.0%)
Margin: -1.5
ATS +/-: +0.4
⚖️ Over/Under
OU
3-5-0
O: 37.5% / U: 62.5%
Total +/-: -2.9
MSST
3-5-0
O: 37.5% / U: 62.5%
Total +/-: -0.9
Season to Date Model Accuracy
AI Model
SIM Engine
MSST
OU
MSST
OU
ML
62%
5-3
75%
6-2
62%
5-3
62%
5-3
ATS
25%
2-6
50%
4-4
38%
3-5
62%
5-3
TTL
25%
2-6
50%
4-4
0%
0-8
38%
3-5
Contextual Game News

No. 22 New Mexico Makes AP Poll History with 31-3 Rout of Nevada

Wisconsin Turning to Freshman QB Hopkins to Ignite Offense Again…
Illinois Clinches Bowl Eligibility with 24-13 Win Over Nebraska,…

Oregon and Ohio State Set for Recruiting Duel Over 2028 Wide Rec…
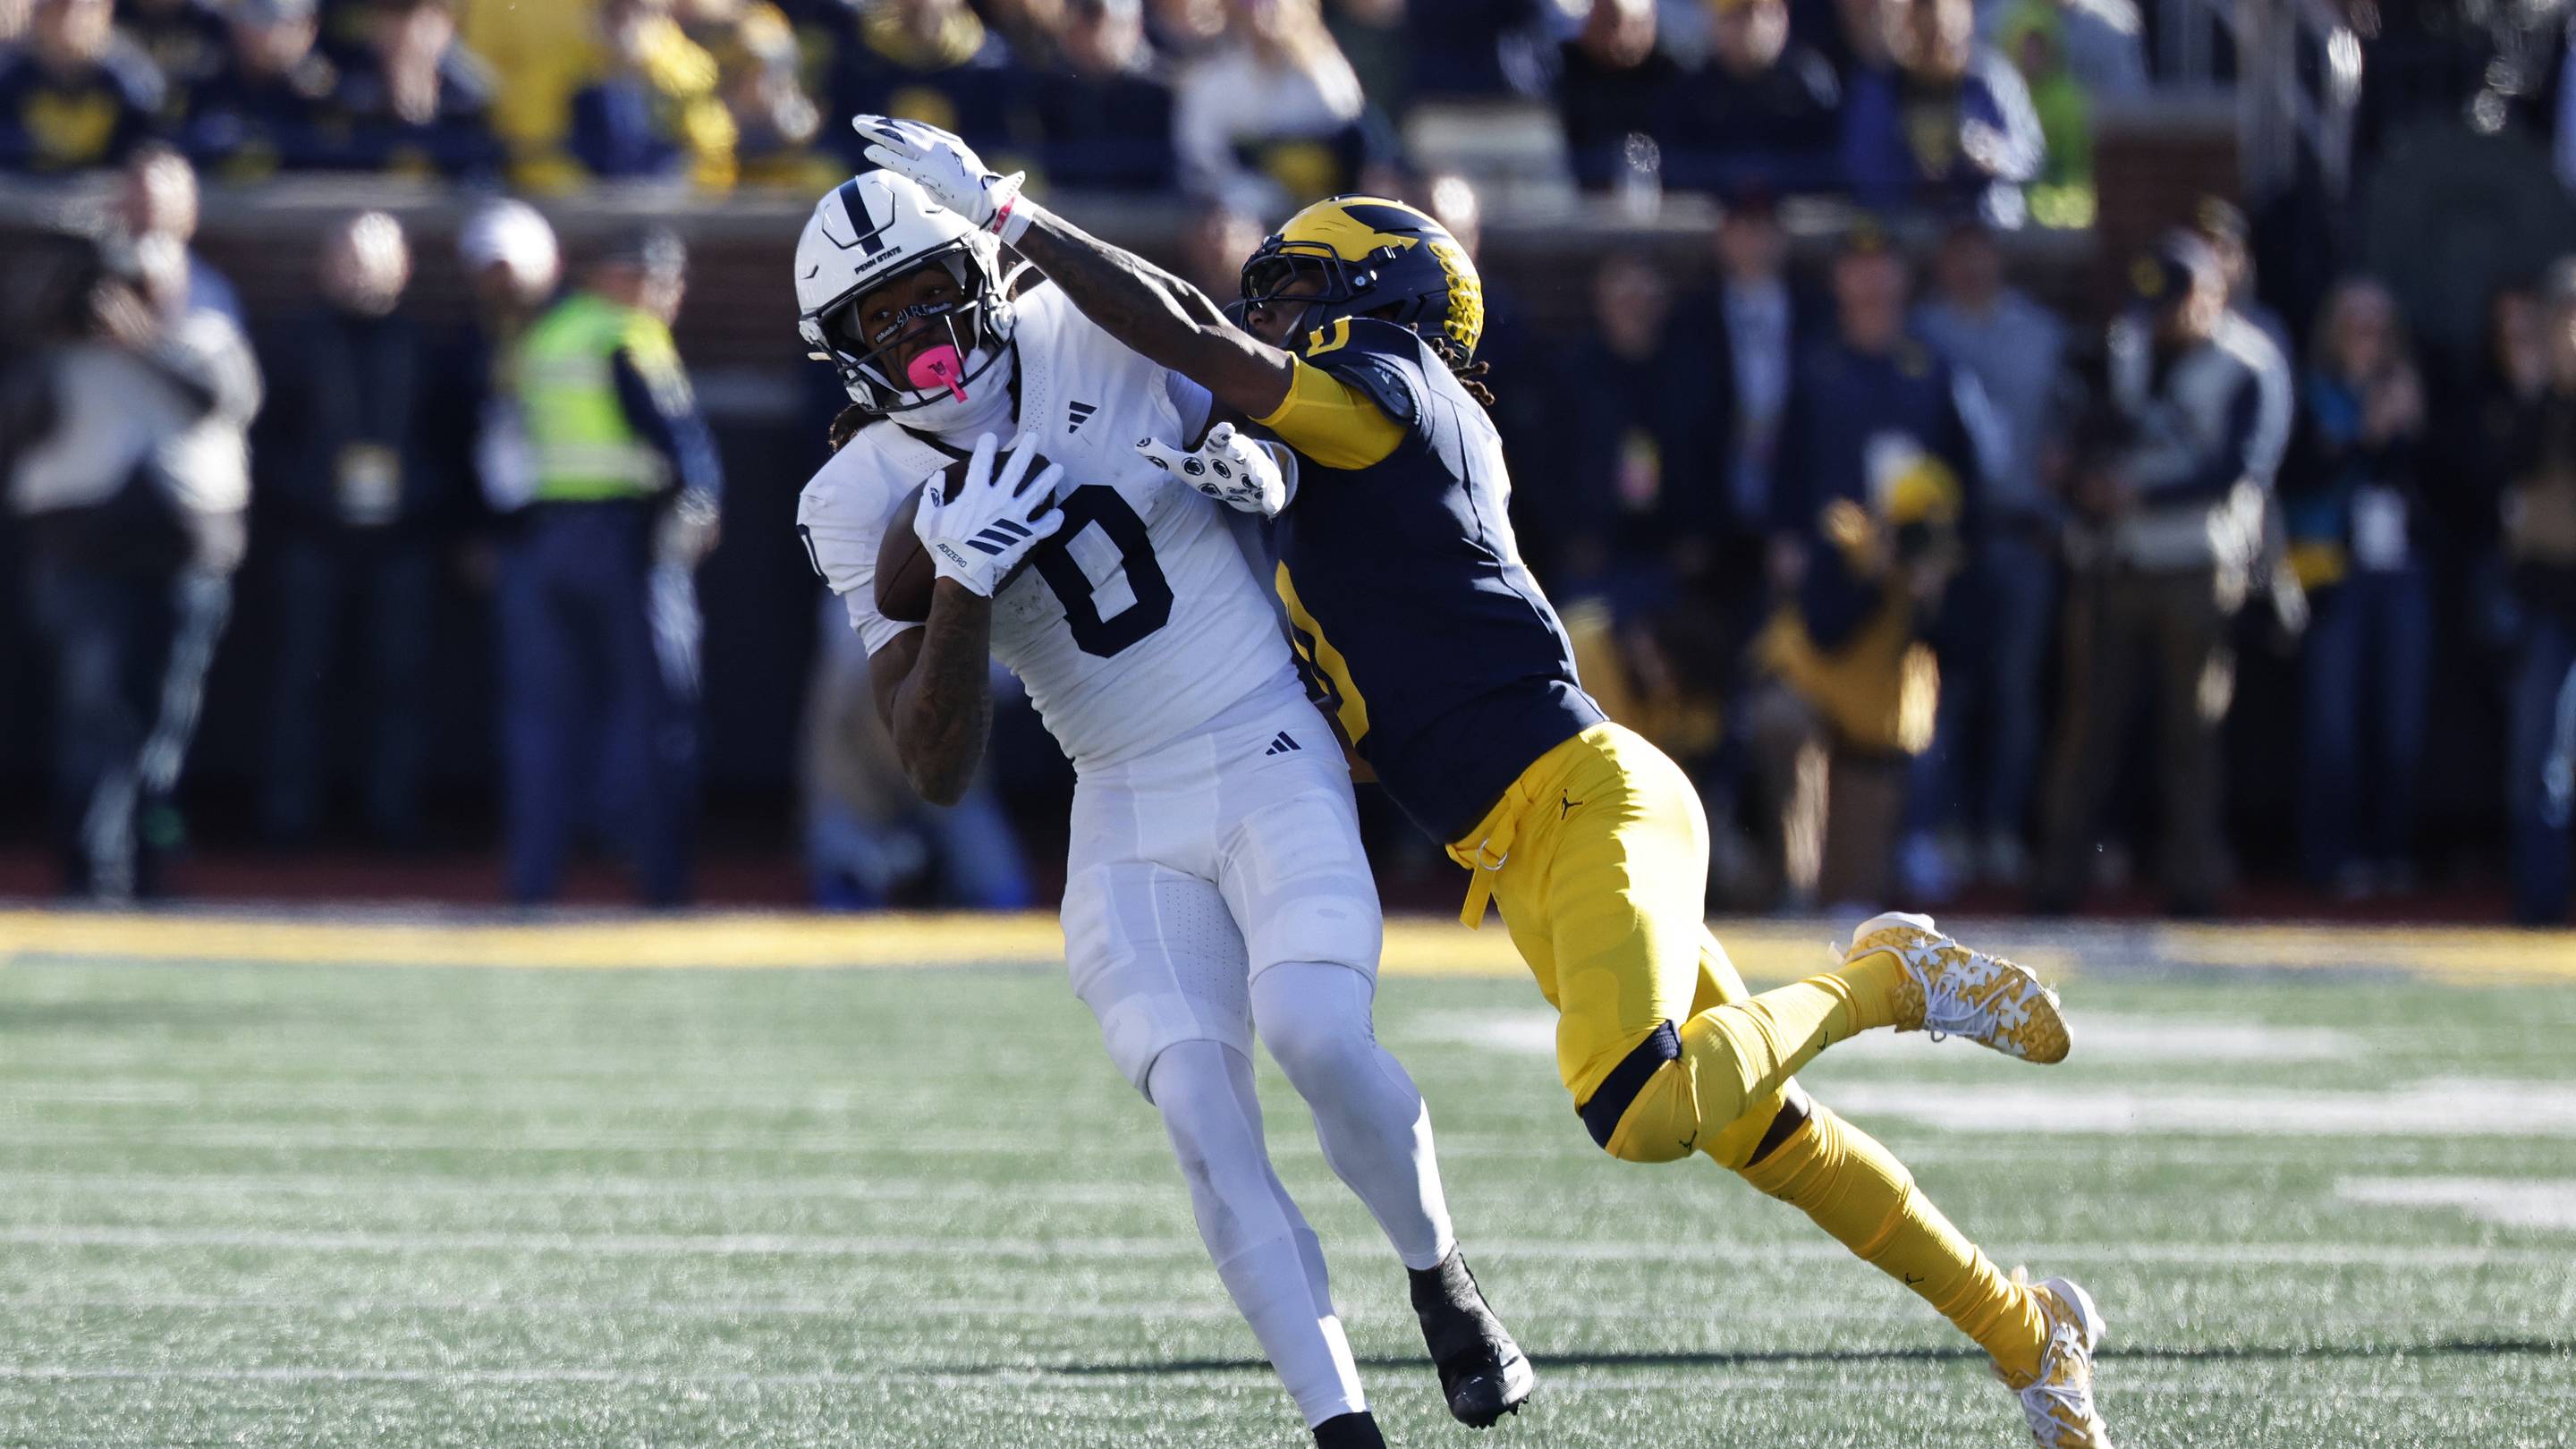
Penn State's Thin Receiver Corps Faces Tough Test at Washington