



VANCOUVER
CANUCKSVAN
2-4-0 | Road
1


NEW JERSEY
DEVILSNJ
2-2-0 | Home
4
Goaltending

GOALTENDER
Kevin Lankinen
#32 | Goaltender@

GOALTENDER
Jake Allen
#34 | Goaltender| Player | W-L-OTL | GAA | SV% | SO |
|---|---|---|---|---|
| Kevin Lankinen | None-None | 11.01 | 0.667 | -- |
| Jake Allen | None-None | 1.00 | 0.952 | -- |
None-None
W-L-OTL
None-None
11.01
GAA
Ldr 1.00
0.667
Save %
Ldr 0.952
--
SO
--
AI Model Win Probability
CANUCKS
26%
DEVILS
74%
CANUCKS
29%
Book Odds: +247
DEVILS
74%
Book Odds: -284
AI Model Projected Total
AI Projection
8.0
Projected
Book Total
6.5
Over / Under Line
▲
Edge: +1.5 (Over)
Over 6.5
74%
Under 6.5
26%
AI Model Spread Expectation
AI Spread Proj
-1.6
NEW JERSEY
Book Spread
-1.5
Book Line
▲ Edge: +0.1 points (New Jersey)
Spread Distribution
AI Model
+6+4+20-2-4-6
Distribution centered around NJ -1.6 expected margin.
Margin of Victory (NJ)
VAN By 1 goal
8.6%
VAN By 2-3 goals
5.5%
NJ By 1 goal
18.9%
NJ By 2-3 goals
34.9%
AI Model Projected Score
Vancouver
3.2
VANCOUVER
Book Implied: 2.50
New Jersey
4.8
NEW JERSEY
Book Implied: 4
Simulated Score
Vancouver
2
VANCOUVER
Book Implied: 2.50
New Jersey
3
NEW JERSEY
Book Implied: 4
Projections Grades
Moneyline (ML)
Agreement
👑 Top Selection
AI
Devils
Win
74% Win Prob
A
Sim
Devils
Win
69% Win Prob
A
Puck Line (ATS)
Divergence
AI
Devils (-1.5)
Win
Proj Goals: -1.6
D
Sim
Canucks (+1.5)
Loss
Proj Goals: +1.0
B
Over/Under (Total)
Divergence
👑 Top Selection
AI
o6.5
Loss
Proj Total: 8.0
A
Sim
u6.5
Win
Proj Total: 5.0
A
Head-to-Head History
Date
Game
Score
Oct 10, 2026
VAN @ NJ
1 - 4
Jan 23, 2026
NJ @ VAN
5 - 4
Dec 14, 2025
VAN @ NJ
2 - 1
Mar 24, 2025
VAN @ NJ
4 - 3
Oct 30, 2024
NJ @ VAN
6 - 0
Key Model Drivers
Shots on Goal (L5)
+78.8% more
New Jersey: 38.8
vs
Vancouver: 21.7
Hits (L5)
+44.5% more
Vancouver: 23.2
vs
New Jersey: 12.9
Blocked Shots (L5)
+28.4% more
Vancouver: 15.2
vs
New Jersey: 10.9
Power Play % (L5)
+13.9%
Vancouver: 20.6%
vs
New Jersey: 6.7%
Post-Mortem Analysis
Metric
Projected
Actual
Score Game
VAN Score
3.2
1
NJ Score
4.8
4
Team Stats Splits (Home / Away)
Blocked Shots
10.9 / 15.2
7.0 / 15.0
Faceoff %
48.0 / 50.8
55.6 / 44.4
Hits
12.9 / 23.2
23.0 / 23.0
Power Play %
6.7 / 20.6
75.0 / 33.3
Shots on Goal
38.8 / 21.7
37.0 / 21.0
Takeaways
4.4 / 4.2
4.0 / 6.0
Public Market Splits
Moneyline
Open: +225 / -278
→
+247 / -284
Spread (ATS)
Open: +1.5 / -1.5
→
+1.5 / -1.5
Total (O/U)
Open: 6.5
→
6.5
Season to Date Model Accuracy
AI Model
SIM Engine
NJ
VAN
NJ
VAN
ML
54%
7-6
79%
11-3
54%
7-6
71%
10-4
ATS
54%
7-6
50%
7-7
46%
6-7
43%
6-8
TTL
27%
3-8-2
43%
6-8
55%
6-5-2
50%
7-7
Contextual Game News

NHL Early Surprises: Hellebuyck, McDavid, and Rookie Fowler Stea…
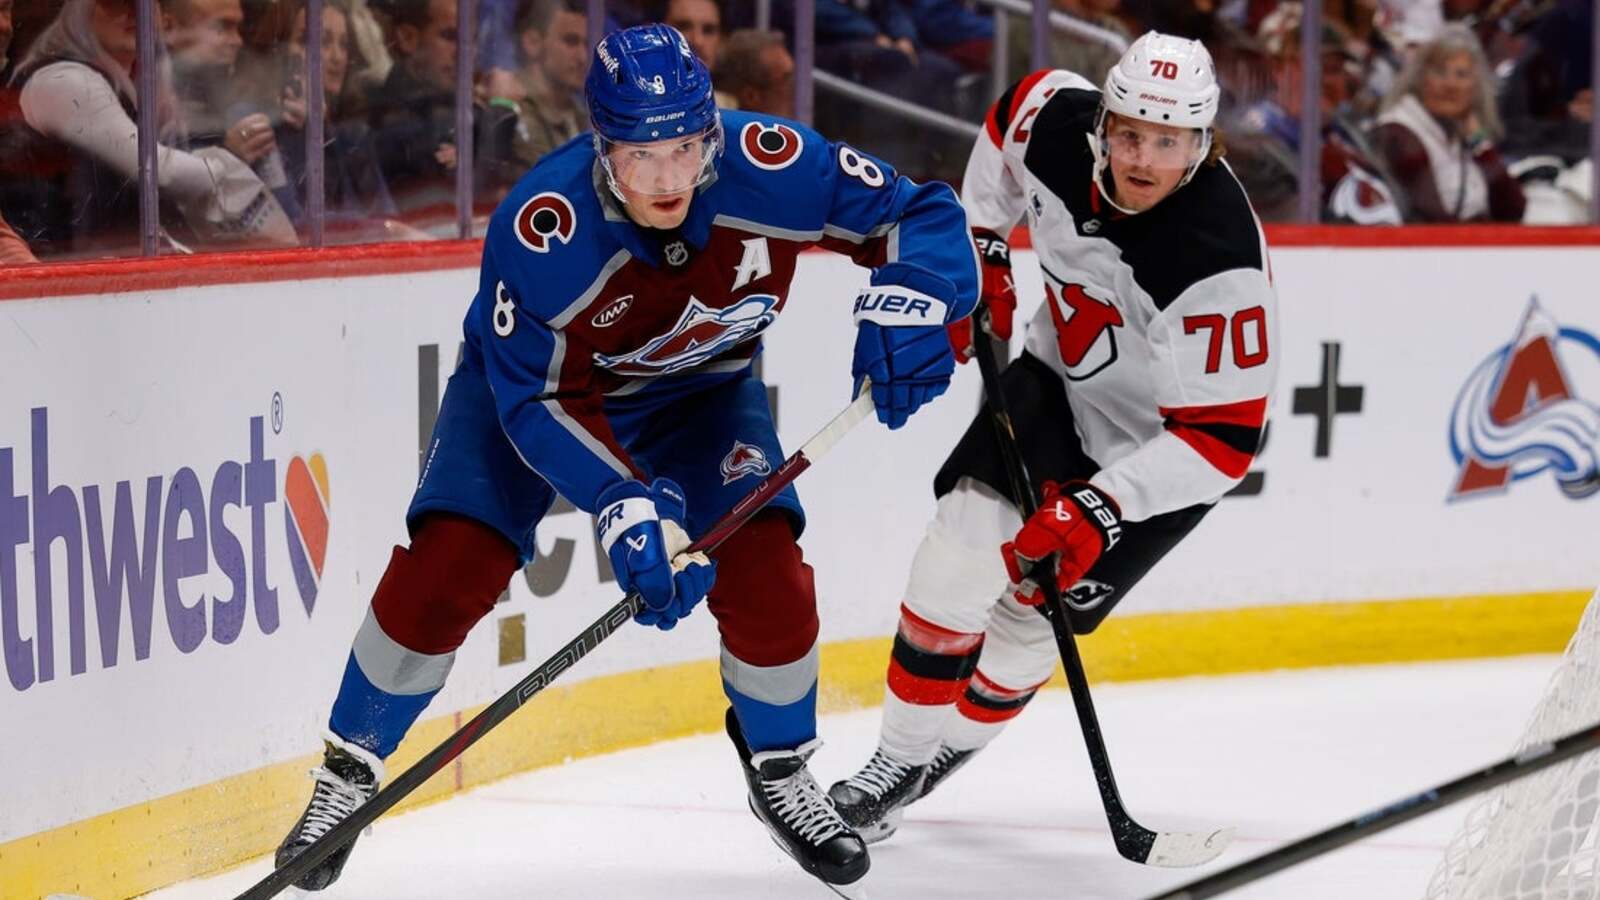
Avalanche Explode in Third Period to Halt Devils' Winning Streak
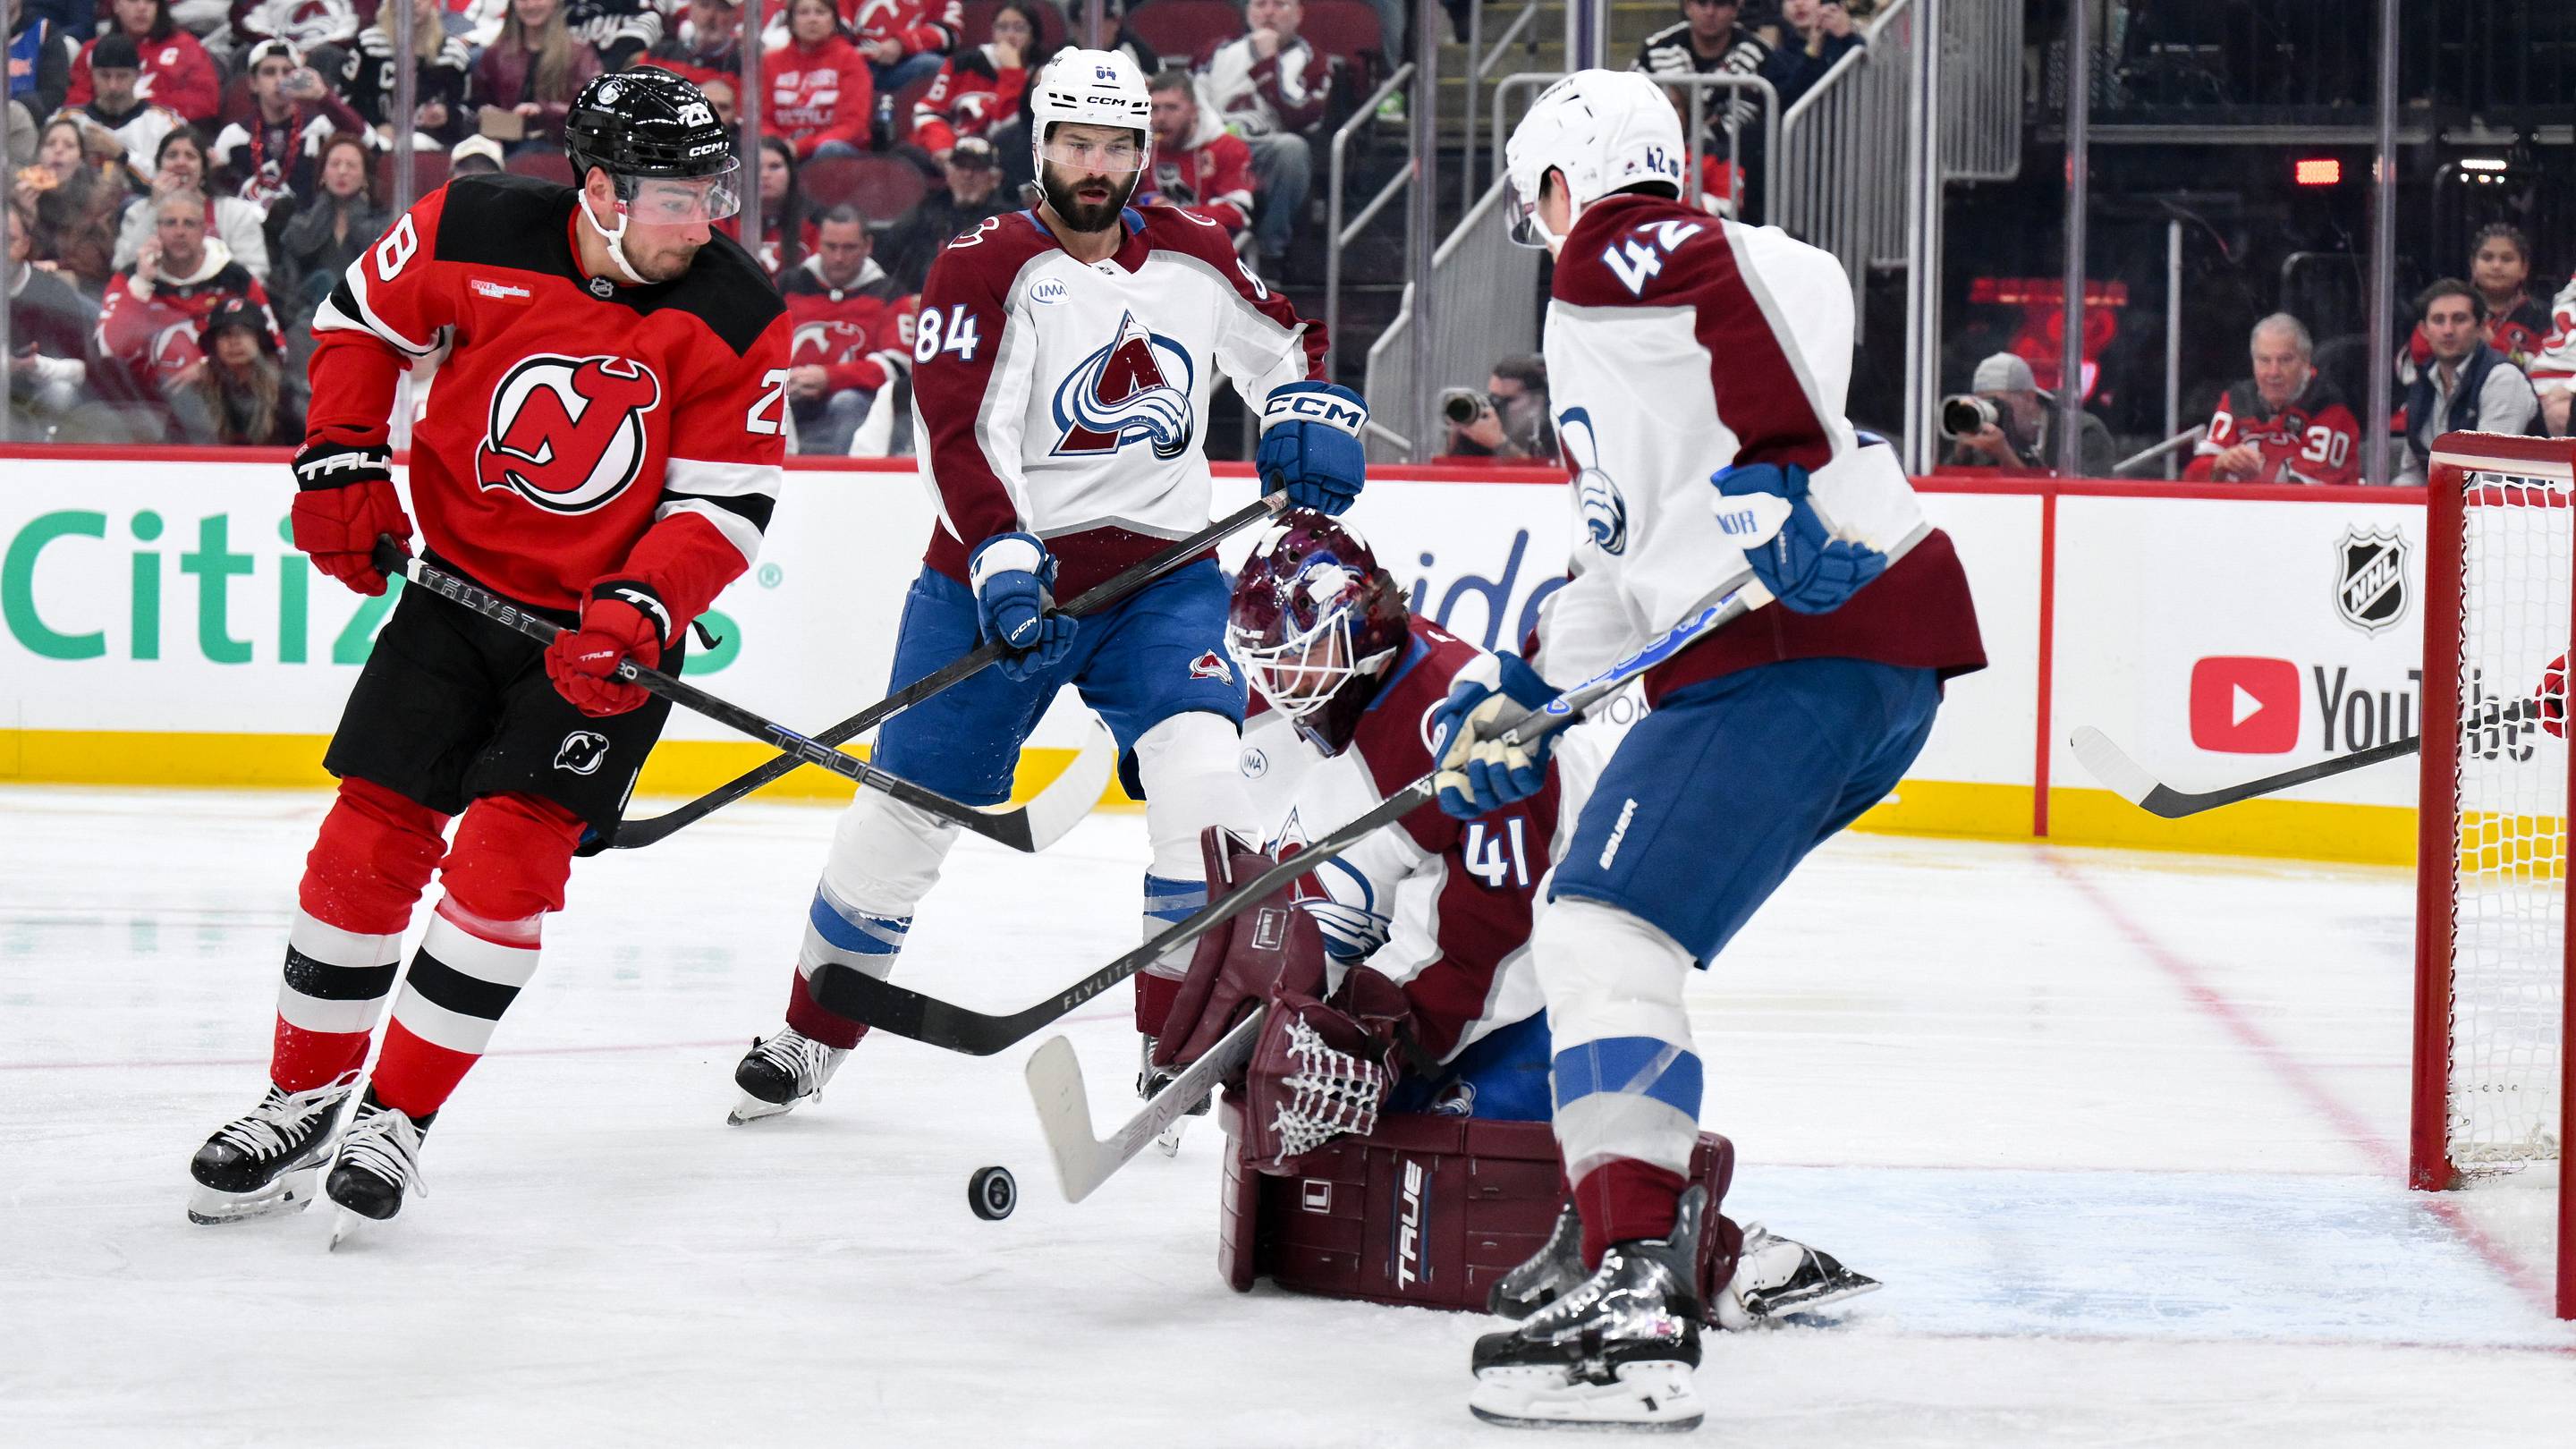
Avalanche Seek Revenge Against Devils, Shake Up Lines
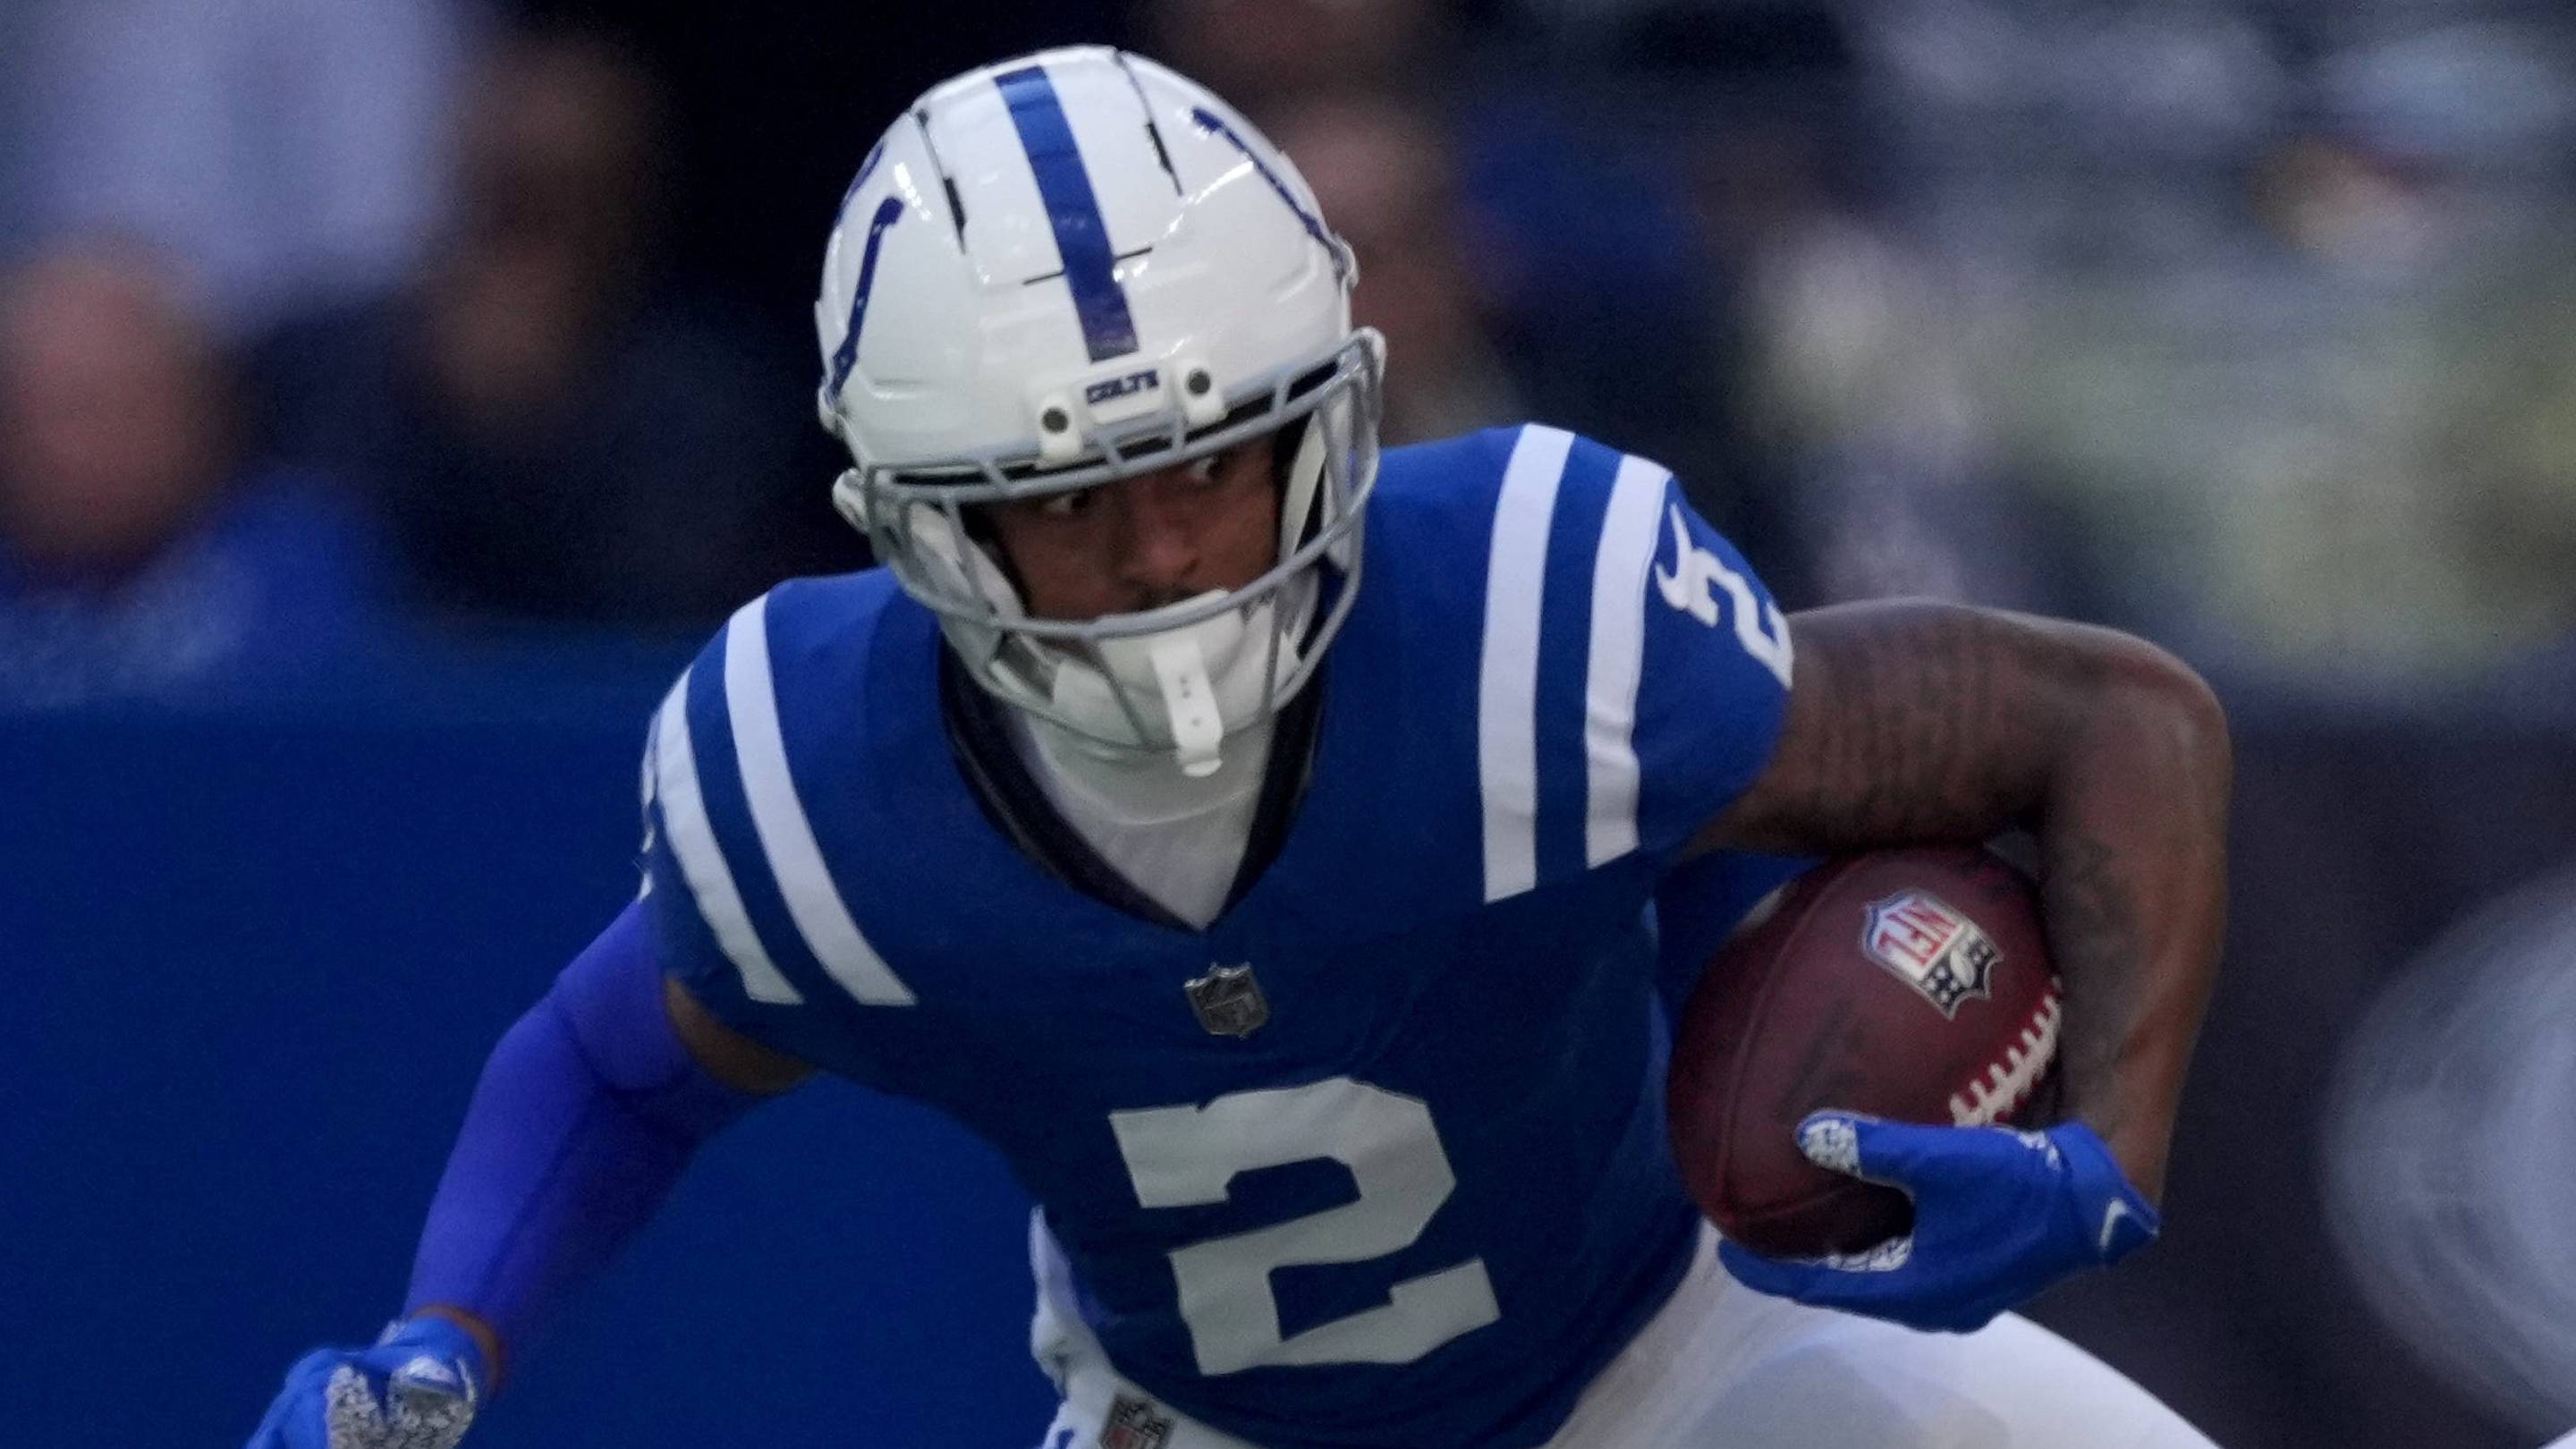
Steelers Eyeing Trade for Colts' Josh Downs to Bolster Banged-Up…

Jacob Fowler's Shutout Masterclass and Kirby Dach's Resurgence F…