


NEBRASKA
NEBRASKANEB
5-2 | Road
14
OREGON
OREGONORE
4-2 | Home
17
Key Game
KEY GAME
Kyle Cunanan
#91 | Place kicker@

KEY GAME
Bailey Ettridge
#39 | Punter| Player | |
|---|---|
| Kyle Cunanan | None-None |
| Bailey Ettridge | None-None |
None-None
W-L
None-None
AI Model Win Probability
NEBRASKA
19%
OREGON
81%
▲ Edge: +11.20% (ORE)
NEBRASKA
35%
Book Odds: +190
OREGON
70%
Book Odds: -230
AI Model Projected Total
AI Projection
60.0
Projected
Book Total
51.5
Over / Under Line
▲
Edge: +8.5 (Over)
Over 51.5
67%
Under 51.5
33%
AI Model Spread Expectation
AI Spread Proj
-15.0
OREGON
Book Spread
-6.5
Book Line
▲ Edge: +8.5 points (Oregon)
Spread Distribution
AI Model
+42+28+140-14-28-42
Distribution centered around ORE -15.0 expected margin.
Margin of Victory (ORE)
NEB By 1-6 points
7.2%
NEB By 7-13 points
4.1%
ORE By 1-6 points
12.2%
ORE By 7-13 points
18.5%
AI Model Projected Score
Nebraska
22.5
NEBRASKA
Book Implied: 22.50
Oregon
37.5
OREGON
Book Implied: 29
Simulated Score
Nebraska
28
NEBRASKA
Book Implied: 22.50
Oregon
36
OREGON
Book Implied: 29
Projections Grades
Moneyline (ML)
Agreement
👑 Top Selection
AI
Oregon
Win
81% Win Prob
A
Sim
Oregon
Win
79% Win Prob
A
Point Spread (ATS)
Agreement
AI
Oregon (-6.5)
Loss
Proj Spread: -15.0
A
Sim
Oregon (-6.5)
Loss
Proj Spread: -8.0
C
Over/Under (Total)
Agreement
👑 Top Selection
AI
o51.5
Loss
Proj Total: 60.0
A
Sim
o51.5
Loss
Proj Total: 64.0
A
Head-to-Head History
Date
Game
Score
Oct 17, 2026
NEB @ ORE
14 - 17
Sep 9, 2017
NEB @ ORE
35 - 42
Sep 17, 2016
ORE @ NEB
32 - 35
Key Model Drivers
Turnovers (L5)
+203.0% more
Oregon: 2.7
vs
Nebraska: 0.7
Rushing Yards (L5)
+27.9% more
Nebraska: 184.0
vs
Oregon: 132.7
First Downs (L5)
+16.7% more
Nebraska: 24.7
vs
Oregon: 20.6
Third Down Efficiency (L5)
+12.0% more
Nebraska: 0.5
vs
Oregon: 0.4
Post-Mortem Analysis
Metric
Projected
Actual
Score Game
NEB Score
22.5
14
ORE Score
37.5
17
Team Stats Splits (Home / Away)
First Downs
20.6 / 24.7
15.0 / 14.0
Rushing Yards
132.7 / 184.0
129.0 / 78.0
Third Down Efficiency
0.4 / 0.5
0.18 / 0.41
Time of Possession
0.5 / 0.6
0.51 / 0.49
Total Yards
432.1 / 422.4
242.0 / 242.0
Turnovers
2.7 / 0.7
2.0 / 1.0
Public Market Splits
Moneyline
Open: +215 / -267
→
+190 / -230
↓
Spread (ATS)
Open: +7 / -7
→
+6.5 / -6.5
↓
Total (O/U)
Open: 51.5
→
51.5
Situational Trends
📊 Win-Loss
NEB
Advantage
5-2-0
(71.4%)
Margin: 20.1
ATS +/-: +7.7
ORE
4-3-0
(57.1%)
Margin: 12.4
ATS +/-: -9.0
🎯 ATS (Spread)
NEB
Advantage
6-1-0
(85.7%)
Margin: 20.1
ATS +/-: +7.7
ORE
2-5-0
(28.6%)
Margin: 12.4
ATS +/-: -9.0
⚖️ Over/Under
NEB
3-4-0
O: 42.9% / U: 57.1%
Total +/-: +0.5
ORE
4-3-0
O: 57.1% / U: 42.9%
Total +/-: -3.2
Season to Date Model Accuracy
AI Model
SIM Engine
ORE
NEB
ORE
NEB
ML
57%
4-3
100%
7-0
43%
3-4
71%
5-2
ATS
14%
1-6
14%
1-6
43%
3-4
43%
3-4
TTL
14%
1-6
43%
3-4
43%
3-4
43%
3-4
Contextual Game News

Idaho State Stuns Utah Tech with Two Late Pick-Sixes, 34-27

Florida State Fans Fly 'Fire Novell' Banner with Spelling Error …

Halloween Fright Night: Will More Top 25 Teams Fall in Week 9?
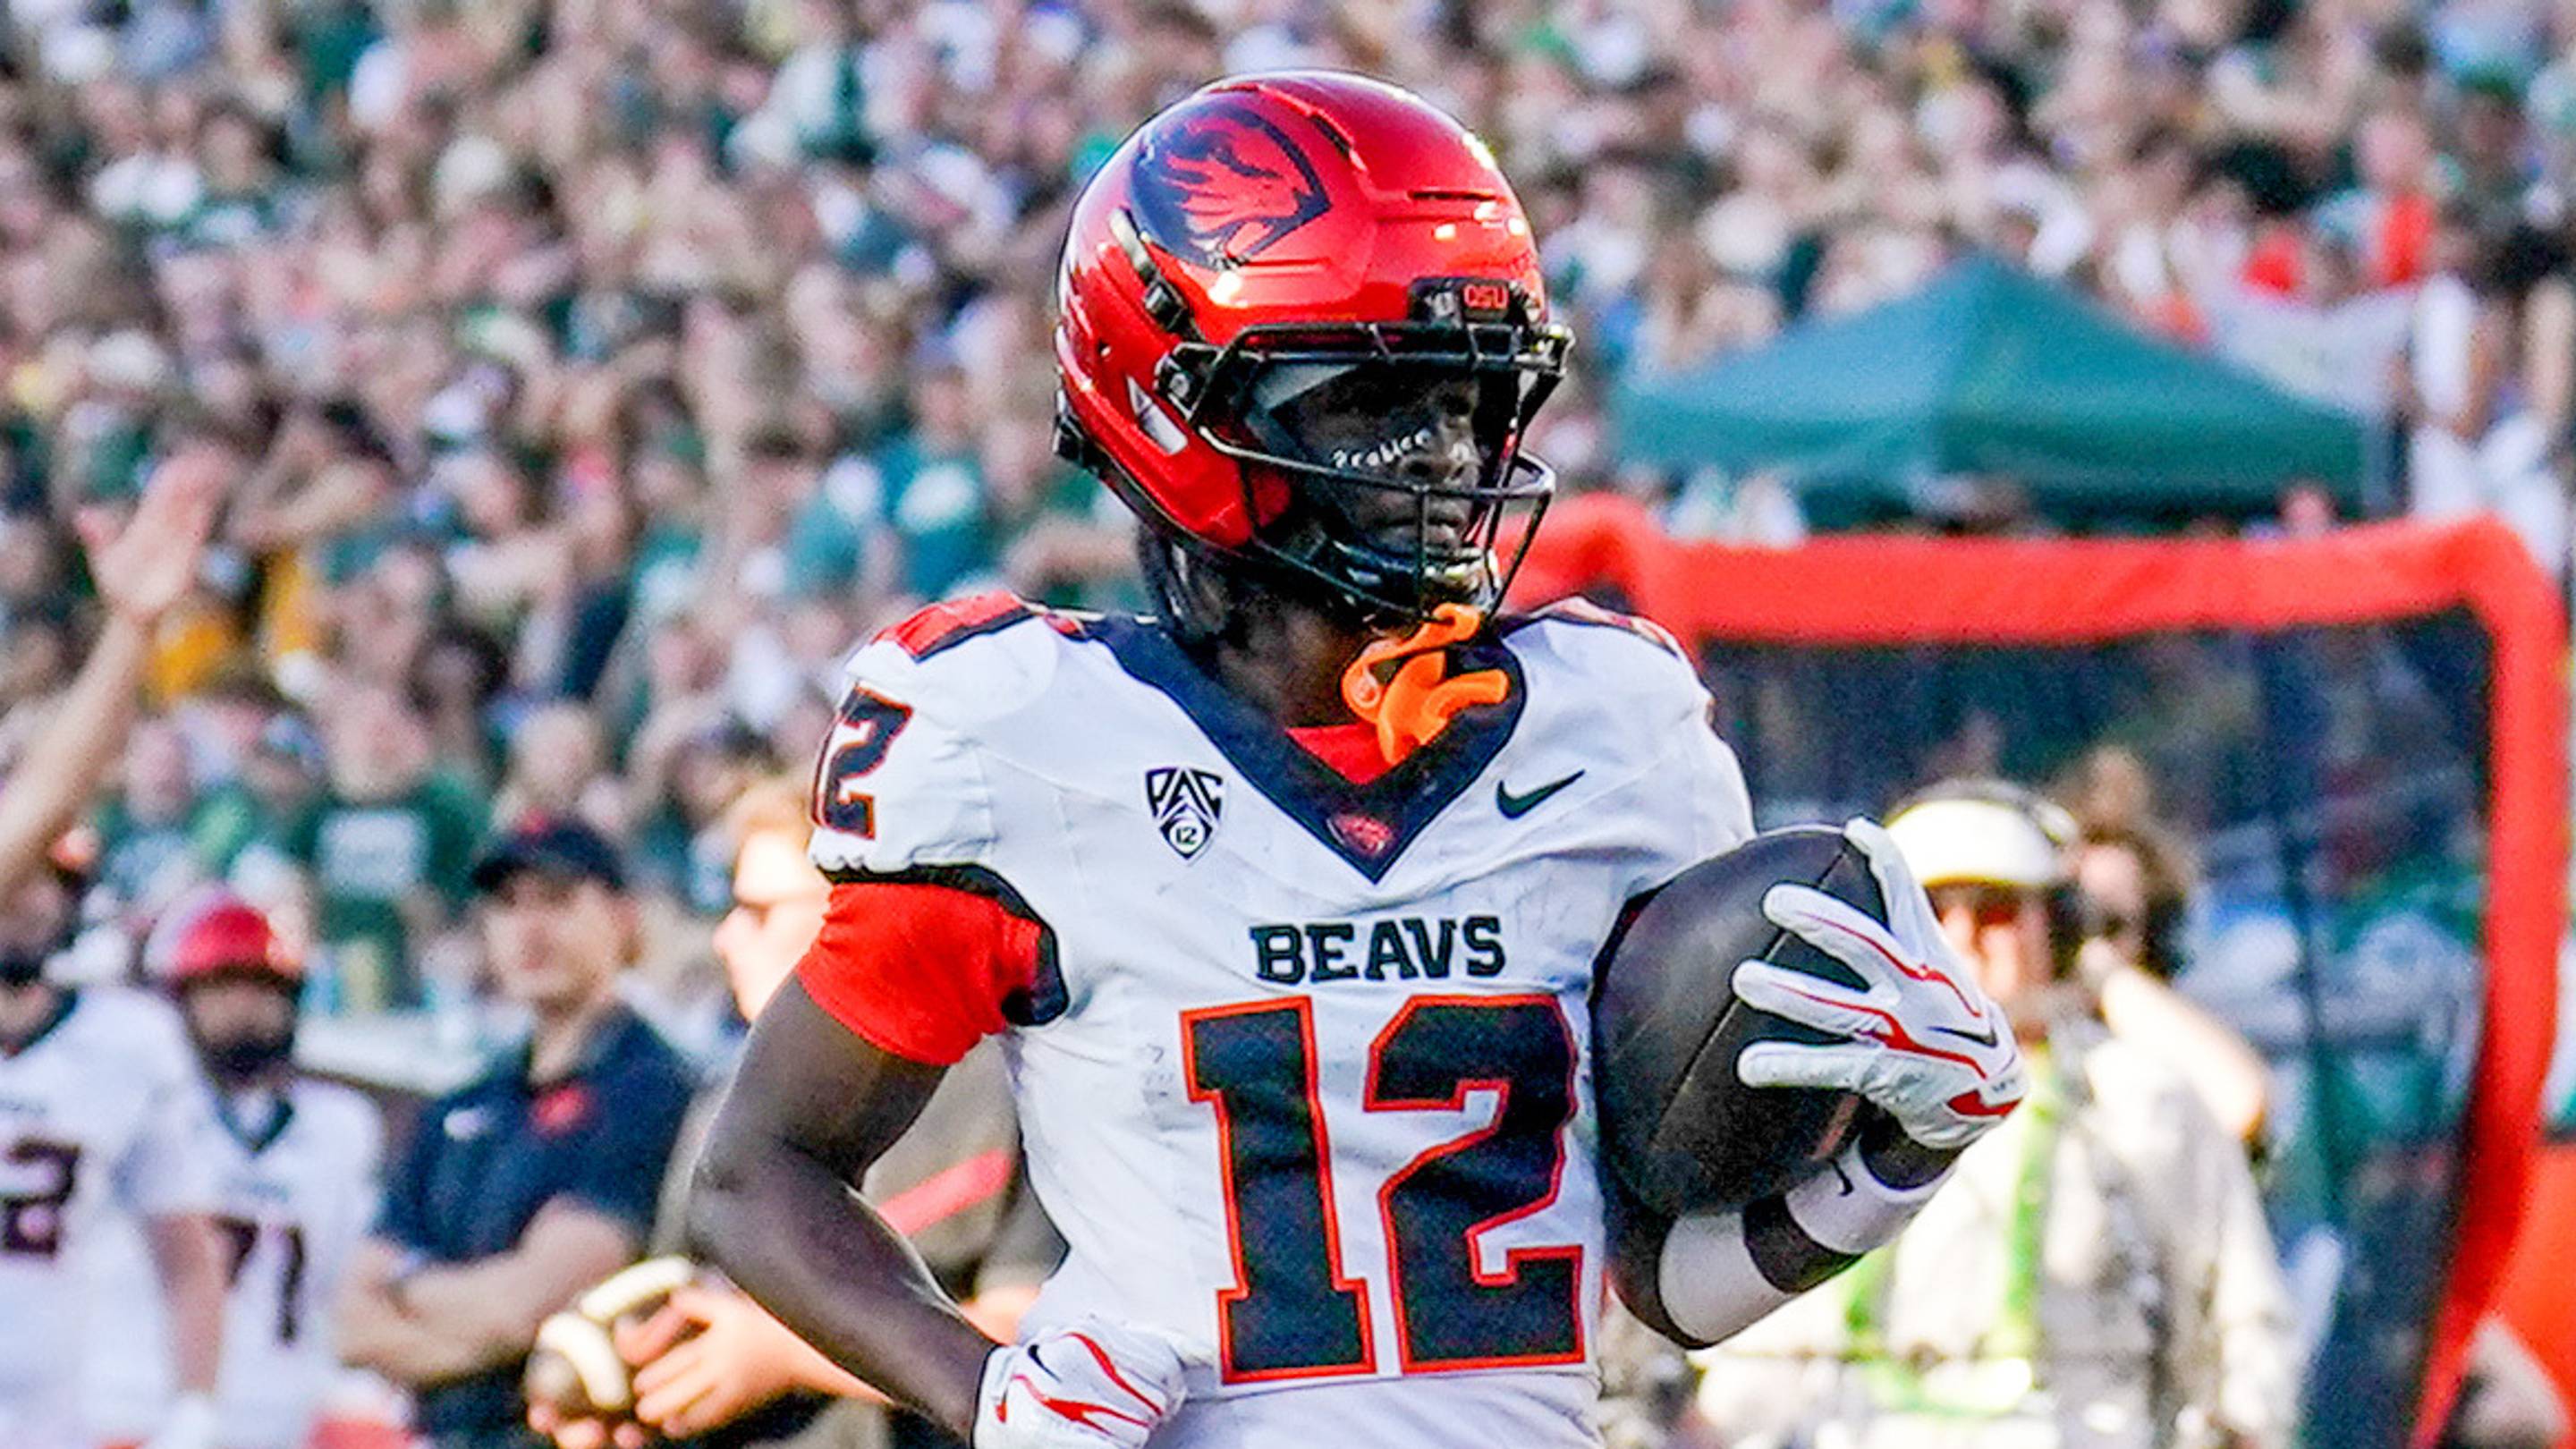
Freshman Phenom Jesse Legree Tops FBS Receiving Charts After Wee…
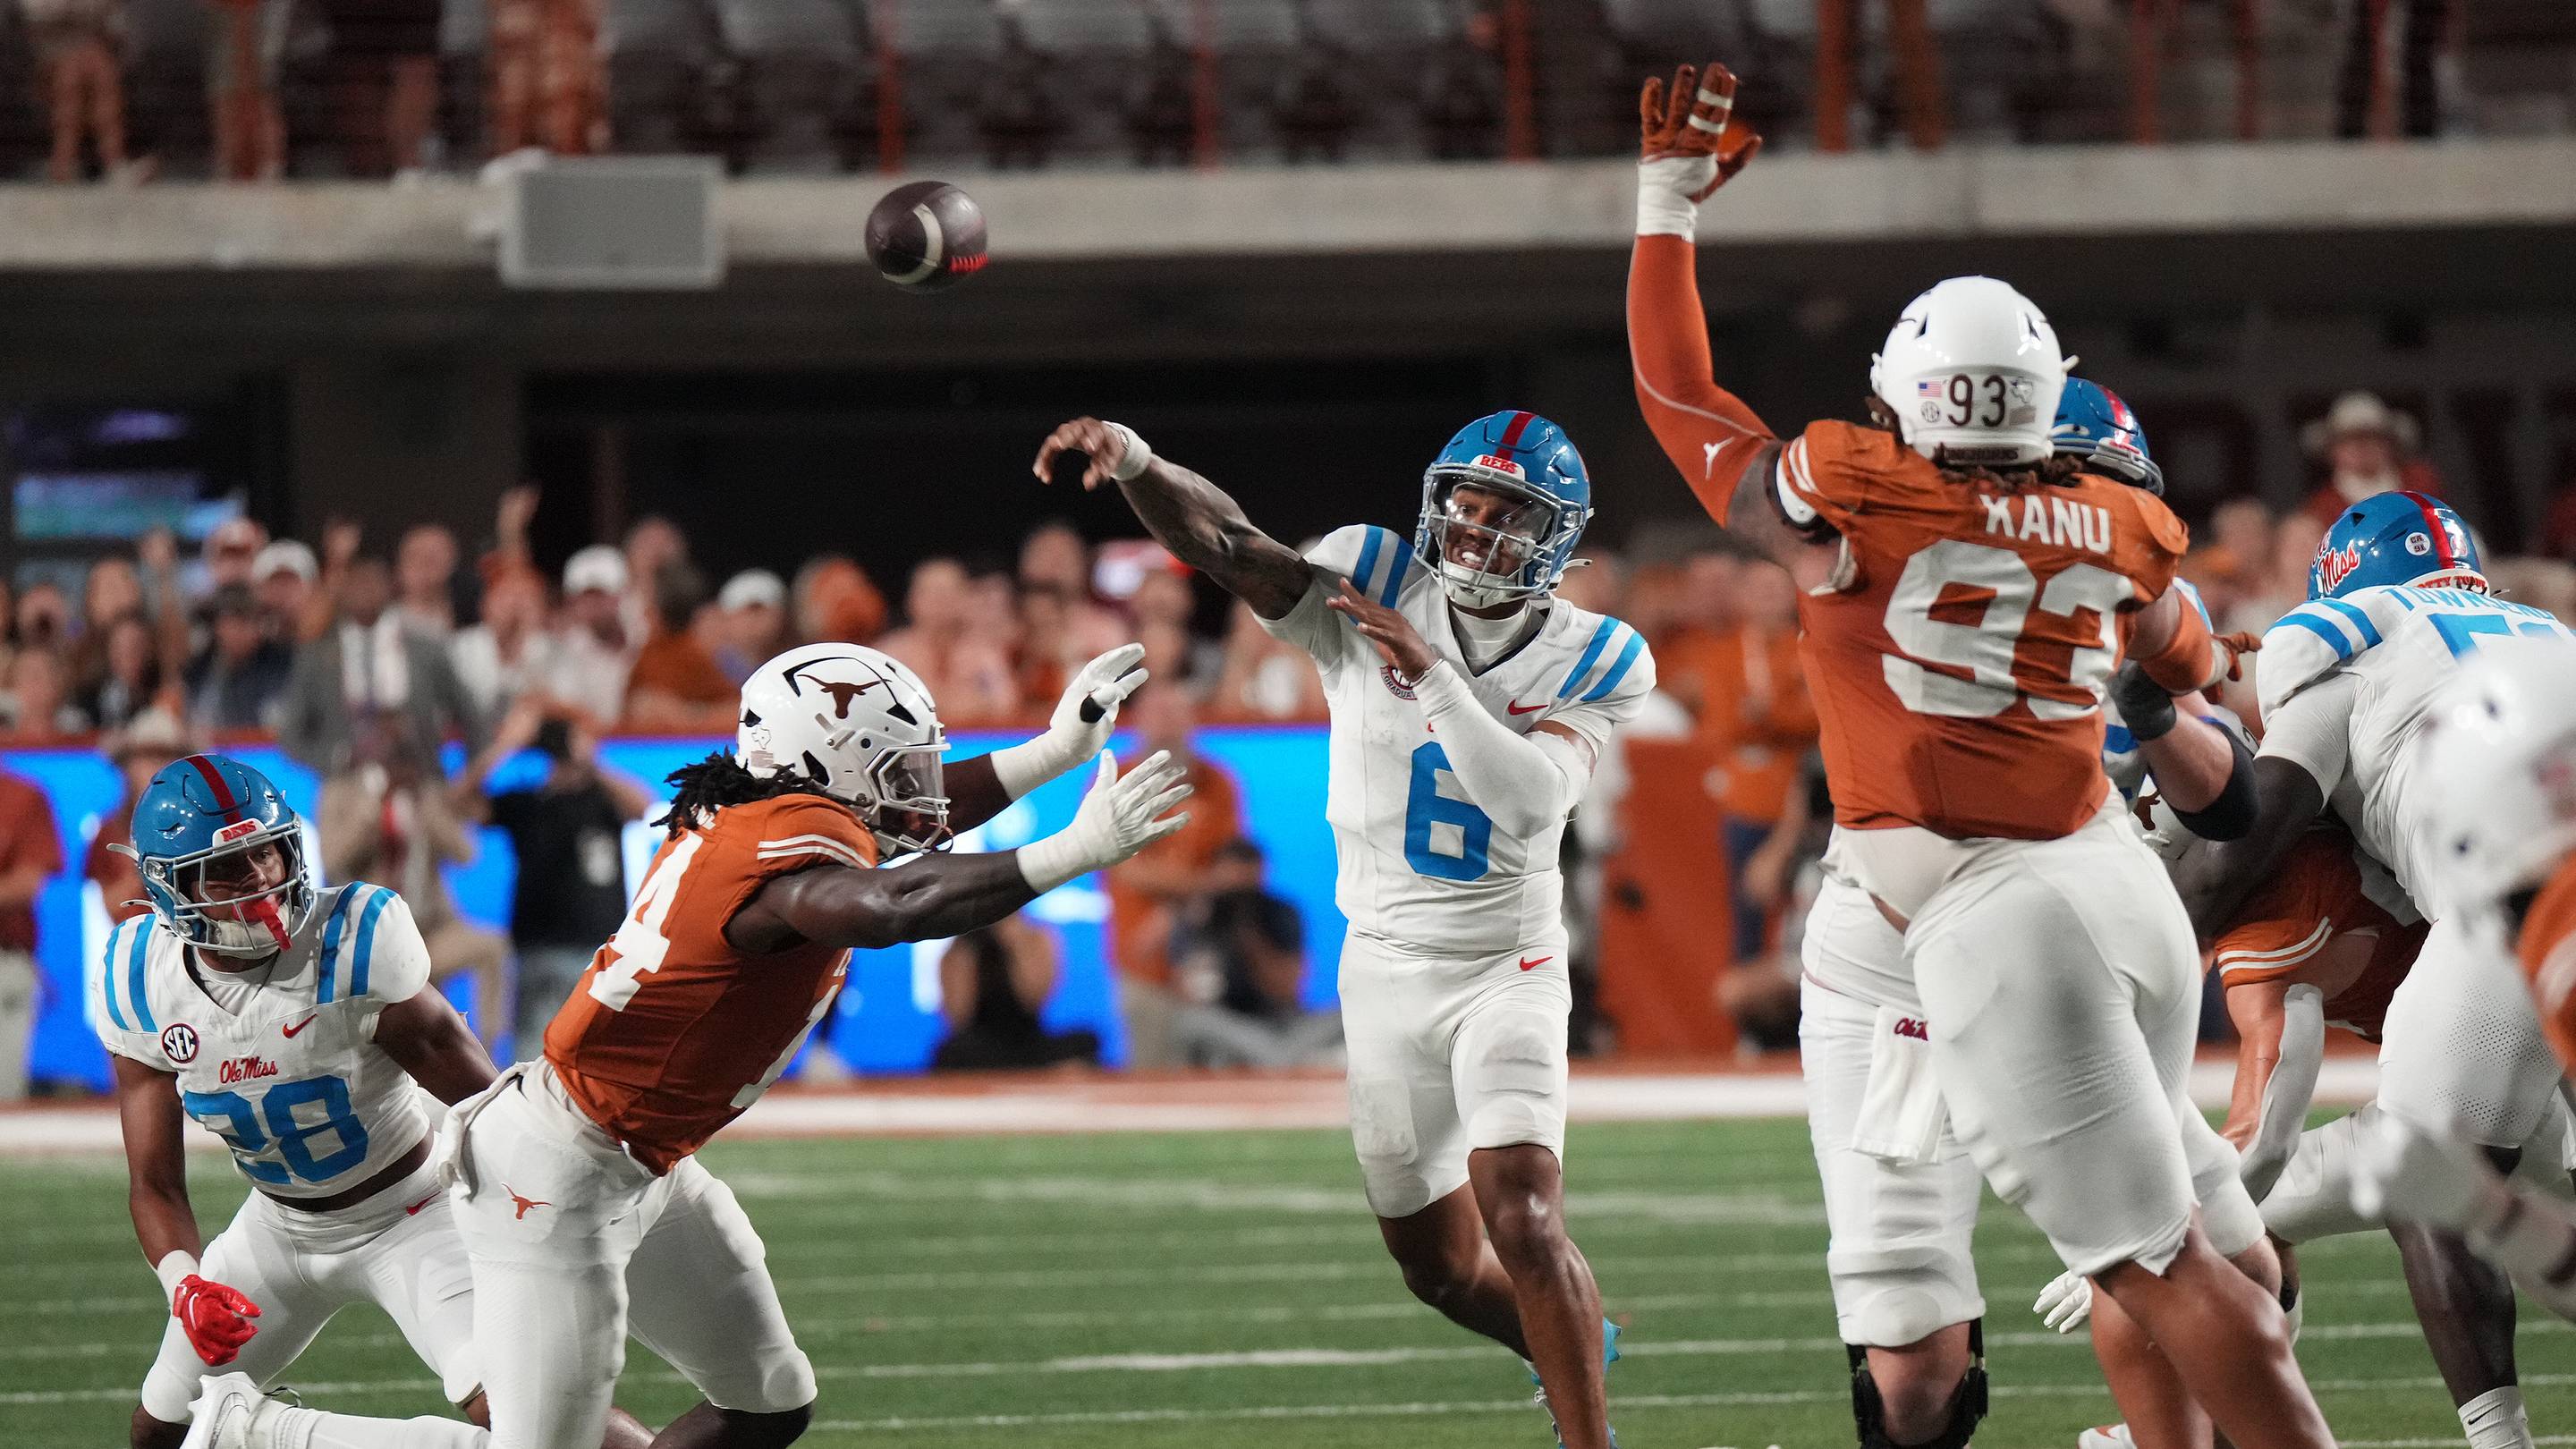
Ole Miss vs. Auburn: Beyond the Scoreboard, Rebels Seek Redempti…