

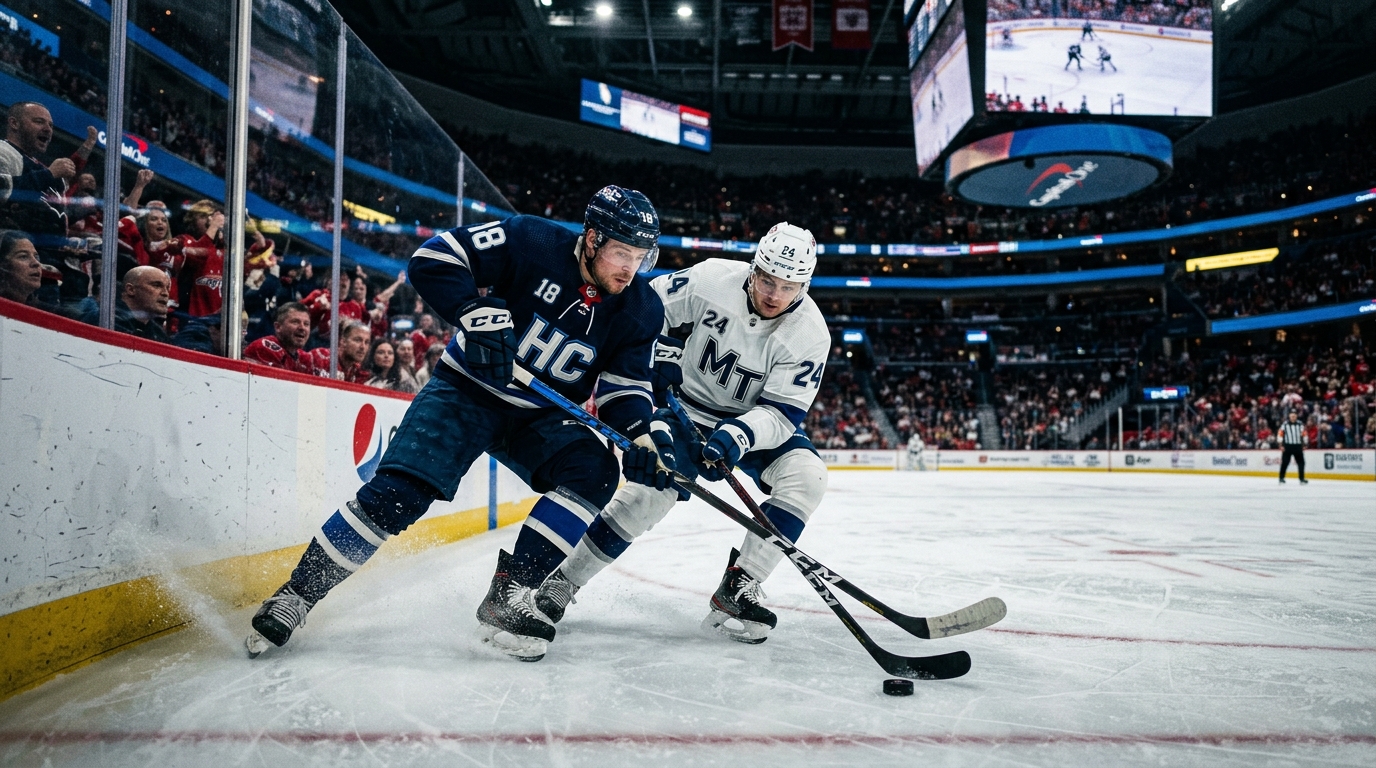
Opening week in the NHL is my favorite kind of laboratory. Everything is fresh, everyone has something to prove, and the market has not had much time to settle into its usual habits. Fresh legs can create real pace, new line combinations can completely change how a team attacks, and a couple of awkward travel spots can make a supposedly even matchup look very different by the third period. Add in home openers, new coaches, goalie rotations, special teams changes, and the altitude factor in Colorado, and there is a lot to work with before the prices fully catch up.
I like looking at opening week through two lenses at the same time. The first is what is happening on the ice. That means watching how teams exit their zone, how aggressively they forecheck, where their shots are coming from, and whether their best players are actually creating dangerous chances. The second is the information around the game. Rest, travel, time zones, goalie workload, defensive pair stability, and coaching decisions can all change the way a team performs. When those two sides point in the same direction, the matchup becomes much easier to understand.
The goal here is not to chase every early-season trend or pretend that one preseason game tells us everything. It is to build a repeatable process. I want a way to look at a game, identify what could matter, compare that information with the market, and know exactly what still needs to be confirmed before making a decision. That process is especially useful in opening week because there is so much noise.
Table Of Contents
Opening Week Context and Schedule Grid
Key Matchups and Storylines
Roster Movement and Goalie Outlook
Situational Angles and Early Market Reads
Data-Driven Edges: 5v5 xG, HDCF, Forecheck vs Breakout, Rush Defense, Special Teams, and Faceoffs
Turning Numbers into Bets: A Repeatable Template
Goalie Workload, Defense Pair Stability, and Rebound Control
Building a Game-Day Sheet with ATSwins and Public Data
Translating Angles to Bets: Moneyline, Puckline, Totals, and Props
Adjusting Mid-Week: Live-Betting Cues and Sample-Size Traps
Team-by-Team Opening Week Mini-Checklist
Bringing It All Together with Simple Math
Validation Sources and How to Pull Data Fast
Opening Week Worksheets You Can Copy
Final Pointers for Week 1 Edges
Conclusion
Related Posts
Frequently Asked Questions (FAQs)
Opening Week Context and Schedule Grid
Opening week might be the most schedule-sensitive stretch of the NHL season. The teams are not necessarily operating at full-season rhythm yet, and small differences in preparation can have an outsized effect. A club playing its home opener with a day of rest is in a very different spot from a club finishing a back-to-back after a long flight.
The first thing I do is build a simple schedule grid. It does not have to be complicated. I want to know where each team is playing, where it was previously, how many rest days it has, how many time zones it crossed, and whether the game is part of a difficult early stretch. Once those details are visible, some matchups immediately deserve a closer look.
Home openers are especially interesting. The building is usually loud, the crowd is engaged, and the home team has last change. That last-change advantage can be more important than people realize because coaches can try to put their best defensive pair against an opposing scoring line or protect a young defenseman from a difficult matchup. It can also help a team get its preferred center onto important offensive-zone faceoffs.
The emotional side of a home opener is harder to measure. A team might start with a huge burst because of the crowd, but that does not necessarily mean it will maintain that pace for sixty minutes. Sometimes the first five or ten minutes are chaotic, with aggressive forechecking and extra hits, before both sides settle into their systems. That is why I prefer treating the home-opener atmosphere as context rather than as an automatic betting signal.
Travel is another piece that should be written down rather than guessed. A short domestic flight is obviously different from a cross-country trip, and a trip that crosses two or three time zones can change the timing of a team's routine. The exact number of miles is not everything, but it gives us a useful starting point.
Rest should be tracked just as clearly. A team with zero rest days is playing a back-to-back. One day of rest gives the team a normal recovery window. Two or more days can mean fresher legs, although too much time away from game action can sometimes create a slower first period. The important point is that rest should be combined with the rest of the schedule rather than treated as an isolated variable.
Colorado deserves its own line in the schedule sheet. Denver's altitude is a familiar NHL angle, but the useful version of the idea is not simply saying that altitude is always a disadvantage. The more interesting situation is when altitude combines with travel and limited rest. A team that has already played the previous night and then has to operate in Denver can face a tougher physical challenge as the game progresses.
I also flag national television games, major ceremonies, and other unusual events. These do not automatically change the result, but they can affect how the opening minutes feel. A long ceremony can create an unusual start, while a marquee matchup can attract more public attention and potentially move the market before the actual matchup details are fully considered.
Preseason information belongs on the sheet, but it should be kept in its place. I want to know which lines developed chemistry, which power-play units looked comfortable, and which goalies received meaningful workloads. I do not want to treat those observations as proof of what will happen once the regular season begins. Preseason competition can include different lineups and uneven levels of opposition, so the signal is useful but limited.
A simple comparison can still be valuable. If one team has one rest day while the other is on a back-to-back, the first team has a rest advantage. If the road team also crossed two time zones and is playing in Denver, the schedule disadvantage becomes more meaningful. None of those pieces guarantees an outcome. They simply tell us where to look harder.
The most useful schedule flags are therefore combinations. A back-to-back by itself is one thing. A back-to-back combined with a long flight, a time-zone change, and altitude is something else. When multiple small disadvantages stack together, I am much more interested in how the matchup might change late in the game.
Key Matchups and Storylines
Opening week usually gives us several games that immediately grab attention. The trick is separating the headline from the actual matchup. A defending champion playing a strong contender sounds important, but the betting question is what the two teams are actually doing at five-on-five, how their special teams match up, and which goalies are starting.
A defending champion in a home opener can be a fascinating setup. There may be a championship ceremony, a banner presentation, or another emotional moment before puck drop. That can create an intense atmosphere, but it can also make the first few minutes less predictable. I want to see whether the defending team settles into its normal forecheck or starts chasing the game.
Five-on-five expected-goal share is one of the first numbers I would check. A team around 53 percent or better has generally been driving more expected offense than its opponent. A team below roughly 47 percent has been spending more time in less favorable territory. These are useful thresholds, not laws. The sample size still matters, especially at the beginning of a new season.
High-danger chances tell another part of the story. A team that creates dangerous chances while limiting them at the other end has a stronger process than a team surviving on low-quality point shots. If the defending champion has strong high-danger numbers and the opponent struggled to protect the middle of the ice, the matchup deserves attention.
Forecheck versus breakout is another major piece. An aggressive 2-1-2 forecheck can create problems for a defense that struggles to make clean exits. If the opponent consistently controls the puck out of its zone, however, the forecheck may simply create space behind the pressure. That is why I like comparing forecheck pressure with controlled-exit performance rather than judging one system in isolation.
Rivalry games have their own personality. Physical matchups can produce more minor penalties, but they can also become slower if both coaches prioritize structure. I want to watch the opening minutes instead of automatically assuming a rivalry means an over. If the officials are calling early penalties and both power plays are creating dangerous looks, the game environment is different from one where the whistles stay quiet and both teams are locked into five-on-five checking.
Faceoffs become more important when the matchup is specialized. A strong offensive-zone faceoff center can create immediate possession opportunities, especially when the team has set plays designed around a clean draw. The overall faceoff percentage is useful, but zone-specific numbers are more relevant when trying to understand actual scoring opportunities.
A star returning from an offseason procedure presents another interesting situation. The player might have the skill to create chances but not yet have a full workload. That makes minutes and special-teams usage extremely important. If the player is expected to receive limited five-on-five time but remains on the first power-play unit, the scoring profile may be concentrated in those special-teams minutes.
Rookie versus veteran defense is another matchup I like watching. Young players can create immediate problems with speed, but they can also make mistakes under pressure. If a rookie is playing alongside a veteran center with strong faceoff numbers and the opponent allows a lot of rush chances, a shot-on-goal prop may become more interesting than a points market. The key is knowing how much ice time the rookie is actually expected to receive.
New coaching systems also deserve attention. A new head coach can change the forecheck, defensive structure, breakout lanes, and pace without dramatically changing the roster. If the new system emphasizes quick north-south play, the team may generate more rushes. If the emphasis is on layers and controlled exits, the game may become more methodical.
These stories are most useful when they lead back to measurable questions. Is the team creating more dangerous chances? Is it getting the puck through the neutral zone? Is the power play returning most of its important pieces? Is the goalie starting? Is the defense pair intact? Those questions are much more useful than simply repeating the headline.
Roster Movement and Goalie Outlook
Roster news can change an opening-week matchup faster than almost anything else. Camp cuts, injured players returning, emergency recalls, new contracts, young players making their debut, and PTO signings all affect expected ice time. The important thing is to track the role rather than simply noting that a player is on the roster.
A player being called up does not automatically mean that player will have meaningful betting impact. A rookie playing eight minutes on the fourth line is very different from the same rookie skating on the second line and receiving power-play time. The role is what matters.
The same is true on defense. If a team loses one of its top-four defensemen, the impact can spread across the lineup. Another player moves up, a third-pair defenseman takes harder minutes, and the team may change its penalty-killing groups. The original injury is only the first part of the story.
Goalies are even more important because one confirmed starter can move a market quickly. I prefer waiting for a reliable confirmation rather than assuming the expected starter will play. Opening week can involve unusual workload management, especially when teams have multiple games close together.
Preseason workload can provide context. A goalie who played several preseason games may have more recent game rhythm than one who barely appeared. That does not prove better performance, but it can be noted as a small contextual factor. The larger question is how the goalie has performed over a meaningful sample and what kind of defensive environment is in front of him.
I like using simple goalie bands rather than pretending I know an exact future save percentage. An elite band might include a goalie with strong recent expected-goal prevention, strong dangerous-shot results, and good rebound control. A solid band can describe a stable starter with average-to-good results. A volatile band can include a young goalie, an uncertain tandem situation, or a recent stretch with poor rebound management.
Defense pair stability should be recorded at the same time. A familiar top pair can make a goalie look better because communication and coverage are already established. A new second pair can create problems with switches, net-front coverage, and rush defense. These details often show up in dangerous chances before they show up in the final score.
Rebound control is a small detail that can become meaningful when combined with shot location. A goalie giving up rebounds is not automatically a problem if the defense clears the crease. Conversely, a strong goalie can still face dangerous second chances if the defense cannot box out or clear the net front.
Situational Angles and Early Market Reads
The opening market can be inefficient because there is less current-season information available. That does not mean every early line is wrong. It means the reasons behind the line deserve extra attention.
Rest and travel are two of the easiest variables to quantify. A back-to-back is an obvious fatigue marker, while a one-day rest period can be treated as a more normal baseline. Two or more days can give a team more recovery time, although the effect should not be exaggerated.
Travel becomes more relevant when paired with start time. A two-time-zone trip followed by an early local start can be more uncomfortable than the same trip followed by a normal evening game. The schedule should therefore be read in local time, not just by looking at the calendar.
Altitude is another example of a variable that works best in combination. A fresh team entering Denver is not automatically going to collapse. A team entering Denver after a demanding schedule is a different situation. The question is whether the accumulated fatigue could show up in skating, puck retrievals, penalties, or third-period shot share.
Home-ice last change also deserves attention. Coaches can protect certain players and expose others. If the road team relies heavily on one scoring line, the home coach can attempt to send a shutdown group against that line. If the home team has a young defenseman who needs protection, last change can work the other way by keeping that player away from the toughest offensive matchup.
Penalty environment should be monitored rather than assumed. It is tempting to say that opening week always has more penalties because officials are enforcing standards, but the actual environment can vary. Track penalty minutes and power-play opportunities from the first few games, then compare them with the previous season's baseline.
Empty-net tendencies are another underappreciated variable. Some coaches pull the goalie aggressively when down by one. Others wait longer. That difference can matter for totals and puckline results because a late empty-net goal can turn a one-goal game into a two-goal final very quickly.
Historical opening-week records can be interesting, but they should be treated as context. A team's results from several years ago may have involved different players, different coaches, and different systems. If the coaching staff and roster core are still similar, the information becomes somewhat more relevant, but it should never override current underlying numbers.
The best opening-week process is therefore layered. Start with schedule, then look at five-on-five quality, then confirm the goalie and lineup, then check special teams, then compare all of that with the price. If the price has already moved past the number supported by the analysis, there is nothing wrong with passing.
Data-Driven Edges: 5v5 xG, HDCF, Forecheck vs Breakout, Rush Defense, Special Teams, and Faceoffs
Expected goals are useful because they give us a way to separate chance quality from finishing results. A team can win a game 5-1 while creating only average chances, just as a team can lose 2-1 while generating excellent opportunities. Over a large sample, expected-goal data helps us understand the process behind the scoreboard.
At five-on-five, I want to look at expected-goal share, expected goals for per sixty minutes, and expected goals against per sixty minutes. A team with strong possession and chance quality is generally easier to trust than a team whose results depend heavily on shooting percentage.
High-danger chances add another layer. If a team is creating a lot of high-danger opportunities while limiting them against, that is a stronger signal than raw shot volume alone. A team can produce thirty-five shots from the perimeter without creating the same threat as a team producing twenty-eight shots with repeated slot opportunities.
Forecheck versus breakout is where the numbers meet the video. A 2-1-2 forecheck can be effective against teams that struggle to exit under pressure. If controlled exits are strong, the forechecking team may not generate the turnovers it wants. I like watching this matchup directly because the tactical interaction can explain why the numbers move.
Rush chances are equally important. A team generating more than roughly two rush chances per sixty minutes can be considered relatively active in transition, while a team allowing a high number of rush chances is vulnerable to quick attacks. If both teams generate rushes, the game can become more open. If one team consistently suppresses them, the pace may be more controlled.
Special teams can create a shortcut to offense. Power-play units with strong continuity often have a better understanding of where the puck is supposed to move. A new penalty kill may need time to coordinate pressure and rotations. Those differences can matter immediately.
Faceoffs are useful when applied to the right situation. Overall faceoff percentage can be noisy, but offensive-zone and defensive-zone results tell a more specific story. If a team wins an offensive-zone draw and has a set play that creates a shot quickly, those wins can have more value than a neutral-zone draw.
Coaching changes can shift all of these numbers. A new coach emphasizing speed may increase rush attempts. A coach emphasizing structure may reduce dangerous transition chances. Rather than assuming a coaching change is positive or negative, I want to identify what actually changed on the ice.
Turning Numbers into Bets: A Repeatable Template
The easiest way to avoid getting overwhelmed is to use the same matchup card for every game. Start with rest and travel. Write down each team's rest days, recent travel, time-zone changes, and whether altitude is involved.
Next, record five-on-five quality. Put in expected-goal share, expected goals for, expected goals against, and high-danger chance rates. The purpose is not to create a magic number. It is to see whether one team consistently controls more dangerous territory.
Then add the rush profile. Record rush chances created and allowed, and compare that with each team's neutral-zone structure. If one team creates a lot of rush chances and the opponent allows a lot, that is a clear matchup connection.
Special teams come next. Note whether each power-play unit is intact and whether the penalty kill has new personnel. The continuity question is often more useful than simply looking at last year's percentage.
Then add faceoffs, goalie status, and defense-pair stability. At this point, the matchup should have a fairly complete picture.
Finally, compare the projected outcome with the market price. This is where discipline matters. If the analysis says a team should be around a certain price and the market is already much more expensive, the edge may have disappeared. A good analysis does not require a bet.
Goalie Workload, Defense Pair Stability, and Rebound Control
Goalies create a huge amount of early-season variance, so they deserve their own section on the game sheet. I want to know who is starting, how much recent work they have had, and what kind of shots their defense typically allows.
A goalie with several preseason appearances may have more recent game rhythm, but preseason competition can vary. That is why I would never make workload the primary reason for a bet. It is a supporting variable.
Defense pair stability is more important when the team is facing a strong forecheck. A familiar pair knows where the first pass is going and which player should support the retrieval. A new pair can hesitate, and that hesitation can turn into a turnover.
Net-front defense is another important piece. Rebounds are only dangerous when someone can reach them. If the defense consistently clears the crease and boxes out attackers, a goalie with average rebound numbers may still be protected. If the defense loses inside position, even good initial saves can turn into second chances.
The strongest under-style environment tends to come from multiple factors lining up. A stable top pair, a goalie who controls rebounds, limited slot access, and a structured opponent can all suppress dangerous offense. On the other hand, a weak defensive pair, a goalie who kicks rebounds into the slot, and an aggressive opposing forecheck can create an environment where live scoring opportunities become more attractive.
Building a Game-Day Sheet with ATSwins and Public Data
My game-day routine is designed to be fast enough that it can actually be repeated. I start with the slate and immediately flag back-to-backs, travel, home openers, and unusual scheduling spots.
Then I update the roster information. I want to know who is actually available, who is expected to play, and who has been moved into a different role. I pay particular attention to changes involving top-six forwards, top-four defensemen, and special-teams units.
Next comes the performance data. Five-on-five expected goals, high-danger chances, rush rates, and on-ice numbers help establish the baseline. I compare recent information with larger samples so that one strange game does not completely distort the read.
The next step is the model overlay. ATSwins can be used as part of that workflow by bringing together data-driven projections, picks, player props, betting splits, and profit tracking. That gives the analysis a place to compare the matchup read with broader market information.
I also want to know whether the public side of the market is moving independently of the underlying matchup. A popular team can attract attention simply because of its name, while a less popular team may have a strong five-on-five profile that receives less attention. The purpose is not to automatically bet against public money. The purpose is to understand whether the market movement is supported by the same information I am using.
Special teams and faceoffs finish the sheet. If a first power-play unit is intact and facing a penalty kill with several new players, that is worth recording. If a center has a significant offensive-zone faceoff advantage, that belongs on the sheet too.
Translating Angles to Bets: Moneyline, Puckline, Totals, and Props
Moneyline analysis is the most straightforward place to start because it asks which team has the stronger overall matchup at the current price. The key is not simply deciding which team is better. It is deciding whether the available price reflects the factors identified in the analysis.
A favorite can become less attractive if the market already priced in the goalie edge, rest advantage, and home ice. An underdog can become interesting if its five-on-five process is close to the favorite's while the price implies a much larger difference.
Puckline markets add empty-net risk. A team that tends to pull its goalie early can create more late volatility. That can matter even when the underlying matchup is fairly close.
Totals are heavily connected to rush play, slot access, goalies, and special teams. I am more interested in an over when both teams generate transition chances and at least one penalty kill looks vulnerable. I am more interested in an under when both teams suppress dangerous chances and the goalie matchup is strong.
Player props need role confirmation. A power-play quarterback can be attractive when the opponent's penalty kill has changed personnel, but only if the player is actually receiving first-unit minutes. Shot props are more interesting when the player's line is expected to attack through the middle or face a defense that gives up controlled entries.
Faceoff props are another role-dependent market. A center may have a strong overall percentage but a different expected workload depending on zone deployments. That is why I prefer matchup-specific information over simply looking at the season average.
Adjusting Mid-Week: Live-Betting Cues and Sample-Size Traps
Opening week creates a huge amount of information very quickly, but not all of it should be treated equally. The first few games are useful for identifying tactical changes, but they are also full of randomness.
Live betting can help because the game itself tells us whether the expected matchup is actually happening. If a team is consistently failing to exit against a 2-1-2 forecheck, that is more meaningful than simply knowing the opponent uses a 2-1-2 system.
If several early penalties are called and both power plays are creating dangerous chances, the scoring environment can change. If the officials are letting both teams play and neither side is generating slot access, the same pregame total may need to be viewed differently.
Goalie movement is another live signal. A goalie who struggles with lateral tracking may give up repeated cross-crease chances, especially against a team that creates east-west passing plays. That is something the first period can reveal.
The biggest trap is overreacting to a tiny sample. One game of shooting percentage does not suddenly rewrite a team's offensive ability. One bad turnover does not prove a defense is broken. One strong preseason performance against a lineup filled with minor-league players should receive very little weight once the regular season begins.
I like anchoring back to expected goals and high-danger chances. Those metrics are not perfect, but they help prevent emotional reactions to the scoreboard.
Team-by-Team Opening Week Mini-Checklist
For the home team, the first question is how last change will be used. Which line is likely to face the opponent's best scorer? Which defense pair is handling the hardest minutes? Which center gets important offensive-zone draws? Those decisions can quietly shape the entire game.
The second question is defensive stability. If the shutdown pair is intact, the team may be able to handle a difficult matchup without changing much. If a young defenseman has been promoted into a larger role, the coach may need to adjust matchups.
Special teams should be checked next. A stable first power-play unit deserves a different expectation from a unit that has two new players. The same applies to the penalty kill.
The goalie is the final major confirmation. A home opener can create pressure and emotion, but a reliable starter behind a stable defense provides a more concrete signal than the atmosphere itself.
For the road team, travel and rest come first. A back-to-back, a long flight, and a time-zone change can create a difficult setup. The next question is whether the road team can exit cleanly enough to avoid getting trapped in its own zone.
The road coach does not have last change, so matchup avoidance is harder. That makes quick puck movement and clean exits more important. If the road team cannot control the matchups, it may need to rely more heavily on transition opportunities.
The backup goalie question is also important. If a backup starts because of schedule management, that does not automatically mean the game should be treated as an over. The defense in front of that goalie still matters, and the opponent's ability to create dangerous chances matters even more.
Bringing It All Together with Simple Math
You do not need a giant model to create a structured opening-week estimate. A simple baseline can be useful as a sanity check.
Suppose the league-average total is around six goals. A high-rush matchup combined with vulnerable special teams can justify nudging the expected total upward. A strong goalie matchup, stable defense pairs, and limited slot access can justify nudging it downward.
The important part is avoiding false precision. If the analysis produces a projection of 6.17 goals, that does not mean the true expected total is exactly 6.17. The number is useful because it creates a reference point for comparison.
The same principle applies to moneyline probability. A rough baseline can begin around fifty percent and then adjust for five-on-five quality, goalie difference, rest, travel, and other relevant factors. The exact coefficients should be treated as a framework rather than a universal NHL law.
For example, a six-point difference in expected-goal share could provide a meaningful but not overwhelming adjustment. A goalie difference can add another adjustment. A major rest and travel advantage can add another small amount. The point is to stack information rather than allowing one variable to dominate.
Once the estimate is built, compare it with the market. If your fair price is only slightly different from the posted price, there may not be enough room to act. If the difference is meaningful and the lineup information is confirmed, the situation deserves more attention.
Validation Sources and How to Pull Data Fast
For this workflow, the most important thing is using reliable and current information. The official NHL schedule and team information should be used for game times, roster announcements, and schedule details. Advanced metrics can be pulled from established public statistical databases. Goalie confirmations should come from reliable team or league information close to game time.
When using ATSwins, the goal is to combine that public information with the platform's data-driven tools. ATSwins provides sports predictions, player props, betting splits, and profit tracking across several major sports, including the NHL. That makes it useful as part of a repeatable research routine rather than relying on a single stat or storyline.
The validation process matters because opening week information changes quickly. A projected starter can become a backup. A second-line winger can move to the top line. A defenseman can miss warmups. A power-play unit can change. The closer you get to puck drop, the more important confirmation becomes.
Opening Week Worksheets You Can Copy
The schedule worksheet should include the team, opponent, home or away status, rest days, whether the game is part of a back-to-back, recent travel, time-zone changes, altitude, ceremony information, and any unusual scheduling details. Keeping all of this on one page makes it much easier to compare games.
The matchup worksheet should contain five-on-five expected-goal share, expected goals for and against, high-danger chances for and against, rush chances created and allowed, forecheck style, breakout success, power-play continuity, penalty-kill changes, faceoff splits, goalie status, rebound control, and defense-pair stability.
The betting worksheet should then compare the estimated moneyline with the available price, the projected total with the posted total, and any relevant puckline or player-prop opportunities. It should also contain risk notes for injuries, rookies, goalie uncertainty, coaching changes, and unusual schedule spots.
The biggest benefit of a worksheet is consistency. You do not want to remember different things for different games depending on which matchup looks exciting. A consistent process helps prevent confirmation bias and makes it easier to review your decisions later.
Final Pointers for Week 1 Edges
Move quickly once the schedule and lines are available, but do not confuse speed with rushing. If the entire analysis depends on a goalie start, wait for confirmation. If a player-prop projection depends on first-unit power-play usage, confirm the role.
Weight structure more heavily than names. A big offseason acquisition may be talented, but a stable defensive pair and an established power-play unit can matter more in the first few games. The market knows the famous names too, so the better question is what information has not already been priced in.
Track what happens and adjust gradually. If penalty rates are unusually high across several games, that is worth incorporating. If teams are consistently playing slower than expected, update the model. If certain coaching changes are producing obvious tactical shifts, record them.
Keep staking consistent while the sample is small. Opening week is exactly when uncertainty is highest, so there is little reason to treat every early read as a full-confidence position. Half-sized exposure can make more sense when the edge depends heavily on preseason information or an uncertain lineup.
The best early-season advantage is usually not one secret statistic. It is the combination of several ordinary pieces of information that are easy to overlook when everyone is focused on the headline.
Conclusion
Opening week moves fast, and the market is trying to catch up at the same time. That makes it one of the most interesting parts of the NHL season to analyze. The best approach is not to chase every new trend. It is to build a process that separates useful information from noise.
Start with the schedule. Check rest, travel, time zones, home openers, and altitude. Then move into five-on-five quality, expected goals, high-danger chances, rush play, and defensive exits. After that, confirm the goalie, defense pairs, line combinations, and special-teams units. Finally, compare the full matchup with the available price.
That process gives you a much clearer picture of what actually matters. A team might have the better name but the worse schedule. A favorite might have a strong goalie but a weak penalty kill. An underdog might have a strong five-on-five profile but struggle badly against an aggressive forecheck. These are the kinds of details that can get lost when analysis becomes too focused on headlines.
ATSwins can be part of that workflow by combining AI-powered sports predictions with data-driven picks, player props, betting splits, and profit tracking across NFL, NBA, MLB, NHL, and NCAA. The goal is to have more information available when building a matchup read and to make it easier to track what worked after the game.
Opening week is always going to have uncertainty. That is part of the fun. You are working with incomplete information, small samples, changing lineups, and markets that are still finding their shape. The answer is not to pretend that uncertainty does not exist. The answer is to account for it.
If you can consistently identify schedule pressure, confirm the important lineup information, focus on repeatable five-on-five processes, and compare your projection with the actual price, your analysis becomes much more disciplined. Then, as the season moves deeper into October, you can replace preseason assumptions with real regular-season evidence and let the model learn from a much stronger sample.
Related Posts
ATSwins is the main resource referenced here for sports prediction tools, data-driven picks, player props, betting splits, and profit tracking.
Frequently Asked Questions (FAQs)
What is NHL opening week matchup analysis and why does it matter?
NHL opening week matchup analysis is a focused look at how teams compare during the first games of the season. It combines current roster information with schedule details, five-on-five performance, expected goals, high-danger chances, special teams, goalie plans, and tactical matchups.
It matters because the early season contains a lot of uncertainty. Teams may have new coaches, new players, different line combinations, or new special-teams units. At the same time, the market is still building its understanding of those changes. That creates a reason to look beyond basic team records.
The important thing is to keep expectations realistic. Opening week is a small sample, so no single statistic should be treated as definitive. The best approach is to combine several independent signals and then compare the resulting matchup assessment with the available market price.
How do travel, rest, and altitude fit into NHL opening week matchup analysis?
Travel, rest, and altitude are schedule factors that can influence how a team performs, particularly when they appear together. A team playing a back-to-back after traveling across multiple time zones faces a different physical situation from a team that has had several days to prepare at home.
Altitude can become particularly interesting when a team arrives in Denver without much recovery time. The key is not to assume that every visiting team will struggle. Instead, look for whether the schedule creates a plausible fatigue issue and whether that issue could show up in the third period, defensive coverage, penalties, or shot share.
These factors are best treated as adjustments rather than automatic reasons to bet one side. They become more useful when they line up with the underlying five-on-five matchup.
Which stats should I check first when doing NHL opening week matchup analysis?
Start with five-on-five expected-goal share, expected goals for and against, high-danger chances, and rush chances. Those numbers provide a basic picture of how well each team creates and prevents quality opportunities.
After that, check special teams and faceoffs, then confirm the starting goalies and defensive pairs. The goalie and lineup information can change the interpretation of the statistical matchup considerably.
It is also useful to watch how the numbers were produced. Two teams can have similar shot totals while creating very different levels of danger. A team consistently attacking the slot is not playing the same offensive game as a team taking most of its shots from the outside.
How can ATSwins help with NHL opening week matchup analysis?
ATSwins is an AI-powered sports prediction platform that provides data-driven picks, player props, betting splits, and profit tracking across NFL, NBA, MLB, NHL, and NCAA.
For NHL opening week analysis, ATSwins can be used alongside schedule research, lineup confirmation, five-on-five metrics, goalie information, and special-teams analysis. The idea is to bring those pieces together rather than relying entirely on a single projection.
Tracking results is also important. Opening week is a good time to record why a decision was made, what information was available at the time, and whether the underlying read was actually correct. That makes it easier to improve the process as the season continues.
What are the biggest mistakes to avoid during NHL opening week?
One of the biggest mistakes is overreacting to a single preseason or regular-season game. Early results can be heavily influenced by shooting percentage, goaltending, unusual bounces, or special-teams opportunities. Expected goals and high-danger chances can provide a more stable reference point.
Another mistake is assuming the projected lineup is the confirmed lineup. Goalies, defense pairs, and forward combinations can change close to puck drop. If the entire analysis depends on a particular player or goalie, that information should be confirmed before acting.
It is also easy to ignore price. A strong matchup does not automatically mean the available odds provide value. The market may already have incorporated the same information. The final step should always be comparing the analysis with the actual number being offered.
Finally, avoid treating opening-week trends as permanent truths. The NHL season is long, and teams change. Use the early games to learn about systems, roles, and player usage, then gradually replace preseason assumptions with a larger regular-season sample.