

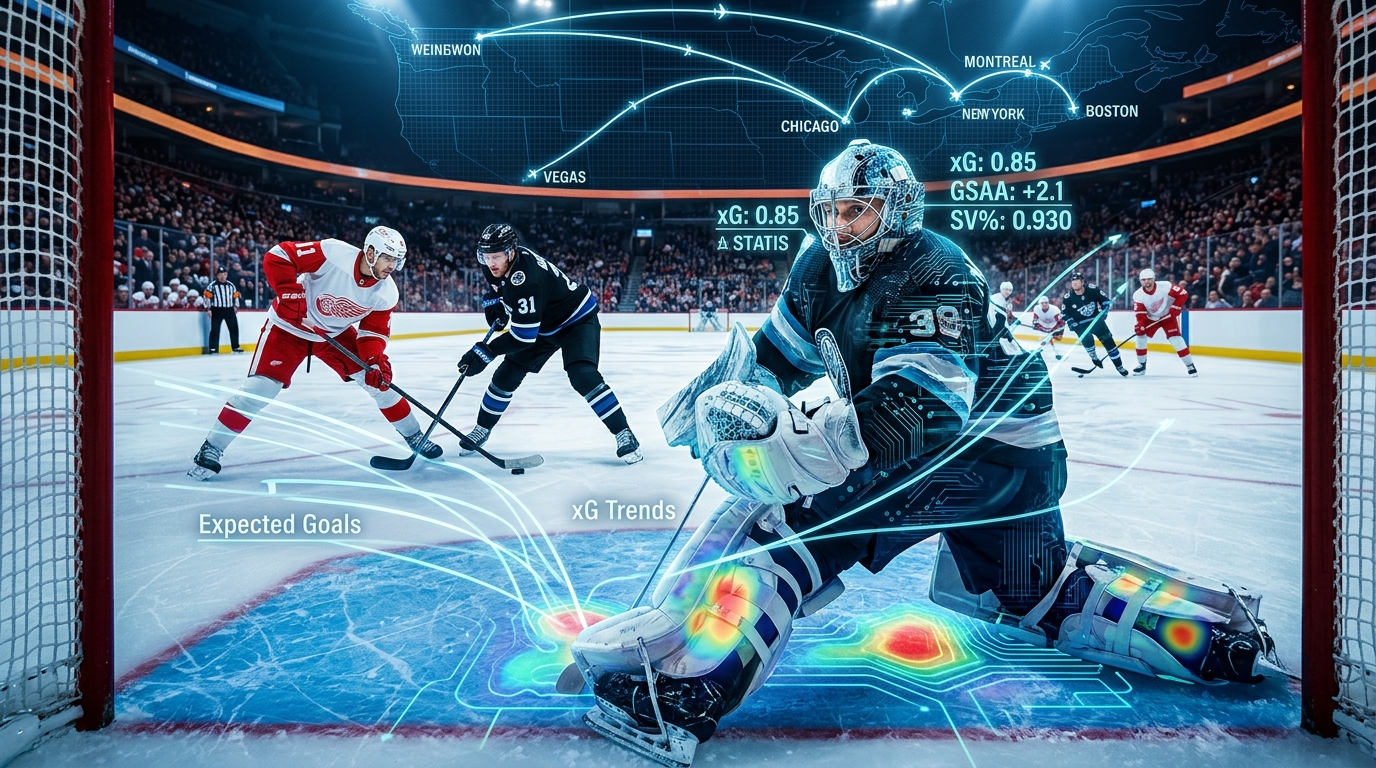
Opening week in the NHL is pure chaos wrapped up in a nice suit, but that is exactly where Opening week in the NHL is pure chaos wrapped up in a nice suit, but that is exactly where solid predictive modeling shines. When everybody else is freaking out over a two-game hot streak or pre-season highlights, a real quantitative approach anchors itself in stable metrics, roster context, and schedule math. I am talking about blending last year's five-on-five expected goals, special teams efficiency rates, travel fatigue quirks, and heavily regressed goalie baselines to build opening week predictions you can actually bank on. The main goal here is pretty simple: translate raw win probabilities into fair betting lines, hunt down mispriced rookie roles before bookmakers adjust, and manage your bankroll like a total professional.
Table Of Contents
Context and schedule signals
Model setup for NHL opening week AI predictions
Game-by-game outputs and interpretation
Risk management and execution
Monitoring and quick post-mortem
Useful tools, templates, and workflow checklist
Putting it all together for opening week
Notes on sourcing and transparency
Quick-reference checklist (print this)
Conclusion
Related Posts
Context and schedule signals
Opening week in the NHL is pure noise. The real edge comes from reading schedule quirks, rest days, travel fatigue, and how quickly lines and starting goalies actually settle down. The public market usually leans way too hard on last season's final standings or flashy pre-season hype. We want to lean heavily on stable underlying rate stats, deep roster context, and totally transparent schedule data. You should always pull official dates, arena hops, and rest gaps straight from official schedule sources, while cross-checking goalie confirmations and morning line rushes through reliable team beat reporters. Keeping track of travel pairings, altitude hops, and back-to-back road spots that sneak up in Week 1 is crucial for finding early value.
Opening-week volatility: what actually swings results
Small sample sizes in October drive people crazy because a hot rookie or a power play unit that clicks for two games can completely skew public perception. Goalie timing is another massive factor since starters might look razor sharp in practice but their glove timing and post-integration reads are off for their first couple of actual starts. On top of that, special teams chemistry like power play zone entries and seam passing usually lags way behind five-on-five chemistry early in the year. You also have to watch defensive reads where blue lines running new pairings frequently under-rotate on weakside pressure during the first week of games.
Rest, travel, and altitude hops
A team playing on one-day rest after traveling across two time zones deserves a slight downgrade of around one to one-and-a-half percent to their win probability compared to a neutral spot. When you see back-to-backs with split goalies, the penalty is pretty modest if both guys are league average. However, if the backup goaltender represents a steep drop in quality, you need to inflate that penalty significantly. Altitude hops, like visiting Denver on the first or second leg of a road trip, require a close look at team conditioning and late-game penalty rates because fatigue consistently leads to high-danger chances against in the third period. The best way to apply this is starting with your model's neutral baseline true line, layering on small schedule modifiers without double-counting fatigue already baked into defensive expectations, and updating your win probability deltas the second starting goalies get confirmed.
Market baselines in October
In early October, the sports betting market constantly falls into predictable traps like overreacting to pre-season scoring spikes or completely mispricing middle-six rookies who drive five-on-five play without finishing their chances yet. Sportsbooks also consistently underestimate penalty kill units dealing with heavy roster turnover because defensive structure takes real time to click. You will also spot fair value skews where moneylines move aggressively on goalie news but barely budge for third-pair defensive injuries, which creates sweet betting value on defense-first teams. To keep your expectations grounded when sample sizes are tiny, use last season's five-on-five expected goals for and against rates alongside special teams metrics as your primary priors. Shrink early-week statistical outliers by fifty to seventy percent back toward those priors, loosening that shrinkage very slowly across a team's first five games while focusing strictly on repeatable process like shot shares and rush chances allowed over raw goal totals.
Where to source the schedule and confirmations
Getting reliable inputs means pulling official schedules, travel gaps, and game dates directly from league master pages. Line rushes, injury updates, and starting goalie announcements should be confirmed through morning skate reports and trusted local beat reporters. For core rate stats and stable historical priors, focus on five-on-five expected goals for and against per sixty minutes, as well as power play and penalty kill rates. Advanced metrics like RAPM skater impacts and overall goal-share adjustments help flesh out player swaps, while real-time game-flow metrics and goaltender performance cards give you a clear picture of netminder quality. If any matchup raises a massive red flag like an unannounced starter or late night travel delay, make sure to tag it so your stake sizing reflects that added layer of uncertainty.
Model setup for NHL opening week AI predictions
This is the exact workflow I run inside the ATSwins NHL stack tailored specifically for Week 1. It is simple, direct, transparent, and built to blend trustworthy historical priors with fresh information without letting early-season noise hijack your process. ATSwins serves as an awesome AI-powered sports prediction platform offering data-driven picks, player props, betting splits, and profit tracking across the NHL, NFL, NBA, MLB, and NCAA.
Define priors from last season’s 5v5 xGF/xGA and special teams xG
Start off by pulling team-level five-on-five expected goals for per sixty and expected goals against per sixty, along with power play expected goals for and penalty kill expected goals against rates. Smooth out any wild statistical outliers by aligning them with broader league distributions, trimming extreme situational stretches like long injury bug windows that do not represent the current roster. Once you convert these figures into expected goal shares and special teams efficiency metrics, they roll cleanly into your baseline goal expectations for every team.
Layer roster churn and rookie uncertainty
When accounting for roster changes, calculate net player impacts by adding or subtracting metrics for all off-season arrivals and departures. Using skater RAPM and overall value metrics allows you to quantify player impacts across offense, defense, and penalty drawing ability. For raw rookies and AHL call-ups, you have to apply strong shrinkage by weighing them sixty to eighty percent toward replacement level until you have a solid eight to ten game NHL sample size or strong historical translation models. If a top-six rookie immediately locks down a spot on the top power play unit, give that power play expected goal rate a modest bump, but keep it strictly capped because power play chemistry takes time to develop.
Goalie quality with regression to career means
Pull recent season goals saved above expected and shot-quality metrics to evaluate netminders, but make sure to regress those numbers heavily toward multi-season career averages early in October. A good rule of thumb is applying a sixty to seventy percent weight on long-term career numbers and only thirty to forty percent on recent trailing data. When projecting backup goalies, rely on career baselines adjusted for age curves, and if you are dealing with a total NHL unknown, regress them straight to league average before making adjustments after their first few starts.
Team-level and skater impacts: blending
Begin your calculations at the team level using five-on-five and special teams rates, then adjust those lines using expected lineup-level RAPM deltas. Position weighting is super important here because top-four defensemen impacts suppress expected goals against far more reliably than swapping out third-line forwards. Once you translate those net offensive and defensive adjustments into expected goal curves for both teams, you get a solid mathematical foundation for any match.
Bayesian shrinkage so noise doesn’t dominate
Your prior means should always consist of last season's team expected goal rates adjusted for roster moves, while your likelihood represents early-season observed goal rates and on-ice impacts. Update your posterior projections by shrinking fresh observations back toward your priors using time-varying weights, such as keeping an eighty percent prior weight for the first three games and dropping to around sixty percent by game five. Always enforce a strict variance floor so that a single weird seven-to-two blowout does not break your entire mathematical scale.
Pre-season usage flags that matter
If a head coach runs a specific line combination heavily during pre-season action, give that extra weight in your time-on-ice projections. If a coaching staff is actively experimenting with brand new power play zone entries or putting a new player in the bumper spot, raise your early volatility score and tag that team with high power play chemistry risk. Most importantly, never abandon a proven elite starting goalie just because he gave up a couple of soft goals in a meaningless exhibition game.
Data sources to pull into the model
Your data pipeline should automatically pull team five-on-five metrics, special teams rates, and score-adjusted shot stats, alongside skater RAPM, penalty impacts, and goalie performance cards. Keep track of line combinations, scratches, and starting goalies through daily confirmation feeds verified by beat reporters. If you are leveraging the ATSwins platform, setting up an automated sync pulls all these metrics directly into your master dashboard, keeping your matchday betting board clean and free from accidental manual edits.
Game-by-game outputs and interpretation
For opening week, you want your model outputs formatted so execution is totally seamless. This stack is what we run through internally before finalizing picks on ATSwins.
What to output for each matchup
Every matchup card needs to highlight the home and away win probabilities, converted fair moneylines, projected total goals, fair puckline prices, a clear confidence tier from A to C, and contextual notes covering lineup risks, travel, power play volatility, and goalie variance.
Here is how a clean output template looks: Team A vs Team B, Date and Time Win probability Team A: 54.8% (Fair Moneyline Team A: -121) Win probability Team B: 45.2% (Fair Moneyline Team B: +121) Projected total goals: 6.1 (Fair Over: -108 / Fair Under: -102) Confidence Tier: B Matchup Notes: Team A playing on one-day rest after cross-time-zone travel. Team B confirmed starting backup goalie. Power play chemistry risk is medium.
How to compute and sanity-check
To compute these lines, start with baseline five-on-five expected goals for both teams adjusted by skater RAPM deltas. Layer on special teams expectations by multiplying power play and penalty kill rates by expected penalties drawn and taken. Factor in goalie quality by adjusting expected goals against based on the starter's regressed career baseline, then apply minor schedule modifiers for rest, travel, and altitude. Once you calculate game-level expected goals, run a Poisson or Skellam distribution simulation to output exact win probabilities and convert those into fair odds. As a sanity check, if your fair line diverges by more than thirty cents from the market before goalie news drops, re-check your inputs, and never let any single schedule modifier alter a win probability by more than two-and-a-half percent on its own.
Reading implied edges vs consensus
Your betting edge is simply your fair line minus the sportsbook's market line. You should only fire off a wager if that calculated edge exceeds your specific uncertainty threshold, keeping in mind that October error bands need to be fifteen to twenty-five percent wider than mid-season numbers. Look out for practical signals like middle-six rookies receiving top power play minutes while still being priced like line-four plugs. Furthermore, when power play units feature multiple new skaters, expect high variance, which often leaves game totals mispriced on both sides. If a strict defensive squad confirms a backup goalie, public bettors frequently overreact to the total, leaving great value on the under if the team's defensive structure remains solid.
Confidence tiers and lineup risk
Tier A represents a strong edge with confirmed starting goalies, zero travel concerns, and tight model agreement across submodels. Tier B signifies a moderate edge where one minor variable remains open, like a backup goalie rumor or mild travel, but the overall projections stay solid. Tier C covers small edges or spots with multiple uncertainties, meaning you only take action if market prices drift heavily in your favor. Always attach a Hold tag to games awaiting morning skate updates, and if lines move against you without fresh news, double-check for undisclosed skater injuries.
Example output block (illustrative)
Home Team vs Away Team, October 10th at 7:00 PM EST Win probability Home Team: 52.3% (Fair Moneyline: -110) Projected total goals: 6.3 (Fair Over: -112 / Fair Under: +102) Confidence Tier: C Matchup Notes: Home team on back-to-back spot with probable backup goalie. Away team traveling across one time zone. High power play chemistry risk for Away team. Lean small or hold until starting goalies are officially confirmed.
Rivalry Match, October 11th at 8:00 PM EST Win probability Road Team: 57.5% (Fair Moneyline: -135) Projected total goals: 5.8 (Fair Over: +100 / Fair Under: -110) Confidence Tier: B Matchup Notes: Road team has top-four defensive core fully intact. Home team debuting two top-six rookies. Public market inflated by pre-season scoring. Wait for closing line value if public money pushes the favorite higher.
Risk management and execution
Having a great predictive model means nothing if your bankroll execution and bet timing are sloppy. Opening week demands serious discipline and conservative unit sizing.
Stake using fractional Kelly or unit caps
Stick to a quarter-Kelly or half-Kelly approach on moneyline and spread edges based on implied expected value. Cap your maximum stake to zero-point-five or one unit per play throughout Week 1, only expanding those limits once early-season variance cools down. If you find yourself taking multiple bets that depend on the exact same narrative or goalie profile, trim your overall exposure by thirty to fifty percent to manage correlation risk.
Avoid correlated exposure
Never stack multiple over bets that rely solely on the idea that the entire league is scoring more goals early on. If you decide to wager on an underdog's moneyline alongside their puckline, reduce the puckline stake substantially rather than treating them as two separate bets. The same logic applies to player props and game sides; if both wagers rely on the exact same game pace, scale back your exposure on one of them.
Time entries around morning skates and confirmed starters
If a market price is wildly out of line the night before a game, you can place a small preliminary position. Wait to lock in your main position until morning skates wrap up and starting netminders are officially confirmed. If the market leaps ahead before you get your bet down, place limit orders at your fair line rather than chasing bad numbers across the board.
Track CLV and error bands
Log your opening line, the line you locked in, and the final closing line for every single wager you place. Assign an uncertainty multiplier to every game - such as one-point-zero for Tier A, one-point-fifteen for Tier B, and one-point-thirty for Tier C - so you can adjust your expected value metrics in your records. If you are consistently grabbing positive closing line value but catching bad bounces, trust your math; if you are consistently losing closing line value, re-examine your data timing and historical priors.
Maintain a blotter to detect drift quickly
Your betting blotter needs dedicated columns for matchup details, date and time, model win probability, fair line, market line at bet time, closing line, confirmed starting goalies, contextual notes, confidence tier, and final result. Run a weekly audit to view expected value categorized by factor tags like travel, goalies, or special teams. If one specific tag is causing repeated model misses, recalibrate its weight before the next slate of games. You can seamlessly automate your ticket logging and closing line tracking inside ATSwins.ai, using the built-in notes features to tag lineup volatility and export your data for instant auditing.
Monitoring and quick post-mortem
Managing your model during opening week requires active daily maintenance, but you have to avoid overreacting to tiny samples and breaking your core equations.
Update priors in-session when starters flip or scratches occur
When a starting goalie flips unexpectedly, swap out his baseline, re-apply your career regression parameters, and immediately recalculate game win probabilities. If a key skater gets scratched, adjust your lineup RAPM deltas, raising expected goals against if a top-four defenseman sits out. If a coach shuffles his lines, tweak special teams rates if the main power play distributor gets moved, and tag the matchup with higher volatility before re-simulating your fair lines.
Log misses by feature
When reviewing losing bets, categorize them by specific feature misses. Note whether you misjudged a goaltender's true baseline, whether unexpected penalty calls caused power play noise, whether travel fatigue showed up as a third-period breakdown, or whether a rookie far exceeded replacement-level assumptions. Documenting these specific categories lets you make precise, surgical adjustments to your projection floors.
Recalibrate weights after 3–5 games
When tuning your model, use smooth elastic updates instead of blowing up your equations after one bad night. Increase skater impact weights once line roles and power play usage stabilize over a three-game stretch. Move goalie projections much slower, since two or three starts contain massive amounts of random noise. If your model consistently diverges from sharp market lines in one specific direction, investigate your foundational priors instead of chasing recent results.
Transparent sourcing and repeatable workflows
Always pull game dates and travel itineraries straight from master league schedules, ground your rate baselines in trusted team statistics, evaluate player impacts through RAPM data, and confirm starting lineups via morning skate updates. Pin these core data links directly into your tracking sheets and timestamp every manual update so you can audit your process cleanly.
Useful tools, templates, and workflow checklist
Here are several practical assets designed to streamline your Week 1 modeling, keep your workflow organized, and maintain complete focus on disciplined execution.
Sheets and model scaffolding
Your primary tracking sheet should be split into three core tabs. The Priors Tab holds last season's team five-on-five metrics, special teams rates, roster RAPM deltas, and career-regressed goalie baselines. The Matchday Tab takes in matchup details, travel penalties, confirmed starters, and outputs win probabilities, fair lines, projected totals, and confidence tiers. The Blotter Tab tracks every live wager, line taken, closing line value, game results, and analytical tags. Color-coding uncertainty - like highlighting unconfirmed goalies in yellow and heavy travel in orange - helps keep risk clear at a glance.
Opening-week parameter suggestions (tunable)
When setting parameters for Week 1, weight your historical priors at seventy-five percent before game one, dropping to sixty-five percent after game three, and settling around fifty-five percent after five games. Cap maximum travel penalties to a two-point-five percent drop in win probability. For backup goalies, cap netminder penalties around six to seven percent unless historical data shows severe drop-offs, and set rookie skater baselines to seventy or eighty percent replacement level until sustained ice time is established.
Comparative view: October vs mid-season tendencies
During October, anchor seventy to eighty percent of your model to historical priors, whereas mid-season models drop that reliance to around forty or fifty percent. Goalie evaluation in October requires heavy regression to multi-year career averages, while mid-season models rely more on trailing two-year performance. Special teams metrics carry high early volatility in October, demanding wider confidence bands compared to narrow mid-season windows. Travel penalties should remain modest across both periods, while rookie uncertainty requires strict impact caps early on versus role-based projections later. Finally, unit sizing should stay capped between zero-point-five and one unit in October, compared to standard one to two unit stakes mid-season.
Confidence tiers checklist
Tier A wagers require confirmed starting goalies, favorable or neutral travel spots, stable roster lines, and tight agreement across submodels within a two percent win probability window. Tier B wagers allow for one open question, such as unconfirmed backup news or mild travel fatigue, provided the calculated edge clears a widened uncertainty threshold. Tier C wagers feature multiple open variables and tiny edges, making them actionable only when market odds drift significantly in your favor.
Edge categories worth scanning early
Look out for middle-six rookies getting top power play minutes who are being priced like fourth-line grinders by books slow to update usage. Keep an eye on disjointed power play units with multiple new pieces where passing chemistry lags, creating great opportunities on game unders. Watch for goaltenders making their very first start of the year who might struggle with rebound control against high-volume shooting teams. Lastly, look to fade public market overreactions on teams coming off flashy, high-scoring pre-season runs by anchoring your bets to five-on-five process and long-term goalie priors.
Practical how-to: converting probabilities to fair prices
Converting win probability to fair American odds is super straightforward. If your model outputs a fifty-five percent win probability for Team A, divide zero-point-five-five by zero-point-four-five and multiply by negative one hundred to get a fair moneyline of -122. For totals, run your expected goals through a Poisson distribution simulation to price over and under options at each half-goal threshold, capping extreme outcomes while early goalie variance remains high.
Time-of-day workflow (repeatable)
Your daily routine should start the night before by setting preliminary lines, checking travel spots, and tagging high-uncertainty games. On morning skate, pull confirmed line combinations and starting goalies, re-run your matchday simulations, and fire off your primary positions while logging them in your blotter. Right before puck drop, check for surprise late scratches, make minor adjustments or small hedges if necessary, and capture closing lines to track your CLV metrics accurately.
Derivative markets to consider (with caution)
Team totals are great derivative options when one team shows stable structural process while their opponent is breaking in multiple volatile rookies. First period totals offer sweet value when early-season defensive rust leads to loose coverage, though stakes should remain small due to high period-to-period variance. Player shot props also present value when top-six forward roles and power play time are locked in, allowing you to catch soft lines before sportsbooks adjust. Keep all derivative exposure capped to ten or twenty-five percent of your total daily bankroll in Week 1.
Common pitfalls and quick fixes
Avoid over-crediting flashy pre-season numbers by capping pre-season metric weights to under ten percent unless a team completely overhauled its coaching system. Prevent double-counting travel fatigue by keeping schedule modifiers totally separate from defensive RAPM metrics. Do not assume ref crackdowns will persist without waiting at least five games to evaluate true penalty enforcement trends. Finally, never chase market line movement unless the move is directly tied to confirmed goalie news or verified lineup updates.
How ATSwins fits in
The ATSwins platform lets you centralize all your picks, player props, and performance tracking in one convenient location. Syncing your fair odds, live wagers, and results helps you spot model drift instantly while comparing your lines against real-time market splits and closing lines. You can launch your NHL workflow inside the ATSwins dashboard to store historical priors, run matchday updates, and maintain a clean betting blotter at ATSwins.ai.
Putting it all together for opening week
A short, repeatable process you can run each card
Start by loading your historical priors, incorporating skater RAPM metrics, and applying career-regressed goalie baselines. Map out schedule factors like back-to-backs, time zone changes, and altitude hops, keeping fatigue penalties modest. Build your matchup simulations to convert expected goals into exact win probabilities, then calculate fair moneylines, pucklines, and totals. Tag each game with a clear confidence tier based on starter confirmations and lineup volatility, compare your fair lines against available market odds, and place your bets using fractional Kelly sizing. Finally, log every play, track closing line value, and audit your results to refine your process.
What to expect from the market in Week 1
Expect sportsbooks to adjust odds rapidly the second starting goalies are confirmed, while public bettors pump lines on flashy, skilled teams based on seasonal optimism. Rookies will routinely be either hyper-inflated or completely overlooked, creating awesome betting edges on both ends. Bookmakers will also shade odds toward popular public narratives, leaving great value to buy back on structured, defense-first teams that get overlooked.
When to pass
Pass on any game where starting goalies remain unknown within ninety minutes of puck drop unless you have equal confidence in the backup's quality. Walk away if a team is skating multiple rookies in their top six with zero role clarity, or if market odds sit right on your fair lines with wide error bands. Stay far away from emotional spots like home openers and banner nights where public narrative completely drowns out analytical data.
Early-week sanity metrics to review nightly
Every night, compare team five-on-five expected goal shares against actual goal shares to make sure you are not over-weighting lucky finishing. Compare expected goalie saves against actual save numbers to ensure your career regression settings are strong enough. Review total special teams opportunities to avoid overpricing power play impacts off tiny sample sizes, and analyze third-period defensive metrics to verify that your travel fatigue penalties match actual ice conditions.
Notes on sourcing and transparency
Always record the exact timestamps when you pull master schedule data and finalize your matchday lineups. Maintain a clean changelog inside your model sheet documenting every single parameter adjustment, such as updating rookie shrinkage or tweaking travel caps. Link your core metrics directly to their primary data sources, and keep all underlying mathematical assumptions saved right beside your outputs so you can run fast, unemotional post-mortems on every losing wager.
Quick-reference checklist (print this)
Load and shrink all Week 1 historical priors.
Add roster deltas and apply heavy regression to rookie skaters.
Regress goalie baselines toward multi-year career averages.
Apply rest and travel penalties while checking for double-counting.
Confirm starting goalies or tag uncertain spots clearly.
Run matchup simulations and output win probabilities, fair lines, and totals.
Assign confidence tiers based on lineup volatility and error bands.
Place wagers using fractional Kelly limits or unit caps.
Capture opening lines, bet lines, and final closing line value.
Assign post-mortem feature tags after games finish.
Using this disciplined framework inside ATSwins keeps your early-season hockey betting calm, highly structured, and grounded in cold, hard data during a week that is usually complete chaos.
Conclusion
Opening week in the NHL is incredibly noisy, which is exactly why anchoring your bets to expected goals, career goalie baselines, and schedule math gives you a massive edge. Time your bets around morning skate announcements and keep your unit sizes conservative while early variance plays out. ATSwins brings elite expertise as an AI-powered sports prediction platform offering data-driven picks, player props, betting splits, and bankroll tracking across the NHL, NFL, NBA, MLB, and NCAA. Their free and paid tiers give sports bettors all the tools needed to make smarter, highly profitable decisions all season long.