

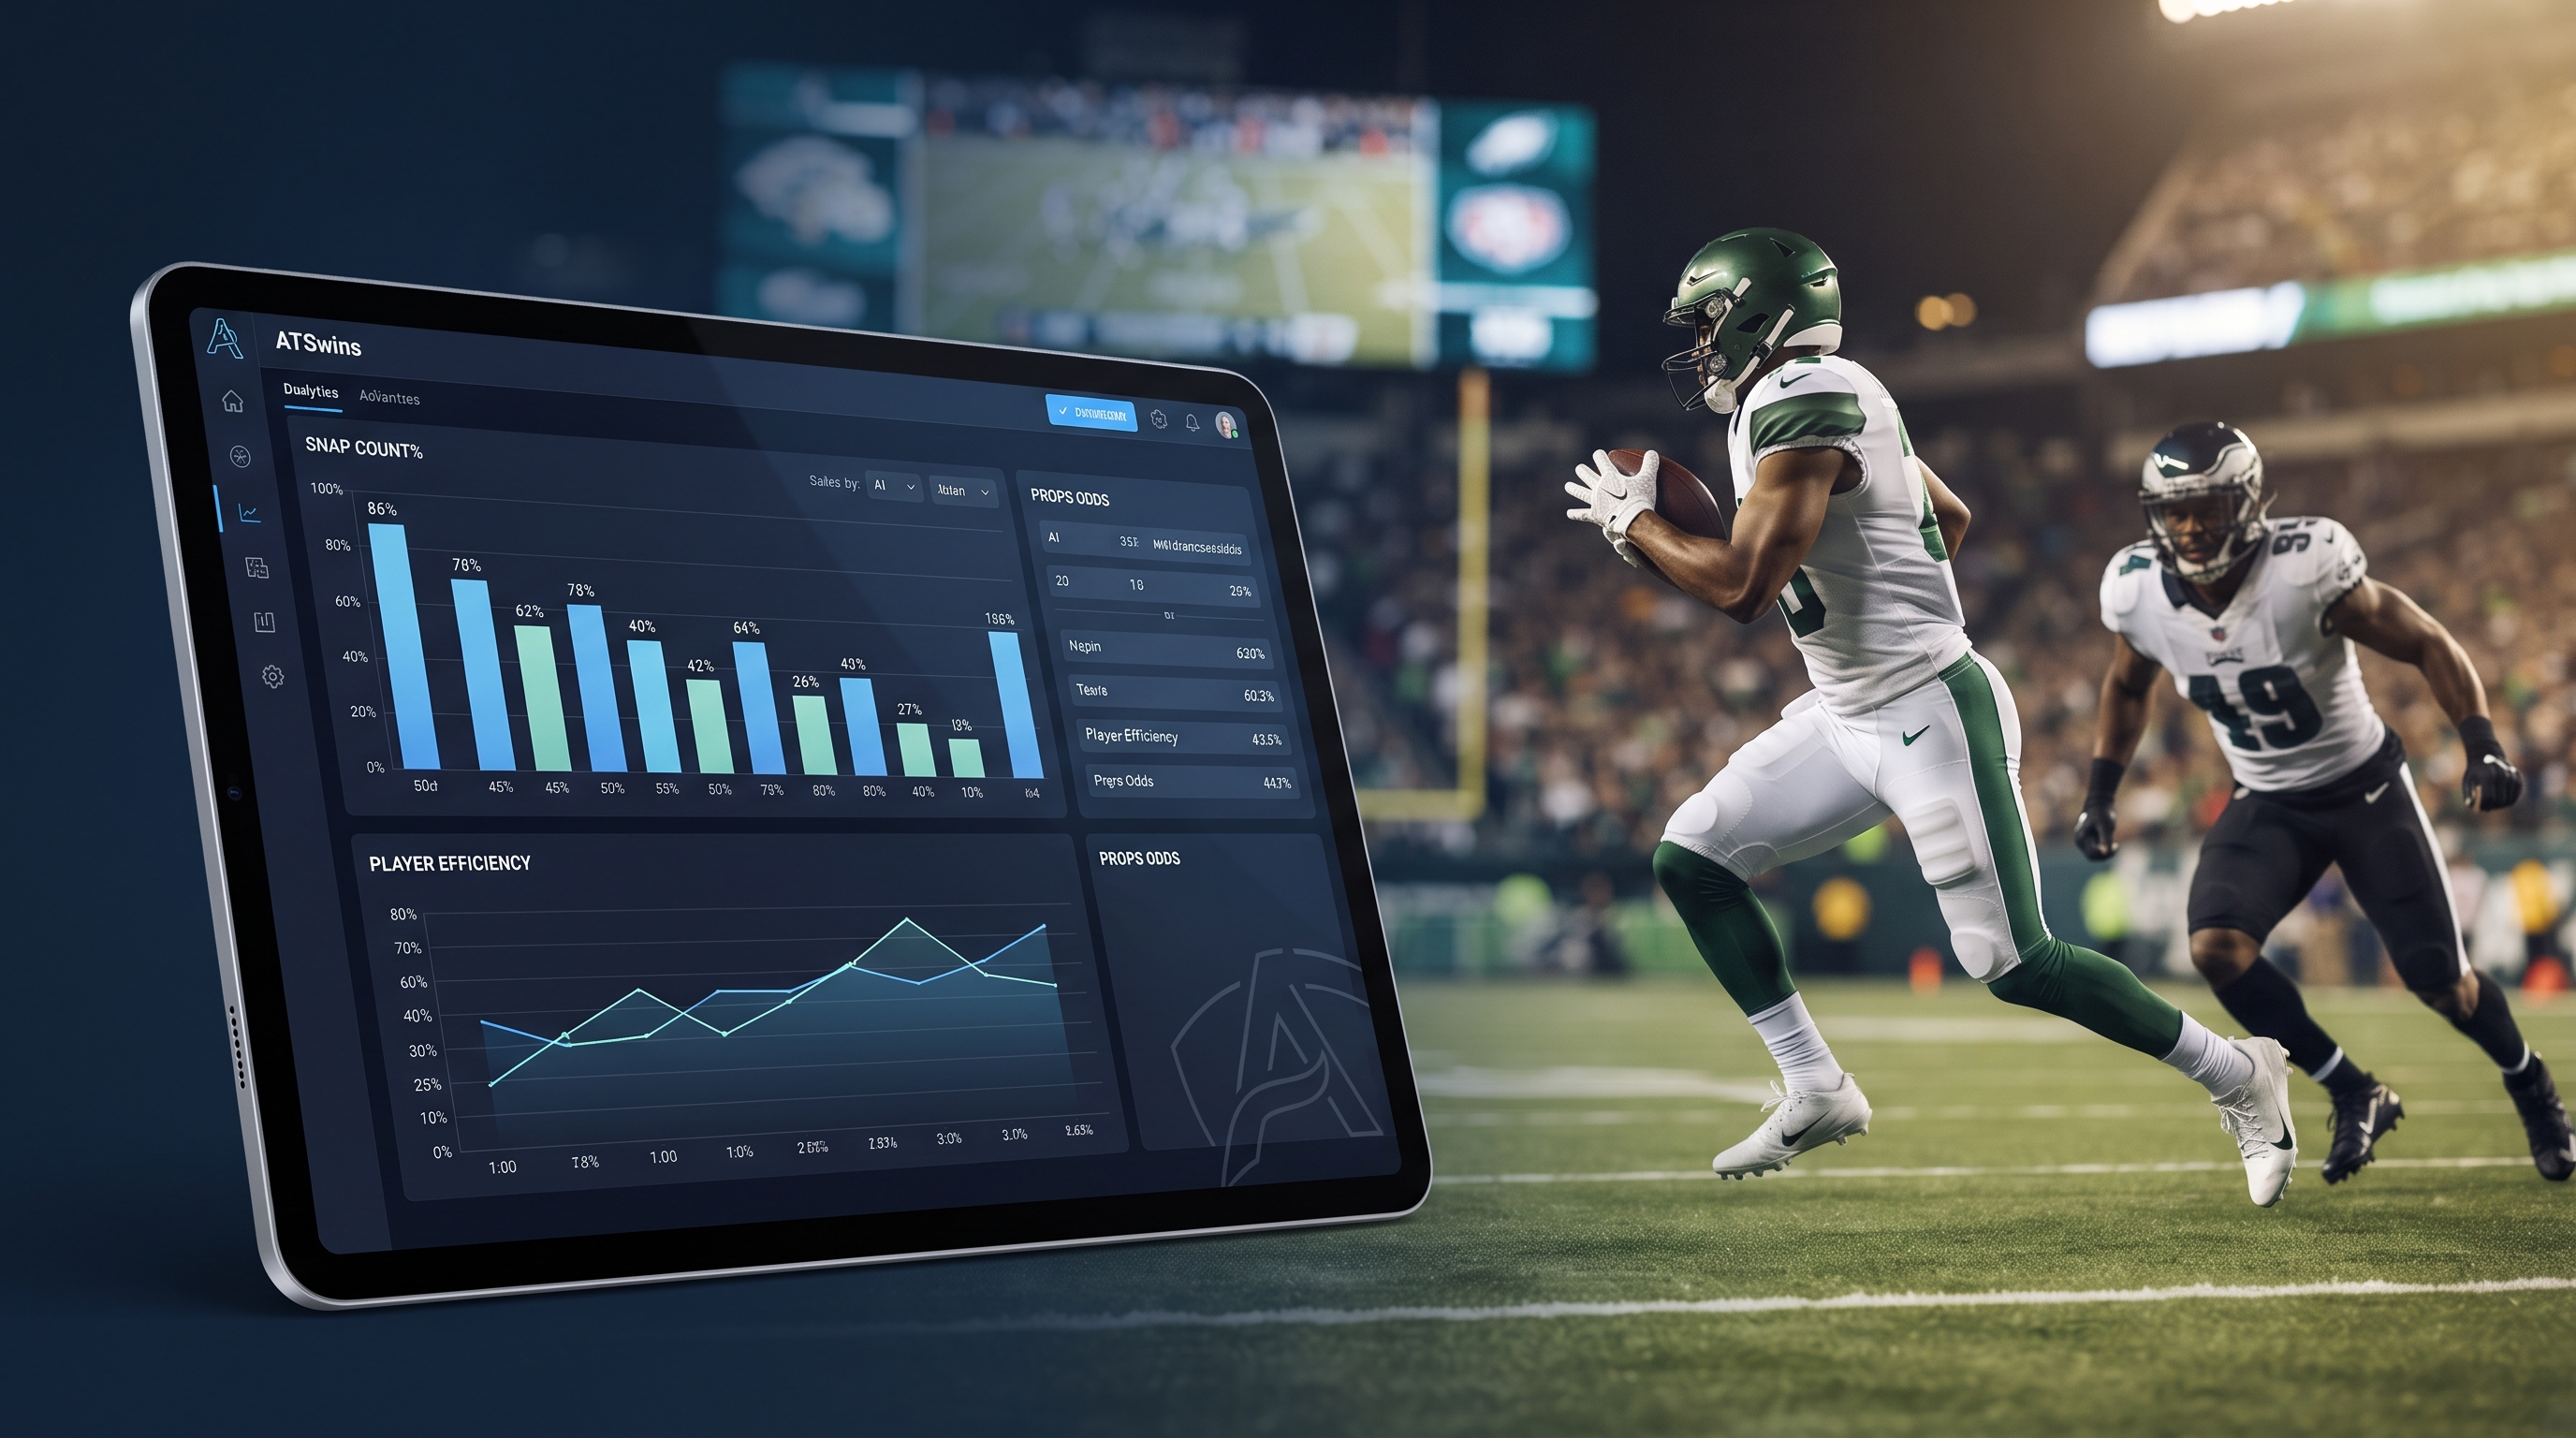
Navigating the weekly slate of football wagers often feels like trying to solve a puzzle where the pieces keep changing shape. Most people staring at betting screens rely on basic box scores or recent point totals to make their picks, which usually leads straight into traps set by sharp oddsmakers. If you want to find a real edge in the market, you have to look past raw numbers and focus on metrics that actually stick from week to week. When it comes to evaluating wide receivers and tight ends, target share stands out as one of the most reliable indicators of future production available to analysts. Understanding how to isolate this metric and apply it to weekly wagers can completely change how you approach building your betting card.
What Is Target Share and Why It Matters
To understand why target share is so valuable, you first have to separate it from total targets. Total targets simply tell you how many times a quarterback threw the ball in the direction of a specific receiver during a single afternoon. While that number matters, it lacks context about the environment in which it happened. A player might haul in ten targets in a game where his quarterback throws fifty times, or he might reach that same number when his team throws only twenty-five times.
Target share fixes this problem by calculating the exact percentage of a team's total pass attempts that went to a specific pass-catcher. If a quarterback drops back thirty-eight times and looks at his primary receiver twelve times, that player commands roughly thirty-one percent of the offense. As you evaluate different offensive systems across the league, utilizing a reliable sports forecasting platform helps you track these shifting percentages without missing a beat. This percentage tells you how much trust the coaching staff and the quarterback place in that specific individual. When you track this figure over a multi-game sample or across an entire season, you get a clear picture of who commands the passing offense and who is merely floating along with the offensive tide.
The Stickiness of Target Share Over Raw Volume
In sports analytics, analysts often talk about the concept of metric stickiness, which refers to how well a statistic from the first half of a season predicts what will happen in the second half. Traditional box score metrics like touchdowns or yards per catch tend to fluctuate wildly because they are heavily influenced by defensive breakdowns, weather anomalies, and small sample sizes. A receiver can break two tackles and turn a short slant into an eighty-yard touchdown, inflating his stats without reflecting any repeatable skill.
Target share, on the other hand, exhibits a remarkably high correlation from week to week and year to year. Receivers who earn twenty-five or thirty percent of their team's targets tend to maintain that role because getting open and commanding the attention of the quarterback is a repeatable talent. Defenses game-plan specifically to take away primary options, yet elite pass-catchers still command the football. When you build an ai sports betting probability model to evaluate player props, relying on sticky metrics like target share prevents you from chasing statistical noise and helps you spot genuine trends before the broader market catches up.
Translating Target Share Into Reception Props
When you open up your sportsbook app and look at player props, the most common markets for pass-catchers involve receptions and receiving yards. Receptions are almost always easier to project than yards because catching a pass is a binary event, whereas yards depend heavily on where the catch happens relative to the line of scrimmage and how many defenders are waiting nearby. This is where target share becomes your primary weapon.
If you want to project a player's receptions, you start by estimating the total number of pass attempts his team will make in the upcoming matchup. Next, you multiply that projected pass volume by the player's established target share baseline. Finally, you apply an expected catch rate based on the types of routes they run and the quality of coverage they usually face. If an offense is projected to throw forty times and your target share model indicates a wide receiver commands a twenty-eight percent share, you are looking at roughly eleven expected targets. Factor in a typical sixty-five percent catch rate, and you have a data-driven projection of around seven receptions, giving you a clear threshold to compare against the betting lines posted by sportsbooks.
Accounting for Team Pass Rate and Game Script
Raw target share numbers are powerful, but they do not exist in a vacuum. A player with a thirty percent target share on a run-heavy team that only throws twenty-five times a game might see fewer total opportunities than a player with a twenty-two percent share on a pass-happy offense that puts the ball in the air forty-five times. Successful predictive modeling requires you to combine individual target share with macro-level team tendencies.
Game script also plays a massive role in how these projections shake out over four quarters. When teams fall behind by multiple scores, they abandon the rushing attack and air out the ball, which often inflates passing volume for secondary and tertiary options. Conversely, teams protecting a comfortable lead late in the game tend to run the clock out, compressing the overall passing volume and making it harder for players to hit their over props even if their target share remains high. Evaluating how an opponent's defensive strengths and weaknesses will influence the flow of the game allows you to adjust your baseline target projections intelligently.
Leveraging ATSwins for Prop Modeling
Building manual spreadsheets to track target shares, pass rates, and defensive tendencies can take hours of tedious work every single week. This is why many analytical bettors incorporate structured platforms to streamline their workflow. Utilizing advanced forecasting tools and predictive sports analytics like those found on ATSwins allows you to analyze game simulations, fair-line estimates, and player projections without getting bogged down in raw data entry.
By leaning on platforms built around statistical modeling rather than emotional gut feelings, you can quickly test how shifting target shares affect player props across an entire Sunday slate. Whether you are looking at quarterback passing volume, running back check-down rates, or wide receiver reception lines, grounding your process in probability and disciplined analytics helps you identify mispriced lines and avoid the traps that sink casual bettors every week.
Frequently Asked Questions
Why is target share better than total targets for prop betting?
Target share normalizes opportunity by dividing a player's targets by their team's total pass attempts. This accounts for differences in team pace and overall pass volume, making it a much more reliable metric for comparing players across different offensive systems.
How many games of data do I need before target share becomes reliable?
A sample size of at least three to four games is usually required to establish a stable target share baseline for a player in a new offensive scheme or role. Prior to that, offseason roster changes and shifting coaching philosophies can introduce too much variance.
Does target share apply equally to running backs and tight ends?
Running backs typically command a much lower and more volatile target share than wide receivers, often focused on short check-downs. Tight ends can maintain high target shares if they serve as the primary safety valve or featured pass-catcher in their specific offense.
How do injuries to other players affect target share?
When a team's primary pass-catcher misses time due to an injury, their target share does not simply vanish; it redistributes among the remaining players on the field. Tracking how a coaching staff historically allocates those orphan targets is a great way to find value on backup player props.