So you’re looking to get a better handle on how to actually read those confidence scores you see attached to sports picks. I get it. It’s super common to look at a number and think it means a guaranteed win, but that is the fastest way to blow through your bankroll. As a sports analyst who spends way too much time building and tweaking AI models, my whole job is translating raw noise like injuries, flight times, and messy historical data into something that makes sense. If you are curious about the mechanics, sports betting confidence ratings explained properly show that a confidence score is really just a plain probability that tells you how likely a pick is to cash based on the data my models have processed. It’s not about predicting the future with some magical crystal ball. It is about understanding the math behind the game so you can manage your risk properly. If you want to get good at this, you have to learn how to read these scores, use them to your advantage, and keep your head in the game even when things go sideways.
Calibrated confidence in sports picks: what it is and what it is not
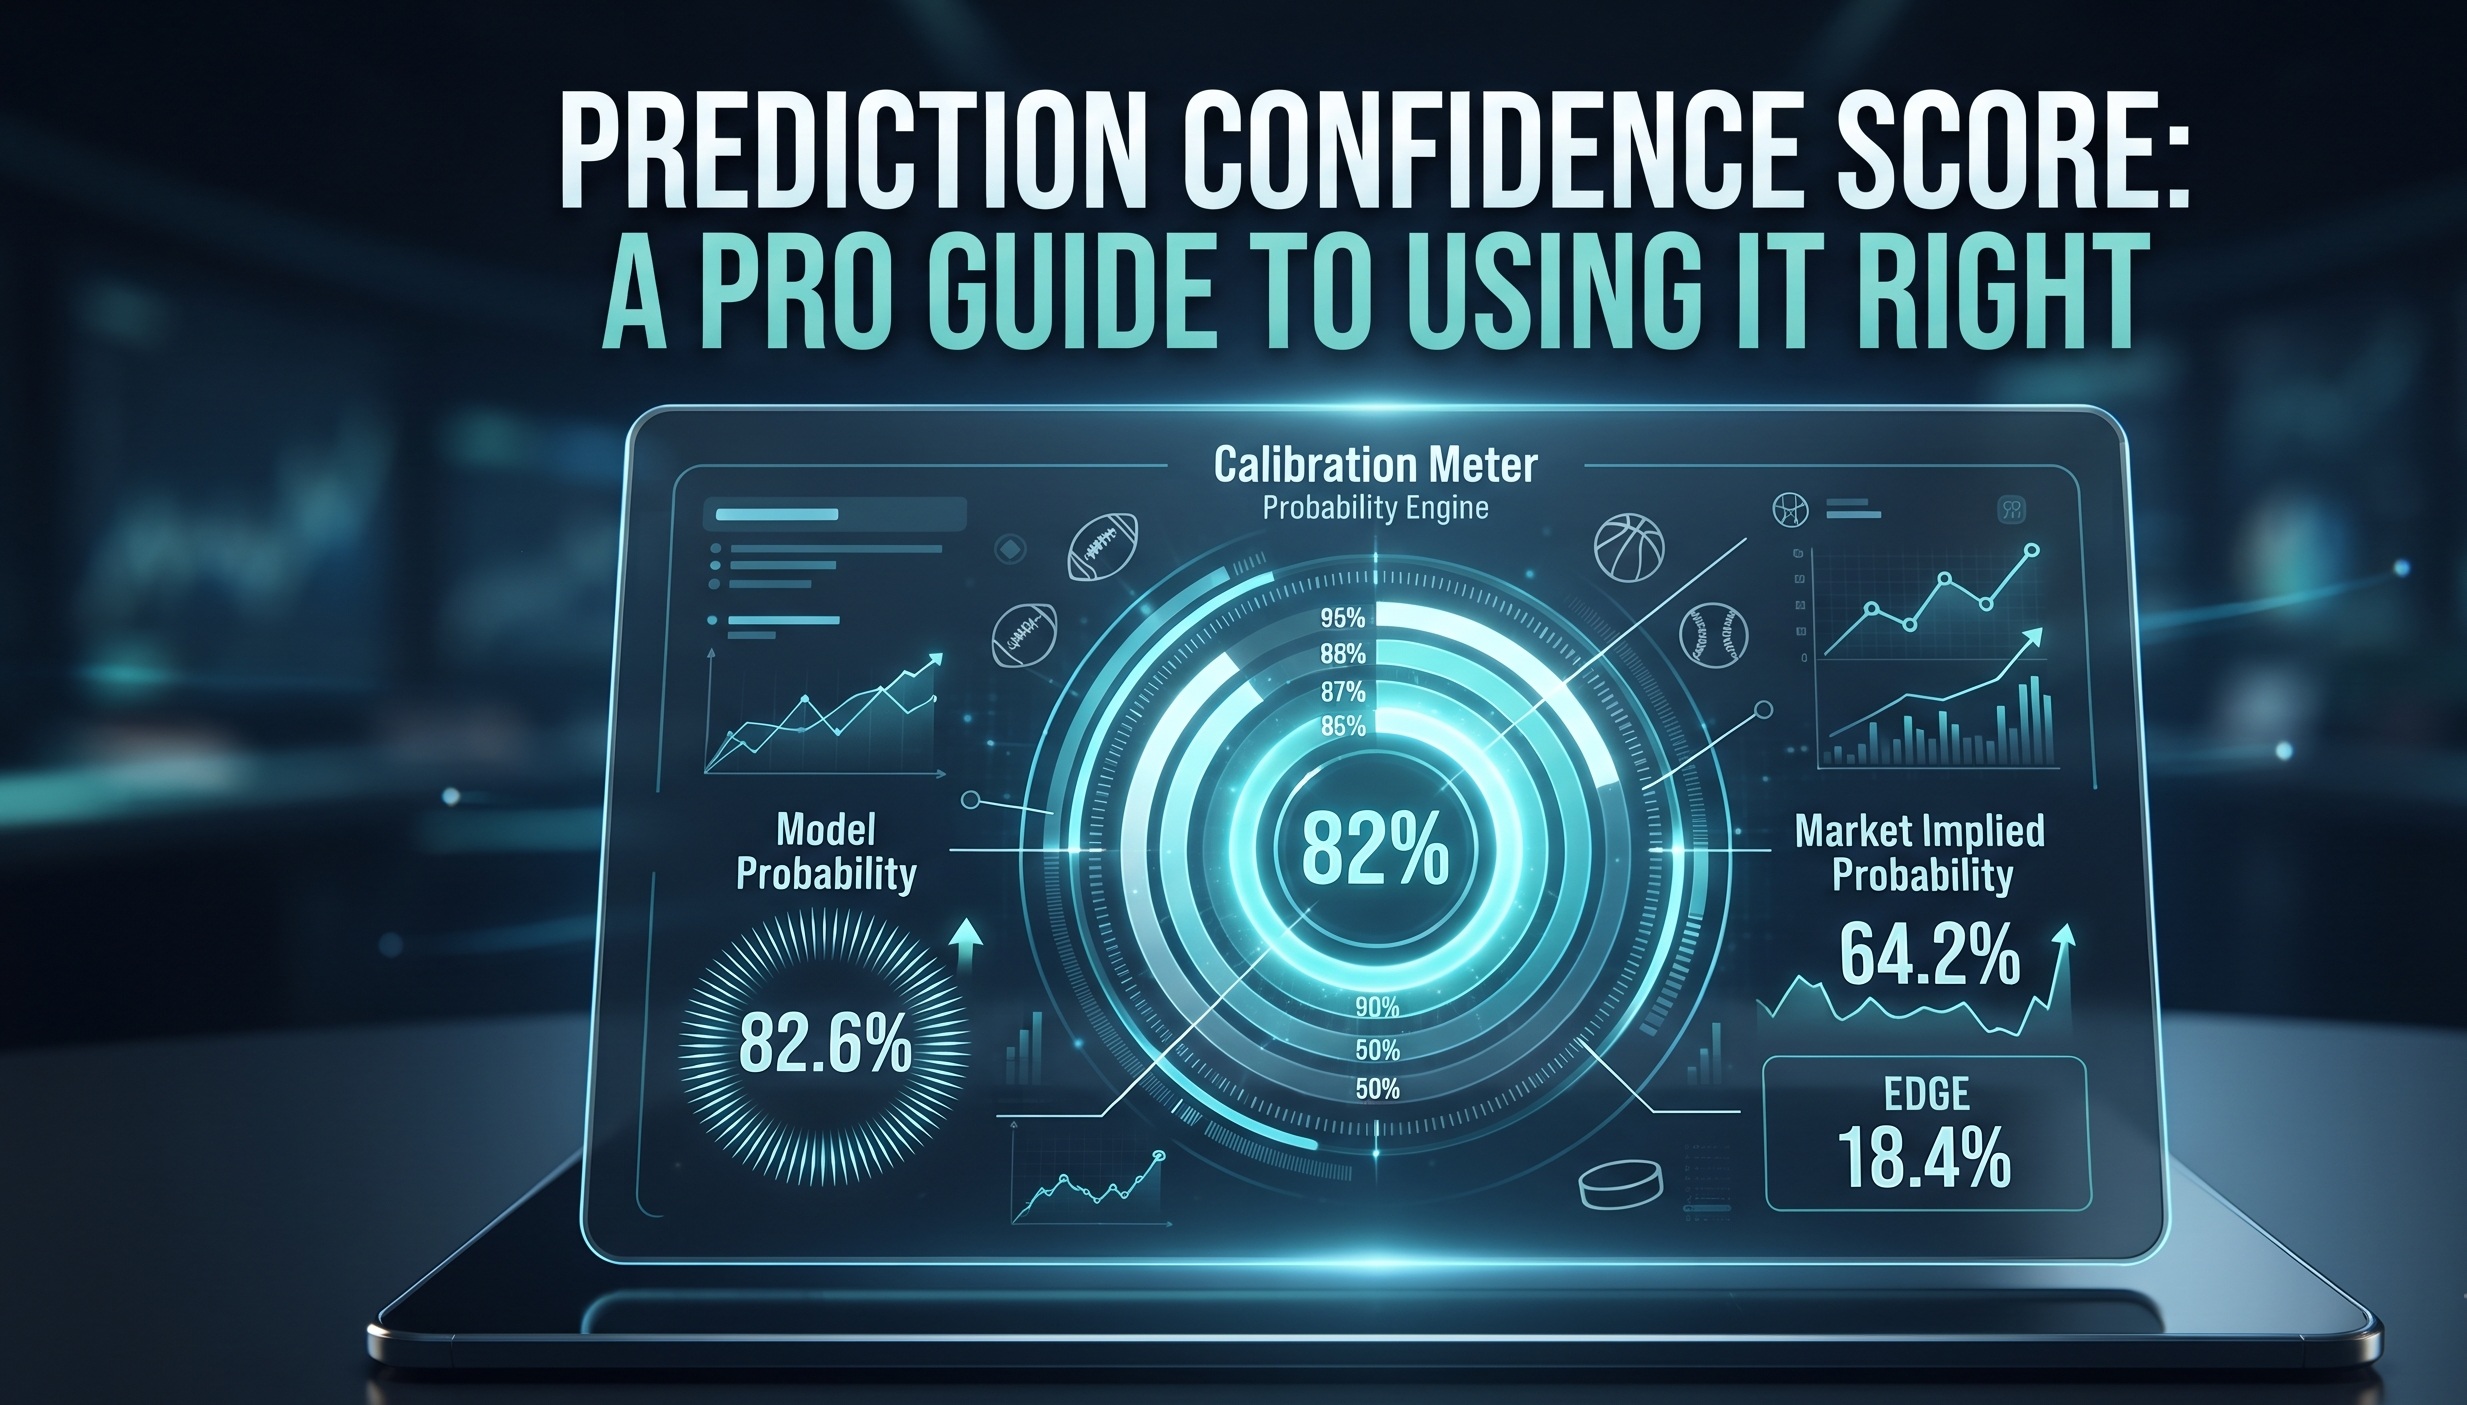
When we talk about a sports betting prediction confidence score, we are strictly talking about a calibrated probability that usually sits somewhere between zero and one, or zero and one hundred. It is definitely not a guarantee. It is also not a measure of how good a team is on paper. If my model spits out a 0.63 for an NBA side, it means that if I could hit repeat on this exact game and those exact conditions one hundred times, my model expects to win about sixty-three of them. The word calibrated is the most important part of that sentence. It means the score needs to actually match up with how often those picks win in the real world over a long enough timeline. Because the betting markets are always shifting and variance is a constant pain in the neck, even a really solid sixty-three percent pick is going to lose thirty-seven percent of the time. You have to be okay with that reality. The point of using these scores is to price your risk consistently rather than trying to achieve perfection, which just isn't happening.
You are going to find yourself doing a lot of math to flip between American odds and probabilities because you need to constantly compare your model to what the sportsbook is actually showing. If you are looking at negative American odds, you find the probability by taking the negative value of the odds and dividing that by the negative odds plus one hundred. For positive odds, it is one hundred divided by the odds plus one hundred. If you are working with decimal odds, you just divide one by the decimal odds. These quick calculations are your best friend. For example, if you have American minus one hundred fifty odds, you are looking at a sixty percent implied probability. If you have decimal one point eight, you are looking at roughly fifty-five point five six percent. Being able to do these in your head or on a scratchpad is essential for checking your work against the market.
The real magic happens when you calculate your edge, which is just your model’s probability minus the implied probability from the book. If your NFL model thinks there is a fifty-eight percent chance for a side to win, and the sportsbook’s odds translate to fifty-four point five percent, you have an edge of three point five percent. That is where you decide if a bet is actually worth it. A good rule of thumb is to only place a bet when your edge is actually bigger than the vig or the transaction costs you are facing. If you get really good at shopping around for the best lines and timing your bets, you can get away with smaller edges. It is all about predefining your thresholds for different sports. You might decide you only want to bet NFL sides if the edge is at least two or three percent, while player props might require a much larger edge of five to eight percent because the holds are usually much higher. Those numbers are not set in stone, so you should let your own record and your own limits guide your strategy.
Calibration really is the backbone of this whole operation. You might find two different models that have similar accuracy, but one might be totally out of whack when it comes to probability. If your model claims it is giving you a seventy percent confidence score, but those picks are only winning fifty-six percent of the time, you are clearly overconfident. That means you are likely betting way too much money and you are going to get yourself into trouble. A raw margin of victory prediction might be nice to look at, but a calibrated win probability is what you can actually use to build a plan.
Building a reliable confidence score
When you start building your features, you have to make sure you are mirroring the information that is actually available to you at the moment you are hitting that bet button. If you are using data that a bettor couldn't have known at the time, your results are going to be totally fake. Think about things like player injuries, who is starting at pitcher, how much rest a team has had, and travel distance between games. These are the things that actually move the needle. I also like to look at team-level fatigue, like time zone shifts or how many games they have played in the last week. Matchups are huge, too, whether you are looking at defensive schemes in the NFL or platoon splits in MLB. For player props, you really want to focus on projected minutes or snaps and how the opponent’s scheme matches up with that specific player. Consistency is key, so try to use similar feature categories across different sports so you can reuse your pipelines. And please, be absolutely ruthless about your time stamps. If you are using info that you wouldn't have known until after the game was over, you are just lying to yourself.
Leakage is absolutely the silent killer of any betting model. You really have to avoid it at all costs. Do not use final closing lines if you are planning to bet earlier in the day. Do not use injury reports that came out hours after the game started. For player props, ignore any rotations that were unknown at the time of the lock. If you use a platform like ATSwins, make sure you are setting explicit cutoff times for your data snapshots so you are not training your model on information from the future. This one habit alone will do more for your real-world success than trying to find some overly complicated algorithm.
When it comes to picking a model, there is no single one that is going to win every time. I find myself rotating through a few different types. Logistic regression is a great place to start because it is fast, easy to understand, and gives you nice, clean probabilities. If you are dealing with more complex data, gradient-boosted trees like XGBoost or LightGBM are really good at handling non-linear relationships. Bayesian hierarchical models are also fantastic if you are working with sports where you need to borrow strength across different teams or players, like MLB pitchers or NHL goalies. I sometimes use ensembles to stack these models together to help stabilize my predictions and keep the variance down. Always start with a simpler feature set and only add complexity if it actually helps you pass your out-of-sample tests.
You also need to quantify your uncertainty using things like cross-validated probabilities or Monte Carlo simulations. This prevents you from getting results that look way too perfect in your training phase. If your model tells you a pick has a sixty percent probability but your simulations show a wide ninety-five percent confidence interval, you know not to treat that bet like a sure thing. If you are dealing with class imbalance, like when favorites win way more often than underdogs, you can fix that by reweighting your samples or using stratified sampling to keep your class ratios in check. Always aim to minimize your log loss rather than just trying to get the highest accuracy score.
Even the best models can end up with poorly calibrated probabilities, so you have to do some post-processing. Platt scaling or isotonic regression are your go-to tools here. These methods basically map your raw model scores to a more realistic probability distribution. You should calibrate on a separate validation set so you are not using the same data you trained on. I also like to run rolling walk-forward tests to make sure my model isn't falling apart as the season progresses. Sports are always changing, and if your model’s coefficients or feature importances are swinging all over the place year after year, you probably need to add more hierarchical structure or just get fresher, more relevant data.
Turning the score into real bets
Once you have that calibrated probability, it is time to turn it into a fair price and compare it to what the bookies are showing. If your fair price is minus one hundred fifteen and the market is giving you minus one hundred five, you have a solid edge and you should feel good about that. If the market is showing minus one hundred twenty-five, you just walk away. It is not personal, it is just business. You can calculate your expected value by looking at your model probability and the decimal odds of the bet. It is a simple formula of your probability times the payout minus the probability of losing. If you find a bet that gives you twenty-five percent expected value, that is huge, but don't expect to find those every single day.
Staking is where most people get themselves into trouble. I highly recommend using a fractional Kelly criterion to size your bets based on your edge and the odds. It is basically a way to make sure your bet size is proportional to the probability you have assigned to the win. If you are worried about drawdowns, just use a half-Kelly or even a quarter-Kelly. It keeps you from going broke during a bad run. You should also set a hard cap on how much you bet on any single event, like two or three percent of your total bankroll. If you have five different props for the same game, you have to treat that as one big exposure because they are all correlated. If the team loses, all those props are probably going to go down with them.
Timing is everything in this world. Lines are constantly moving because of injuries and breaking news. If your model relies heavily on who is starting in the NBA, you should have alerts set up so you are only betting once you have that information. You don't want to bet before a potential scratch unless you are trying to beat the market move. You should also watch out for public versus sharp money. Sometimes if you see a side taking a lot of sharp resistance early, the line might move back in your favor later in the day. Use your confidence score to decide if it is actually worth waiting for a better number or if you should just take what is there.
You should always use your closing line value as a way to check if your process is actually sound. If you are consistently beating the closing line, that is a huge indicator that you have a long-term edge. If your model says you have positive expected value but you are constantly losing to the closing line, you need to go back and figure out if your calibration is off or if your entry timing is just bad. Keep a log of every bet you make, including the time, the line, your stake, and the closing number. It is a bit of work, but it will pay for itself the first time it stops you from making a really bad move. Having predefined entry rules is the best way to keep your emotions out of the decision-making process. If you have clear rules for when to bet and when to pass, you don't have to worry about chasing your losses or overreacting to a bad week.
Validating and monitoring the confidence score
If you want to know if your model is any good, you have to do some rigorous backtesting. I like to hold out a recent chunk of data, like the last six weeks of an NFL season, and strictly not touch it until I have finished my initial testing. Walk-forward testing is even better because it simulates the reality of having to make decisions with the data you have available in the moment. It is the best way to see how your model handles an evolving season. For things like player props, you should simulate different windows throughout the day to see if your edge holds up whether you are betting early or late.
Reliability diagrams are one of the most useful ways to see if your model is actually calibrated. You put your predictions into buckets, like fifty to fifty-five percent or sixty to sixty-five percent, and then you plot the predicted probability against the actual win rate for each bucket. You want those points to land right on the forty-five-degree line. If they are consistently off, you are either overconfident or underconfident. You can also use the Brier score, which is basically the mean squared error of your probabilities. A lower Brier score means your model is doing a better job of predicting reality. Log loss is another one that I track, although it can be a bit punishing if you are making bold, incorrect predictions.
You should also look at calibration in the large, which is just comparing the average predicted probability to the average outcome over a long period. If your model is consistently overestimating your win rate, you can fix that by adjusting your intercept bias. Another thing to watch is the calibration slope, which you can get by regressing your outcomes on your predicted log odds. If your slope is less than one, your predictions are probably too confident. If it is greater than one, you are likely not confident enough. These are simple diagnostics that can save you a lot of grief.
Don't fall into the trap of thinking that AUC is the only metric that matters. It is good for ranking, but it doesn't really tell you if your betting strategy is actually going to be profitable. You need to make sure you have a large enough sample size to distinguish signal from noise. If your edge is only two percent, you are going to need thousands of bets to really know if you have something special. Keep an eye on your Brier score over time, and if it starts to deteriorate by fifteen percent or so, it is time to pause and see what is going on. Markets adapt and teams change, so you have to be ready to recalibrate your models whenever the data starts to look stale.
Communicating risk, ethics, and responsibility
When you are looking at these confidence scores, you need to remember to keep things in perspective. Even a three to five percent range around your estimate is a big deal in this game. If I tell you a pick has a sixty-two percent chance, but it has a really wide uncertainty range, that is a much riskier bet than one that is fifty-eight percent with a tight interval. Always report your point estimate and your confidence interval so you can get a better sense of how much you should be risking.
You should absolutely have a daily stop-loss in place. If you are down three or five percent of your bankroll in a single day, just shut it down and walk away. That is how you prevent yourself from getting into a bad headspace and chasing losses. Setting a cap on the number of bets you make per day is another good way to avoid over-betting low-edge opportunities. I also try to keep a written record of my rationale for every single bet. It is not just about the numbers, it is about being able to look back at your process and see where you can improve. You should also make sure you are only playing on regulated, legal platforms. It is just safer and it helps ensure you are keeping everything above board.
At the end of the day, you are looking for small edges that you can exploit consistently over a long period of time. It is not about one big win, it is about the grind. If you can reduce the amount you are paying in vig, stay properly calibrated, and keep meticulous records, you are going to be ahead of ninety-nine percent of the people out there. Consistency is a superpower in sports betting.
Practical tools, templates, and checklists
You should definitely have a cheat sheet handy for those odds conversions. Knowing that minus one hundred fifty is sixty percent or plus one hundred forty is forty-one point sixty-seven percent will save you a lot of time. Having a template for your expected value and Kelly calculations is also mandatory. I keep a simple sheet with my market odds, my model probability, my bankroll size, and my chosen Kelly fraction. It does all the heavy lifting for me and helps me avoid making impulsive decisions.
Your calibration workflow should be something you can pull up at a moment's notice. You start by training on your historical data, then you generate your out-of-fold probabilities, fit your scaling, and run your reliability checks. Always make sure you are logging which model version you used for each bet so you can see if your changes are actually working.
Managing a dashboard is the best way to keep track of your health as a bettor. Every week, I check my closing line value distribution, my hit rate by bucket, and my Brier score. I also like to keep an eye on feature stability to make sure my model isn't relying on things that are becoming less relevant. Using an ai sports betting research platform like ATSwins is a great move because it brings all of those picks, betting splits, and tracking features into one place. When I use it, I start by using the pick feed to see what aligns with my model, check the splits to see how the public is betting, and then use my worksheet to confirm if the price is actually worth it. It’s all about building a workflow that keeps you focused on quality over quantity.
If you find yourself winning picks but losing money, check your price shopping and your closing line value. If your backtests are great but your live results are trash, you are almost certainly dealing with data leakage from the future. If your confidence scores are just clustering at the extreme ends of the spectrum, you probably need to add more regularization to your models. And if you notice you are doing well on early bets but failing after the news breaks, you might be missing some key correlations or being blind to roster volatility.
When you are looking at specific sports, remember that they all have their own quirks. NFL is a game of fewer, higher-stakes decisions, so every injury report is massive. NBA is all about the back-to-backs and the constant rest management. MLB is dominated by starting pitchers, but you really can't ignore the impact of a strong bullpen or changing wind conditions. NHL is just super spiky, and the goalies can be the difference between a great night and a total disaster. NCAA is a total wild card because of how much rosters change from year to year. Treat every sport with the respect its unique math demands.
Conclusion
At the end of the day, confidence scores are just a tool to help you turn a bunch of messy data into something you can actually work with. You have to calibrate your numbers, always compare them to the market to find a genuine edge, size your stakes intelligently with the Kelly criterion, and then track everything you do so you can get better over time. You should also constantly be updating your sports betting market intelligence by watching how the lines move and what the smart money is doing.
For anyone who wants to take this seriously, ATSwins is an AI-powered sports prediction platform that covers everything from NFL to NCAA. It gives you access to data-driven picks, player props, and betting splits, along with the profit tracking you need to actually understand your performance. Whether you are using the free or paid plans, it is a great way to start getting those insights so you can stop guessing and start making more informed decisions every time you bet.
Frequently Asked Questions (FAQs)
What is a sports betting prediction confidence score?
A sports betting prediction confidence score is just the probability your model assigns to a pick winning. If you see a sixty-two percent confidence score, it means that under similar conditions, the pick should win about sixty-two percent of the time. It is not a promise, and it is definitely not a guarantee. It is just a calibrated measure of expectation. The real power comes from comparing that number to the bookie’s odds.
How do I use a confidence score to find value in the odds?
You turn your score into fair odds and then compare that to what the sportsbook is showing. For instance, if your model says a pick has a sixty-two percent chance, that works out to fair decimal odds of about one point six-one, which is about minus one hundred sixty-four in American odds. If the sportsbook is offering minus one hundred forty-five, they are implying a lower probability than your model thinks is the truth. That difference is your edge.
What confidence score is “good enough” to place a bet?
There is no single number that works for everything. It always depends on the line and the vig. A fifty-eight percent pick can be amazing if the book has it priced like a fifty-two percent chance, but a sixty-four percent pick is a bad deal if the book expects it to win sixty-five percent of the time. I usually look for edges in the two to four percent range for starters. Anything over five percent is excellent, but you still have to manage your bankroll.
How do I know if my confidence scores are actually accurate?
You have to bucket your picks based on their probability and track how they perform. If your sixty to seventy percent bucket is winning sixty-five percent of the time, you are in a good spot. You should also watch your closing line value. If you are consistently beating the closing line, you are doing something right. Just be patient, because you need a big enough sample size to know if you are actually good or just lucky.
How does ATSwins.ai use a sports betting prediction confidence score—and what do I get?
ATSwins gives you the probabilities behind their picks so you can see the confidence level rather than just a name. As someone who works with models, I appreciate how they combine that math with live updates on things like betting splits and player status. You get AI-powered projections for the major sports, clear signals that help you understand the market movement, and profit tracking to help you see what is working and what isn't. It is designed to help you make smarter decisions, not just place more bets.