

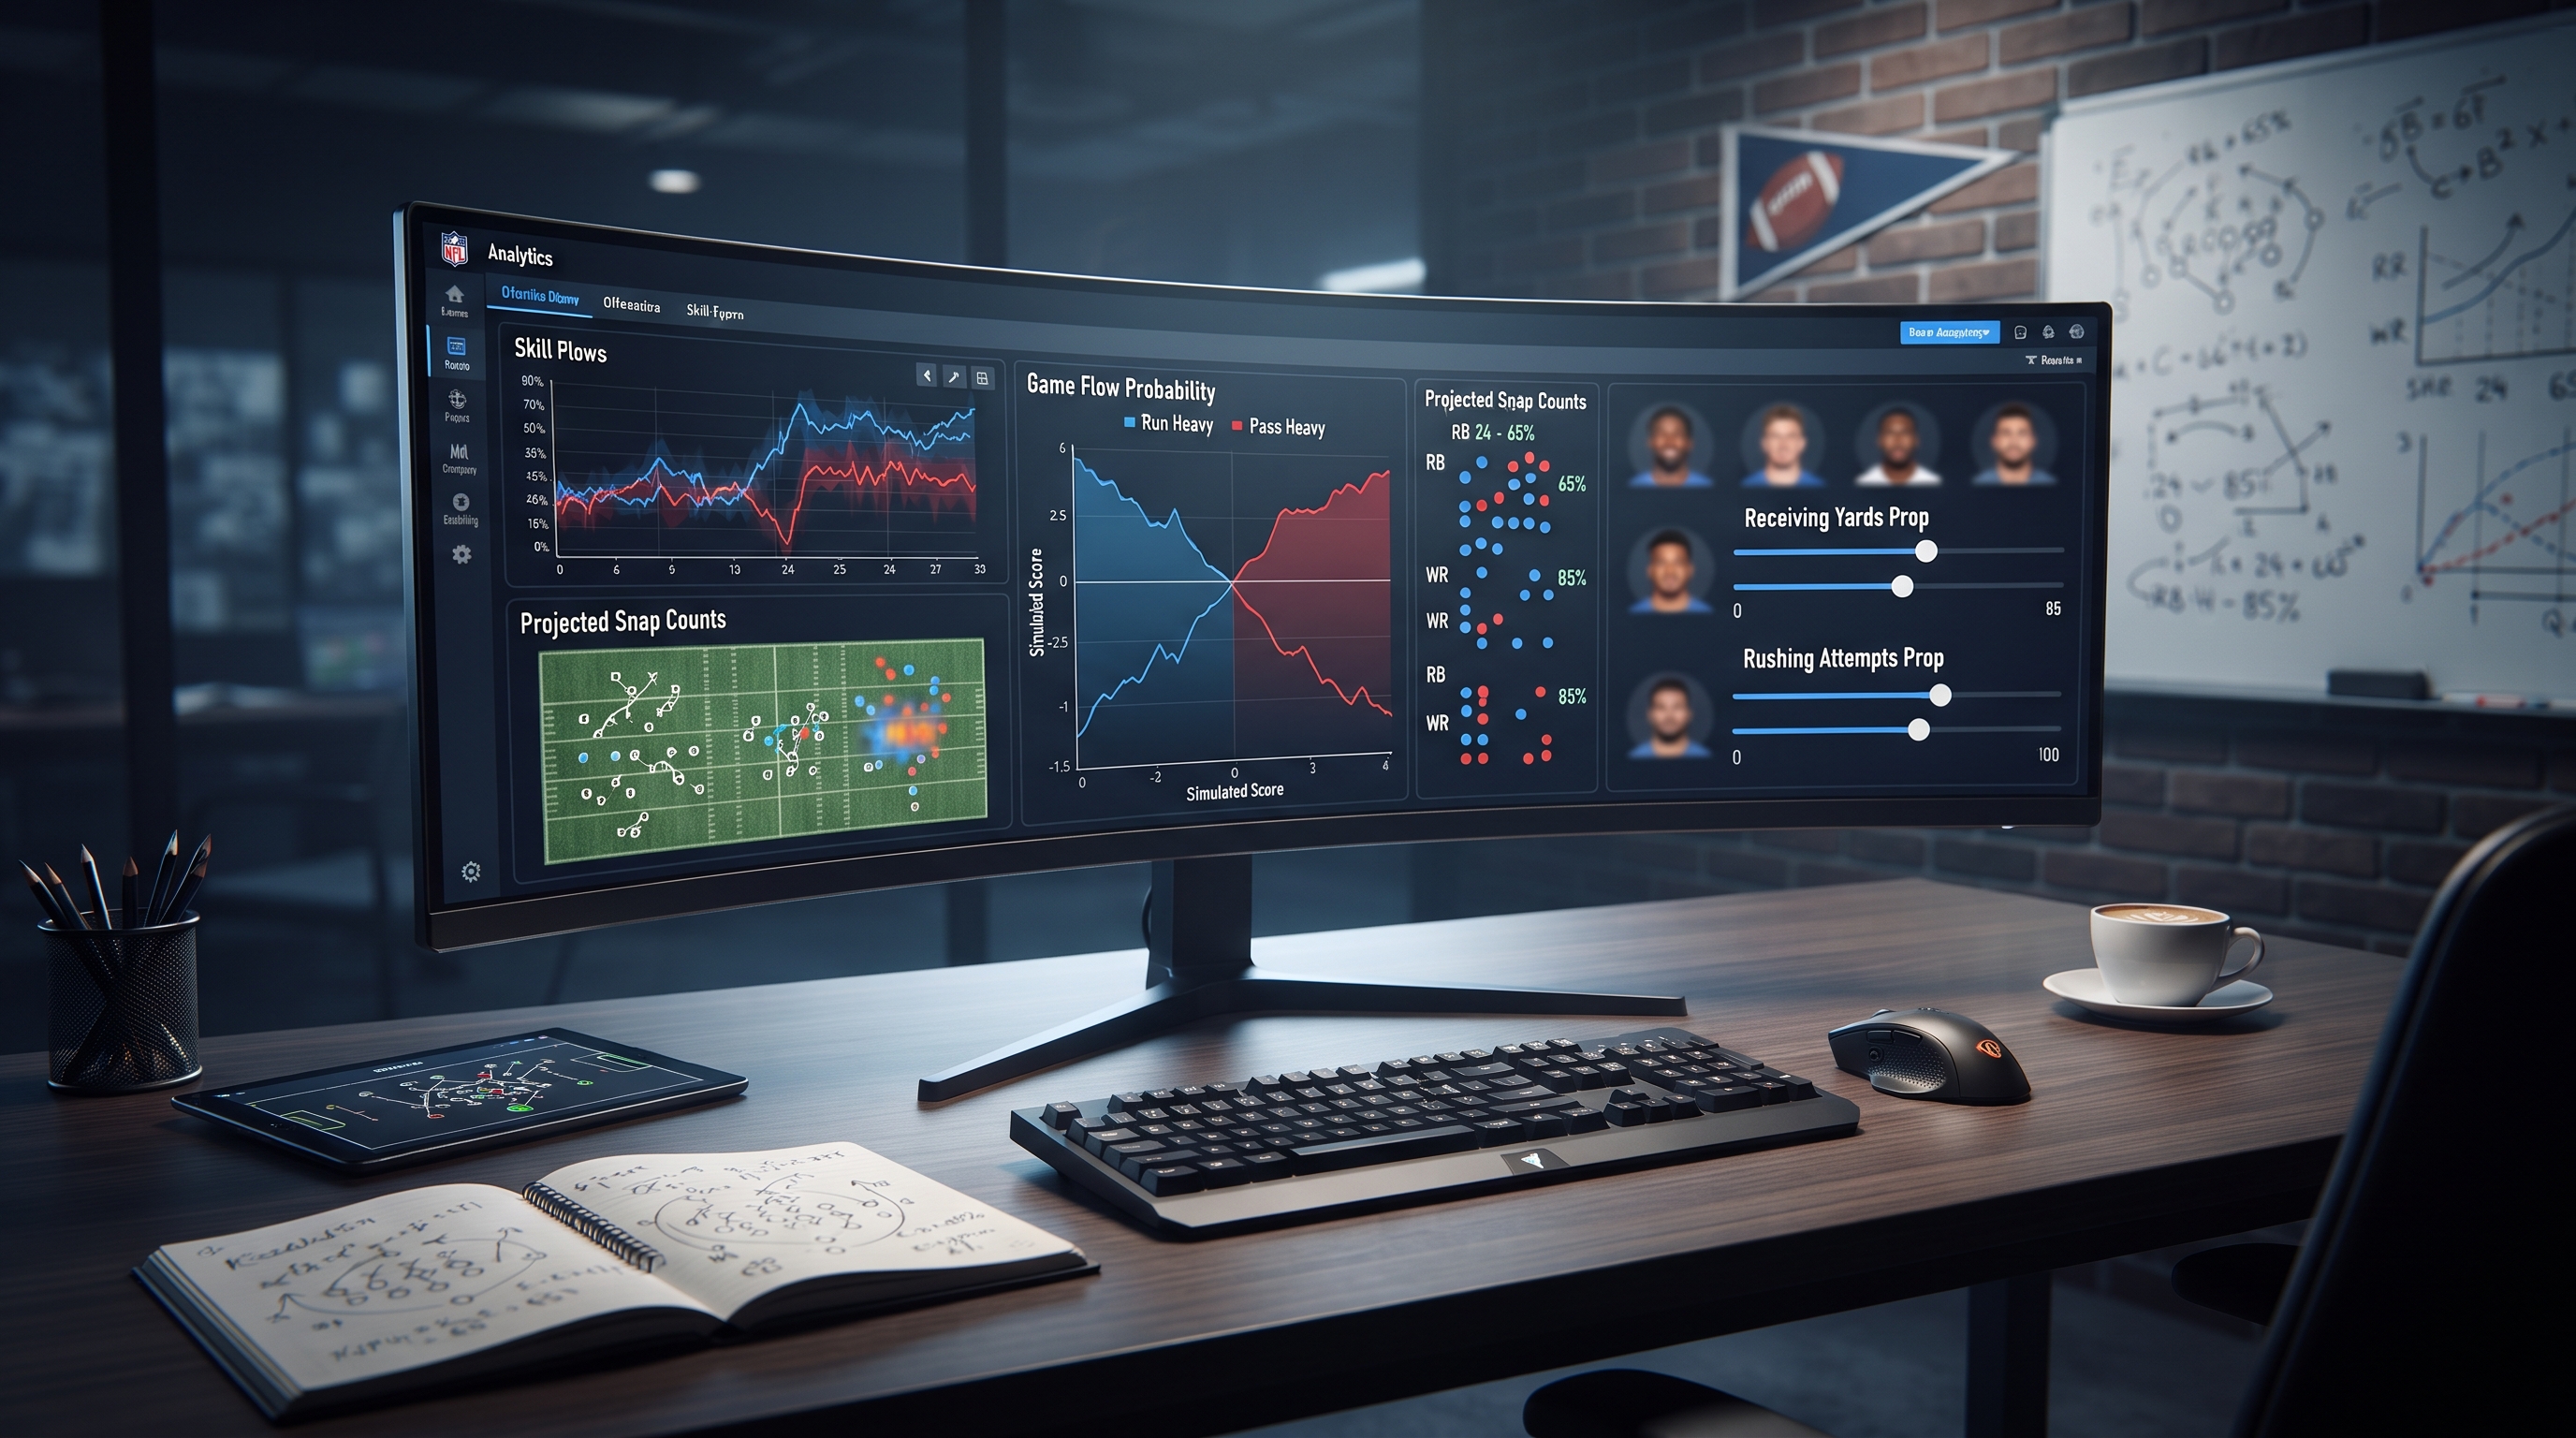
Navigating the massive weekly menu of NFL player props can feel overwhelming even for experienced football fans who watch every game on Sunday. Sportsbooks roll out hundreds of individual markets for every matchup, covering everything from quarterback passing yards to running back carries and wide receiver receptions. Most casual bettors make the mistake of looking only at the final box score from the previous week when deciding how to play these numbers. They see that a receiver caught six passes for ninety yards and immediately lock in the over for the next game without asking how those numbers happened. But raw box scores often hide more than they reveal about a player's actual role within an offense.
If you want to find genuine edges in the betting markets, you have to look past simple yards and touchdowns and start studying the underlying playing time. This is where tracking snap counts changes everything about how you evaluate player performance. A player cannot accumulate statistics if they are standing on the sideline wearing a baseball cap, no matter how talented they might be when the ball is in their hands. By breaking down how many offensive plays a guy participates in relative to his teammates, you get a pure measure of opportunity. Opportunity is the lifeblood of every single prop bet on the board, and understanding snap distribution allows you to spot mispriced lines before the broader betting public catches on to a changing team dynamic. As you build out a reliable workflow for evaluating these weekly matchups, relying on a sophisticated sports forecasting platform can help streamline your research and data gathering.
When a casual sports fan checks the Sunday box scores, they register the final totals as gospel truth about a player's talent level and expected output for the following week. If a backup running back comes into a blowout game in the fourth quarter and rattles off forty rushing yards against prevent defenses, those yards look great on paper on Monday morning. The betting markets often overreact to these surface-level numbers because recreational money flows heavily toward players who just had a big game. Oddsmakers know this human tendency well and will sometimes shade lines upward to trap public bettors who only remember the highlight reel from seven days prior.
The reality of professional football is far more granular and chaotic than a simple list of game-ending statistics. A wide receiver might finish an afternoon with zero catches because the opposing defense bracketed him with double coverage all game, yet he ran a route on every single passing play dialed up by his coordinator. His opportunity metrics remain pristine even though his box score production flatlined, meaning his expected value for the next matchup is much higher than his recent stats suggest. Conversely, another player might haul in a fluky fifty-yard touchdown pass on one of the only three offensive snaps he played all afternoon, creating a totally false impression of heavy involvement. Relying on raw production without context is one of the quickest ways to bleed a bankroll dry over the course of a long season.
Analytical frameworks built on predictive modeling attempt to strip away the noise of random variance to find what actually repeats from week to week. Football is a game of high variance where small sample sizes can easily distort reality. A single missed tackle can turn a two-yard slant into an eighty-yard touchdown, completely skewing a player's efficiency metrics for an entire month. When you evaluate player props through the lens of consistent playing time rather than explosive plays, you stop chasing past results and start focusing on repeatable opportunity. A player who consistently commands an eighty percent snap share is fundamentally safer to back than a part-time player who relies entirely on breaking multiple tackles every time he touches the football.
To turn playing time into a profitable betting angle, you have to break snap counts down into specific positional context rather than looking at a flat percentage of total offensive plays. For running backs, snap share tells you who owns the backfield, but route participation and long-down-and-distance usage tell you who stays on the field when the team is passing the ball. A running back who plays sixty percent of the snaps only on early-down running plays is a very different proposition from a back who stays on the field for passing downs and runs routes out of the backfield. If a team falls behind early in a game script and has to throw every down, that early-down runner will suddenly vanish from the field, destroying any over bet on his rushing yards or total touches.
Wide receivers and tight ends require an even deeper look at route participation alongside raw snap counts. A receiver can be listed as playing ninety percent of the offensive snaps, but if his primary assignment on half of those plays is blocking for the run game, his actual target opportunity is severely limited. Platforms like ATSwins analyze these micro-tendencies by tracking how often a pass catcher actually runs a pass pattern relative to his team's total dropbacks. High route participation combined with a strong target-per-route-run rate points directly toward sustainable production in receiving yardage and reception props. When you find a secondary receiver whose route participation is quietly creeping upward while his team's prop line remains anchored to his old, lower snap share, you have found a textbook market inefficiency.
It is also vital to account for how offensive personnel groupings dictate snap distribution across different game scripts. Teams playing with a lead will often shift toward heavy personnel packages with extra tight ends and fullbacks to burn clock and run the football, altering the expected snap counts for primary slot receivers. Understanding these macro shifts allows analytical modelers to project how game flow will impact playing time before the opening kickoff even takes place. By simulating various game scripts and observing how snap distributions shift under different scoring margins, forecasting tools provide a much clearer picture of what a player's true ceiling and floor look like on any given Sunday.
Every coaching staff in the National Football League operates with distinct personnel philosophies that directly dictate how snap counts are distributed across a roster. Some head coaches prefer a strict bell-cow approach where a single running back handles nearly every meaningful snap from the first quarter to the final whistle, while others favor a committee system that rotates fresh legs into the game every few series. Knowing the tendencies of an offensive coordinator is just as important as knowing the talent level of the players executing the playbook. When a coaching staff makes a subtle shift in philosophy—perhaps due to a veteran player losing a step or a rookie forcing his way onto the field—the betting market often takes a full week or two to catch up to the new reality.
Injuries across an offensive line or at the skill positions also force coaching staffs to alter their formation rates and snap allocations in unexpected ways. When a star left tackle goes down with a multi-week injury, a team might shift from empty-set passing formations to max-protection packages that keep an extra tight end or a blocking back on the field to help chip pass rushers. This structural change causes an immediate ripple effect through the player prop markets, tanking the projected passing volume for the quarterback while potentially boosting the underneath reception props for the safety-valve tight end. Markets are generally efficient at reacting to major star injuries right away, but the downstream effects on secondary roster pieces are frequently mispriced by algorithmic books that rely too heavily on season-long averages.
Staying ahead of these adjustments requires continuous monitoring of weekly practice reports, beat writer observations, and historical coaching adjustments under similar roster constraints. Evaluating how a specific coaching staff handles red zone personnel changes can unearth massive value in touchdown prop markets. Certain coordinators lean heavily on a specific jumbo package near the goal line, meaning a backup tight end or a short-yardage specialist might play only ten total snaps in a game but capture a massive share of the high-value touches inside the five-yard line. Identifying these niche roles gives analytical bettors a significant edge over casual market participants who only look at season-long snap totals.
No matter how thorough your analytical process is or how detailed your snap count models become, professional football remains an inherently chaotic sport governed by heavy doses of luck and short-term variance. A player can log eighty percent of the offensive snaps, run pristine routes all afternoon, and still finish under his yardage prop because his quarterback overthrew him on two wide-open deep balls or suffered an unexpected injury in the second quarter. Advanced forecasting platforms do not attempt to eliminate this uncertainty or promise guaranteed outcomes; instead, they focus entirely on probabilities, fair-line estimates, and identifying discrepancies between model projections and closing market prices.
Understanding the difference between a high-probability outcome and a guaranteed result is what separates disciplined sports analysts from casual recreational handicappers. When an AI sports betting probability model indicates that a wide receiver has a fifty-eight percent probability of clearing his reception prop based on his projected snap share and target rate, it does not mean the bet will win every single time you place it. It means that if you repeatedly find prices that underestimate that true probability over the course of a hundreds-of-bets sample size, mathematical edge will turn a profit. Embracing this long-term statistical mindset helps prevent emotional tilt when a high-probability snap-count bet falls victim to a fluky defensive play or an odd coaching decision in the fourth quarter.
Quantifying model uncertainty also involves testing projections against various defensive schemes and stylistic matchups across the league. A snap count projection that looks rock-solid against a poor run defense might completely fall apart when facing an elite front seven that forces quick three-and-outs and drains a team's total offensive possession time. Factoring in opponent strength, defensive pressure rates, and neutral-script pace of play ensures that your snap-based projections adjust realistically to the specific challenges of each weekly opponent rather than operating in a vacuum of blind historical averages.
Translating snap count data into actionable weekly wagers requires a disciplined routine that starts as soon as the previous week's injury reports and snap sheets become fully available. Experienced bettors begin their weekly prep by reviewing Tuesday snap distributions to identify which roster risers saw their playing time expand and which veterans are quietly losing their grip on starting roles. Once the baseline playing time trends are established, the next step involves mapping those trends against the upcoming opponent's defensive tendencies to project how many total offensive plays a team is likely to run in the game script.
When browsing the weekly prop menus on sports betting apps, look specifically for lines that fail to reflect recent shifts in playing time. If a young wide receiver's snap share has climbed from forty percent to seventy-five percent over the past three weeks due to an injury or a coaching change, but his receiving yardage prop remains pinned to his old low baseline, you have spotted a clear statistical discrepancy. This is where predictive sports analytics tools like those provided by ATSwins help bridge the gap by generating objective fair-line estimates based on multi-variable projections rather than emotional guesswork. By focusing your bankroll exclusively on situations where your projected probability diverges meaningfully from the posted market odds, you build a sustainable, data-driven approach to the NFL season.
Why are snap counts considered a better indicator of success than raw box score stats for NFL player props?
Snap counts measure pure opportunity by showing exactly how many plays a player is on the field to potentially accumulate statistics. Raw box scores can be heavily influenced by fluky long plays, game script blowouts, or unsustainable efficiency that rarely repeats from week to week. By focusing on consistent playing time, analysts can separate genuine role growth from temporary statistical noise.
How do game scripts affect snap counts and player prop outcomes?
Game scripts dictate how an offense operates based on the score and time remaining in a contest. A team playing from far behind will abandon the run game and lean heavily into passing formations, which drastically alters snap distributions by pulling heavy blockers off the field and increasing route participation for slot receivers and pass-catching backs.
Why is route participation more important than total offensive snaps for wide receiver props?
A wide receiver can log a high overall snap percentage while spending most of those plays acting as a run blocker rather than running pass patterns. Route participation tracks how often a receiver is actually sent out on a pass route during team dropbacks, providing a much cleaner correlation to future receptions and receiving yardage totals.
How does ATSwins help bettors evaluate player prop markets?
ATSwins provides advanced sports analytics, player projections, and probability modeling that help users evaluate fair lines against available market odds. Rather than relying on gut feelings, the platform utilizes data-driven simulations and statistical inputs to help sports enthusiasts make informed, disciplined decisions across complex betting markets.