

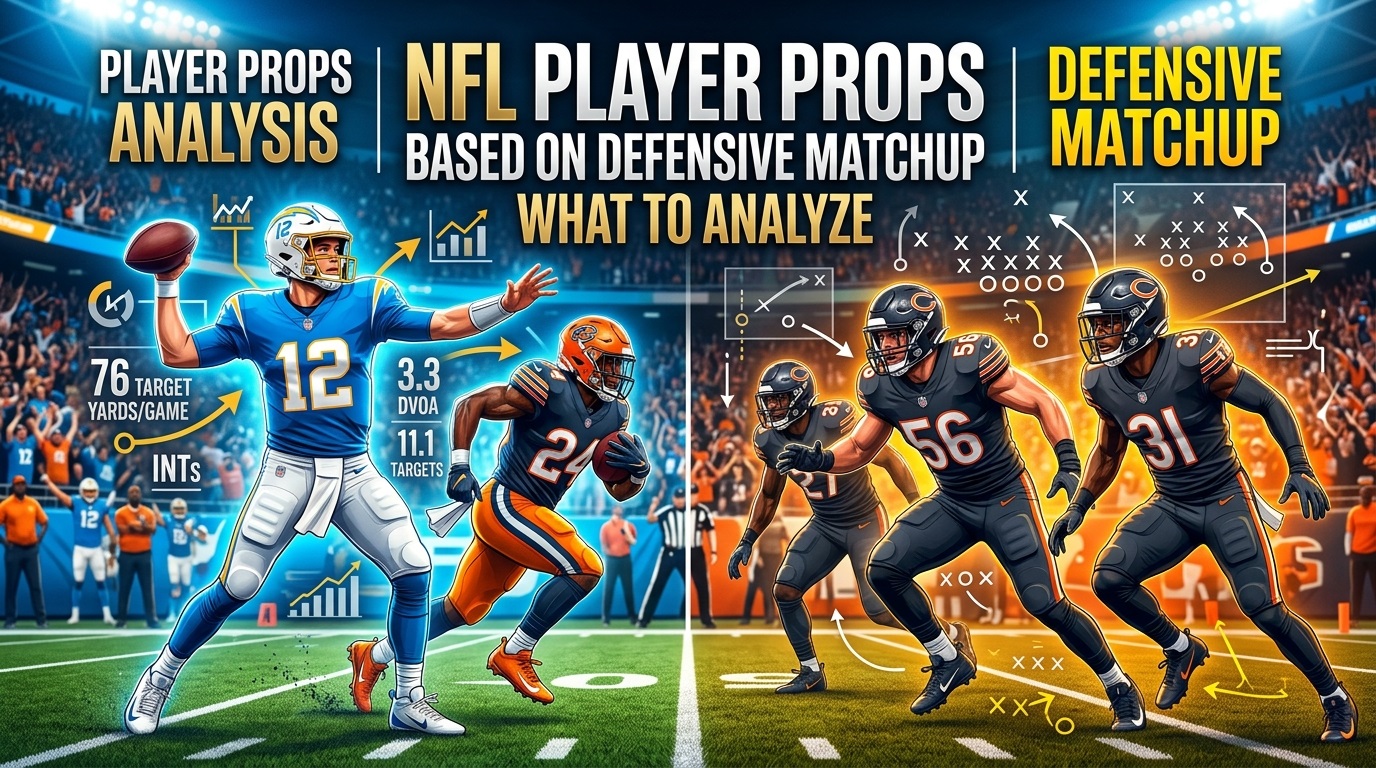
When evaluating NFL player props based on defensive matchup, the first question should not be whether an opponent has a “good” or “bad” defense. The better question is whether that defense creates a favorable environment for the specific player and statistic being projected.
A strong secondary may suppress outside receivers but allow underneath completions to running backs and tight ends. A defense with an excellent overall rushing ranking may still be vulnerable to a particular run concept. A high sack rate may matter for quarterback props, but only if the opposing pass protection and quarterback tendencies give the pass rush enough opportunities.
That distinction is the foundation of useful matchup analysis.
The best NFL player-prop process combines defense-vs-position data with expected volume, player role, recent information, game script, injuries, and the market line. The objective is not to declare that a player will go Over or Under with certainty. It is to estimate a probability and determine whether the available price is reasonable.
Why Defensive Matchup Matters for NFL Props
Player props are more sensitive to matchup context than a simple season average suggests.
A running back's rushing-yard projection depends partly on the defense's ability to stop the run. A receiver's targets and receiving yards depend on coverage, pressure, defensive personnel, and how the offense attacks that coverage. Quarterback passing props are influenced by pass rush, coverage, expected play volume, and game script.
Official NFL statistics illustrate why the defensive side deserves separate attention. The league's 2025 defensive data, for example, shows substantial differences between teams in passing and rushing efficiency. Denver allowed 6.1 yards per pass attempt during the 2025 regular season, while Seattle allowed 3.7 yards per rushing attempt.
Those numbers do not automatically make every quarterback facing Denver an Over candidate or every running back facing Seattle an Under candidate. They establish a baseline.
The player still matters.
A backup running back receiving six carries is not equivalent to a workhorse receiving 20. A receiver with a 25% target share is not equivalent to one with 10%. Matchup analysis becomes useful when it changes the expected output for a player who is actually positioned to exploit or suffer from that matchup.
Defense vs. Position Is Only a Starting Point
One of the easiest ways to analyze NFL player props is to look at defense-vs-position statistics.
The concept is straightforward: compare how much production a defense has allowed to quarterbacks, running backs, wide receivers, or tight ends and use that information as part of the projection.
That is useful, but it has limitations.
Suppose a defense ranks near the bottom of the league in receiving yards allowed to wide receivers. That ranking could result from several different factors:
- It may genuinely struggle in coverage.
- It may face an unusually difficult schedule.
- A few explosive plays may distort the average.
- Injuries may have changed the secondary.
- The defense may be strong against one receiver alignment but weaker against another.
- Game script may force opponents to throw more frequently.
This is why a single ranking should rarely determine a prop projection.
The NFL's official statistical database provides team-level passing, rushing, scoring, and other defensive categories, while more detailed historical databases allow analysts to examine player-level defensive performance.
The useful question is not simply, “Where does this defense rank?”
It is, “Which part of this defense is relevant to this player's expected workload?”
Which Defensive Metrics Matter by Prop Type
Different props require different matchup inputs. There is no universal defensive ranking that works equally well for every market.
Passing-yard props
For quarterback passing yards, start with:
- Opponent pass efficiency
- Yards allowed per attempt
- Pressure and sack production
- Coverage efficiency
- Expected game pace
- Opponent scoring environment
- Expected pass volume
Pressure is particularly important because it can alter both efficiency and volume. A quarterback facing a defense that creates pressure consistently may have fewer clean passing opportunities, while a projected negative game script could simultaneously force more attempts.
That creates an important modeling problem: pressure can hurt efficiency while game script increases volume.
Rushing-yard props
For running backs, examine:
- Rushing yards allowed
- Yards per carry allowed
- Explosive runs allowed
- Success against interior versus perimeter concepts
- Expected rushing volume
- Offensive-line health
- Game-script expectations
The 2025 NFL defensive rushing data shows how different the underlying environments can be. Seattle allowed 1,563 rushing yards at 3.7 yards per carry, while the Giants allowed 2,470 at 5.3.
Those are meaningful historical differences, but they still should not be converted directly into an individual player's expected rushing line.
Receiving-yard and reception props
For receivers and tight ends, consider:
- Coverage efficiency
- Targets allowed
- Completion rate allowed
- Yards after catch allowed
- Explosive pass plays
- Defensive alignment
- Likely coverage assignment
- Player route participation and target share
A receiver's matchup can change dramatically depending on where he actually lines up. A defense's overall performance against wide receivers does not necessarily describe its performance against a slot-heavy receiver.
Touchdown props
Touchdown markets require even more caution.
Touchdowns are relatively high-variance events, so defensive red-zone performance should be combined with offensive scoring opportunities and the player's role near the goal line.
A running back with extensive red-zone and goal-line work has a different touchdown probability from a player who receives most of his touches between the 20s.
A favorable defense can improve the environment without guaranteeing that a particular player receives the scoring opportunity.
Combine Matchup Data With Player Role
The most important upgrade from basic matchup analysis is connecting the defense to expected usage. Snap count is one of the clearest indicators of that opportunity, because a favorable matchup matters much less when a player is only on the field for a limited share of offensive plays. For a deeper look at how playing time can shape player-prop analysis, see NFL Player Props Based on Snap Count: A Better Betting Strategy. Snap count should not be treated as a prediction by itself, but it provides useful context for interpreting targets, routes, carries, and other opportunities.
Consider a hypothetical receiver:
| Input | Player projection |
|---|---|
| Baseline receiving yards | 68 |
| Expected targets | 8.5 |
| Favorable coverage matchup | +4 yards |
| Expected game pace | +3 yards |
| Injury-related uncertainty | -2 yards |
| Adjusted projection | 73 yards |
The numbers above are illustrative, not an ATSwins forecast for a specific player.
The important idea is that the defensive matchup is one input rather than the entire model.
If the receiver's target share suddenly falls because another player returns from injury, the matchup has not changed—but the prop projection should.
The same principle works in reverse. A defense can be vulnerable to running backs, but if the player's team projects to trail by multiple scores, the offense may shift away from the run.
This is why matchup data should be attached to expected opportunity.
Add Game Environment and Injury Context
Defensive matchup analysis becomes much more useful when it is updated with information that changes the expected shape of the game.
Injuries
A defense's season-long numbers may describe a completely different unit from the one taking the field this week.
If a starting cornerback is unavailable, the expected matchup for an outside receiver may change. If an offensive tackle is out, the effect can flow through to quarterback pressure, passing efficiency, and even rushing performance.
Injury information should therefore be treated as a model input, not a footnote.
Game script
A projected favorite may have more rushing opportunity if it controls the game. An underdog quarterback may accumulate passing attempts because his team is forced to throw.
That means the same defensive matchup can support different player-prop outcomes depending on the expected score distribution.
Pace and play volume
More plays create more opportunities for statistics to accumulate.
A defense that is slightly below average against the pass may still be attractive for a passing-yard Over if the game projects for unusually high play volume. Conversely, a favorable efficiency matchup may not produce a large raw-yardage projection if the expected number of plays is low.
Turning a Matchup Into a Projection
A practical NFL player-prop model can be thought of as a sequence rather than a single matchup rating.
Start with the player's baseline expectation.
Then adjust it for the opponent.
Then incorporate expected opportunity.
Then account for the game environment.
Finally, translate the projection into a probability distribution.
For example, imagine a hypothetical running back with a baseline expectation of 76 rushing yards. A weak run defense might increase the mean projection to 81 yards, while a reduced workload expectation might bring it back to 77.
The key output is not simply “77 yards.”
Suppose the model's simulated distribution produces:
- 48% probability of 80+ yards
- 52% probability of fewer than 80 yards
A posted line of 79.5 is therefore a different analytical question from a line of 84.5.
This distinction is critical. A matchup can be favorable while the available line is still too high.
The model should evaluate both the player and the price.
ATSwins.ai's methodology describes this broader approach: its models incorporate context such as injuries, travel, pace, schedule strength, and matchup rates, then translate forecasts into fair prices for comparison with market numbers.
How ATSwins.ai Fits Into the Process
ATSwins.ai is designed around the idea that sports forecasting should be based on structured data rather than a single narrative.
Its NFL platform provides game projections, while the broader methodology includes simulations, fair-line estimates, contextual inputs, and market comparison.
For an NFL player-prop workflow, that philosophy matters because defensive matchup data is only one layer.
A useful process looks something like this:
Baseline → matchup → role → injuries → game environment → simulation → probability → price
The simulation stage is particularly useful for showing how a range of outcomes can develop rather than relying on one predicted stat line. ATSwins also publishes NFL simulation results as part of its broader forecasting platform.
The goal is not to treat a model output as certainty. It is to create a consistent framework for deciding whether a matchup meaningfully changes the expected outcome.
That distinction is important when evaluating NFL player props based on defensive matchup. The best defensive spot in the league is not automatically a good wager if the player has insufficient volume or the market has already priced the matchup into the line.
Common Defensive-Matchup Mistakes
Treating a defense-vs-position ranking as a prediction
Rankings summarize history. They do not know the player's expected workload, the current injury report, or the exact game script.
Use them as context rather than a final answer.
Ignoring offensive usage
A great matchup cannot manufacture targets or carries.
Snap rate, routes, target share, carries, red-zone involvement, and recent role changes should be considered before applying a defensive adjustment.
Overreacting to one game
A defense allowing 150 receiving yards in one week does not necessarily mean it is vulnerable to every receiver.
Small samples are noisy, particularly early in the season.
Confusing matchup quality with betting value
This is one of the biggest analytical errors.
A player may have a favorable matchup and still be priced correctly—or even too aggressively.
The question is not simply whether the player is likely to perform well. It is whether the estimated probability differs enough from the probability implied by the available price.
Using stale defensive data
This is especially relevant at the start of a season.
As of August 24, 2026, the regular season has not begun. The NFL's schedule places the final preseason weekend on August 27-29 and kickoff weekend on September 9-10 and September 13-14.
Early-season models therefore need to balance prior-season information with new personnel, coaching, roster, and role information rather than pretending that a few preseason observations provide a complete defensive profile.
A Better Weekly Workflow for NFL Player Props
A disciplined matchup review can be done in five stages.
1. Identify the player's baseline.
Review recent production, season-long usage, snaps, routes, targets, carries, attempts, and role.
2. Map the defensive matchup.
Look at the specific category relevant to the prop instead of relying on overall defensive ranking.
3. Check for context changes.
Update injuries, depth charts, offensive-line availability, defensive personnel, weather, and expected game script.
4. Build a range, not just a point estimate.
A projection of 72 receiving yards is less informative without knowing the probability of reaching 50, 70, 80, or 100 yards.
5. Compare probability with price.
A strong analytical process can still produce a “pass” when the market price does not justify the estimated edge.
That final step is where matchup research becomes market analysis rather than simple statistical storytelling.
The Practical Meaning of Defensive Matchup Analysis
NFL player props based on defensive matchup are most useful when the defense is treated as one component of a broader projection.
Start with what the player is expected to do. Then ask how the opponent changes those expectations.
A defense's run-stopping ability matters more for a running-back rushing prop than its overall points allowed. Coverage tendencies matter more for a receiver's targets and yardage than a generic defensive ranking. Pass rush can influence quarterback efficiency, but projected attempts and game script still matter.
The strongest process combines these inputs, quantifies uncertainty, and compares the resulting probability with the available market price.
ATSwins.ai follows that general data-first philosophy through projections, simulations, matchup context, and fair-price analysis. For readers who want to move from raw defensive statistics toward a structured forecasting process, the ATSwins NFL projections provide a natural starting point.
NFL Player Prop Matchup FAQ
How important is defensive matchup for NFL player props?
Defensive matchup is an important input, but it should not be used in isolation. The player's expected workload, role, injuries, game script, offensive-line situation, pace, and market price can all change the projection. A favorable defense may increase a player's expected production without making an Over automatically valuable.
What defensive stats are most useful for NFL player props?
The best statistic depends on the prop. Rushing props benefit from run efficiency and explosive-run data. Receiving props can use coverage efficiency, targets allowed, completion rates, and explosive passes. Quarterback props can incorporate pass efficiency and pressure. Touchdown projections should include red-zone context and player opportunity.
Is defense-vs-position data enough to predict an NFL player prop?
No. Defense-vs-position data is a useful starting point, but it does not capture every variable affecting an individual player's result. Defensive personnel, player alignment, offensive usage, injuries, game script, and sample size all matter.
Should recent defensive performance matter more than season-long data?
Often, recent information deserves more weight when there is evidence that the underlying conditions have changed. Examples include injuries, coaching changes, personnel changes, or a meaningful change in scheme. However, a short recent sample can also be noisy, so completely discarding longer-term data can create another form of overreaction.
Can AI improve NFL defensive matchup analysis?
AI and statistical models can process many inputs consistently and simulate a range of outcomes, but they do not eliminate uncertainty. Model quality depends on data quality, appropriate assumptions, calibration, and timely updates. The most useful output is a probability distribution or fair estimate rather than a claim of certainty.
A More Complete Way to Read NFL Matchups
Defensive matchup analysis becomes powerful when it moves beyond labels such as “good defense” and “bad defense.”
The useful question is how a particular defense changes the expected opportunity and efficiency of a particular player in a particular game. That requires combining defensive tendencies with player usage, injuries, game environment, sample size, and the price being evaluated.
For that reason, a favorable matchup should increase attention—not automatically dictate a decision.
ATSwins.ai's broader forecasting framework is built around simulations, contextual inputs, probability, and fair-price comparisons. Those tools can add structure to matchup research while leaving room for uncertainty and the possibility that the best decision is to pass when the numbers do not justify the price.