

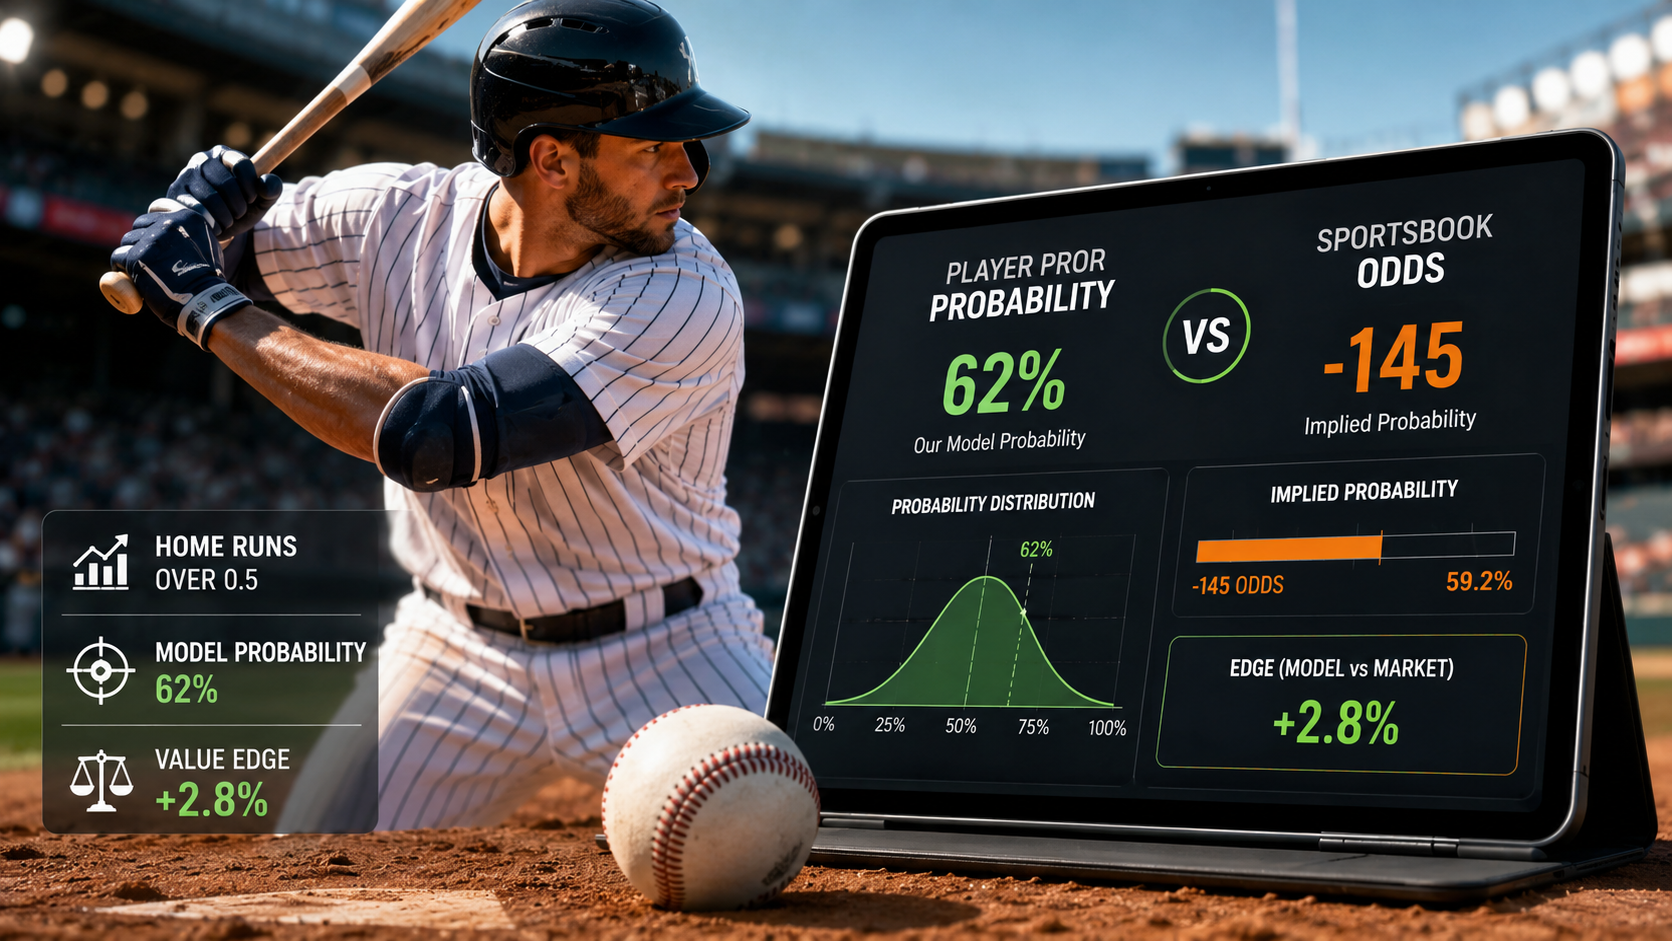
When analyzing an MLB player prop, knowing whether a player is likely to go over or under a line is only part of the equation. The MLB player prop probability vs odds comparison adds another important layer by showing how a statistical projection compares with the price available in the market. A player may have a strong probability of hitting a prop, but that does not automatically mean the available odds offer a favorable price.
For example, an MLB model might estimate that a pitcher has a 58% chance of recording over 5.5 strikeouts, while the available odds imply a probability closer to 50%. That difference gives analysts something measurable to investigate. Instead of relying only on recent performance or intuition, you can compare the model's probability with implied probability, calculate fair odds, and evaluate the size of the pricing difference.
In this article, we'll break down how MLB player prop probability vs odds works, how to convert American odds into implied probability, how models generate player-prop probabilities, and how fair odds can be calculated. We'll also look at a practical MLB example, explain why calibration and uncertainty matter, and show how ATSwins approaches player-prop analysis using data, projections, simulations, and probability
Table of Contents
MLB Player Prop Probability vs Odds: How to Compare Them
Probability vs. Odds in MLB Player Props
How to Calculate Implied Probability From MLB Odds
How an MLB Prop Model Estimates Probability
Turning Model Probability Into Fair Odds
A Worked MLB Player Prop Example
Why Model Calibration Matters
What Can Cause an MLB Prop Probability to Change?
How ATSwins Approaches MLB Player Prop Analysis
Common Mistakes When Comparing MLB Prop Odds and Probability
Reading MLB Player Props as Prices, Not Just Predictions
Conclusion: Use Probability and Price Together
Frequently Asked Questions
MLB Player Prop Probability vs Odds: How to Compare Them
When evaluating an MLB player prop, it is not enough to ask whether a player is likely to go over or under a posted number. The more useful question is how your estimated probability compares with the probability implied by the available odds.
That distinction is important because a player prop can have a relatively high chance of hitting and still be poorly priced. For example, suppose an MLB model estimates that a pitcher has a 55% chance of going over 5.5 strikeouts. If the available odds imply that only a 50% probability is needed to break even, the model and market are assigning different prices to the same outcome.
This is the basic idea behind comparing MLB player prop probability vs odds. You start with a player projection, turn that projection into an estimated probability, convert the betting odds into an implied probability, and then compare the two. The difference can provide useful information about how the market price compares with the model's estimate.
Probability vs. Odds in MLB Player Props
Probability and odds are connected, but they describe different things.
Probability represents the estimated chance that an event happens. If a model gives an MLB pitcher a 60% probability of recording more than 5.5 strikeouts, the model is estimating that the pitcher should clear that number roughly six times out of ten over a sufficiently large number of comparable situations.
Odds represent the price attached to that outcome.
American odds such as +120 or -125 tell you how much money can be won or how much needs to be risked at a particular price. To compare odds with a statistical model, you need to convert those odds into probability.
This creates a common measurement.
The model might estimate a 57% chance of an outcome, while the market price might imply a 52% probability. Instead of comparing a percentage with an odds number, you can compare 57% with 52%.
That makes the difference much easier to evaluate.
Consider a hypothetical hitter with a 55% model probability of recording two or more total bases. If the market price implies a 50% probability, the model is more optimistic than the market. If the market price implies 60%, the market is more optimistic than the model.
The player's projection has not changed. The price has.
That is why analyzing MLB player props requires more than simply identifying which side of a line appears more likely to occur.
How to Calculate Implied Probability From MLB Odds
American odds can be converted into implied probability with relatively simple formulas.
For positive odds, the formula is:
Implied Probability = 100 ÷ (Odds + 100)
For example, odds of +150 produce:
100 ÷ 250 = 40%
So +150 represents an implied probability of approximately 40%.
For negative odds, the formula is:
Implied Probability = Absolute Odds ÷ (Absolute Odds + 100)
At -150, the calculation is:
150 ÷ 250 = 60%
Therefore, -150 represents an implied probability of approximately 60%.
This calculation is useful because it allows you to compare a market price with a model-generated probability.
There is an important qualification, though. Betting markets generally contain a margin, often called the vig or juice. Because of that margin, the implied probabilities across both sides of a market can add up to more than 100%.
For example, imagine one side of a market has an implied probability of 54% and the other side has an implied probability of 52%. Together they equal 106%. The additional 6 percentage points represent part of the market's pricing margin.
Player props can be more complicated because they may involve different prices, alternate lines, and other market structures. As a result, raw implied probability should be treated as a pricing reference rather than an unquestionable measure of the true probability.
How an MLB Prop Model Estimates Probability
The next step is determining where the model probability comes from.
A serious MLB player prop model should not simply look at a player's last few games and make a projection. Different props require different inputs, and the quality of those inputs can have a major effect on the resulting probability.
For a pitcher's strikeout prop, relevant information may include strikeout rate, pitch mix, opposing hitters' strikeout tendencies, expected batters faced, handedness matchups, workload, and lineup composition.
A hitter's total-bases projection may depend on expected plate appearances, contact quality, opposing pitcher characteristics, platoon splits, park conditions, lineup position, and the distribution of possible outcomes.
Home-run props require another layer of analysis because home runs are relatively infrequent events. Exit velocity, launch angle, barrel rates, pitcher characteristics, park factors, and expected opportunities can all influence the projection.
Modern baseball data provides additional information for these types of models. Statcast, for example, includes expected statistics based on characteristics such as exit velocity and launch angle. These metrics can provide additional context when estimating the quality of a player's underlying performance.
The important point is that a player projection should ideally produce more than one expected number.
Suppose an MLB model projects a hitter for 1.7 total bases. That projection alone does not tell you the probability of going over 1.5 total bases.
The model needs to estimate the distribution of possible outcomes.
A simplified projection could estimate a 30% chance of zero total bases, a 25% chance of one, a 22% chance of two, a 13% chance of three, and a 10% chance of four or more.
That means the probability of recording at least two total bases would be 45%.
The 45% probability is the number that matters when comparing the model with the price of an over 1.5 total-bases prop.
Turning Model Probability Into Fair Odds
Once you have a model probability, you can convert it into theoretical fair odds.
For probabilities below 50%, the formula is:
Fair Odds = (100 ÷ Probability) - 100
A 40% probability would therefore correspond to:
100 ÷ 0.40 - 100 = +150
For probabilities above 50%, the formula becomes:
Fair Odds = -100 × Probability ÷ (1 - Probability)
A 60% probability would produce:
-100 × 0.60 ÷ 0.40 = -150
This gives you a theoretical price based on the model's probability.
Imagine an MLB pitcher has a 58% model probability of recording over 5.5 strikeouts.
The model's approximate fair odds would be:
-100 × 0.58 ÷ 0.42 = -138
So the model would consider approximately -138 to be a fair price based on that 58% probability.
Now imagine the market is offering -110.
That creates a noticeable difference between the model's theoretical price and the market price.
However, this does not automatically mean the prop is a good bet. The model itself could be wrong. The probability could be poorly calibrated. A lineup change could affect the matchup. The pitcher could have a lower expected workload than initially projected.
Fair odds should therefore be treated as an analytical reference point rather than a guarantee.
A Worked MLB Player Prop Example
Consider a hypothetical MLB pitcher strikeout prop.
The line is over 5.5 strikeouts, and the available price is +105. An MLB projection model estimates a 53% probability that the pitcher records six or more strikeouts.
First, convert +105 into implied probability.
The calculation is:
100 ÷ (105 + 100) = 48.78%
The market price therefore represents an implied probability of approximately 48.8% before accounting for the broader market margin.
The model, meanwhile, estimates 53%.
The difference between the two estimates is:
53.0% - 48.8% = 4.2 percentage points
That means the model is more optimistic about the outcome than the probability implied by the hypothetical market price.
Now convert the 53% model probability into fair odds.
The calculation is:
-100 × 0.53 ÷ 0.47 = approximately -113
The model's theoretical fair price is therefore around -113.
The hypothetical market is offering +105.
That is a substantial pricing difference.
You can also estimate the expected value using the model probability.
At +105, a $100 stake would produce $105 in profit if the prop wins. If the model's 53% probability is accurate, the simplified expected profit would be:
(0.53 × $105) - (0.47 × $100) = $8.65
Under those assumptions, the theoretical expected profit would be $8.65 per $100 risked.
But there is an important distinction between expected value and individual results.
The pitcher could record four strikeouts even if the model gives the over a 53% probability. That does not necessarily mean the model failed. A 53% probability means the outcome is expected to happen somewhat more often than it does not happen, not that it must occur in the next game.
This is why probability needs to be evaluated over a meaningful sample rather than judged from a single result.
Why Model Calibration Matters
One of the most important concepts in probability-based sports forecasting is calibration.
A model that consistently produces 60% probabilities should ideally see those events occur close to 60% of the time over a sufficiently large and representative sample.
If a model repeatedly assigns 70% probabilities to certain MLB props but those outcomes occur only 55% of the time, the model is too confident.
The reverse can also happen. A model might assign 55% probabilities to a group of outcomes that eventually occur 62% of the time. In that situation, the model may be underconfident.
This is why probability should not simply be treated as a confidence score.
A model saying that one player prop has a 70% probability and another has a 54% probability should be making a meaningful distinction between those two forecasts.
Calibration metrics such as Brier score and log loss can be used to evaluate probabilistic forecasts. They provide information beyond simple win-loss accuracy because they consider the quality of the probabilities themselves.
For MLB player props, this is especially important because many outcomes are highly variable.
A model can be directionally useful while still needing improvement in how it assigns probability.
What Can Cause an MLB Prop Probability to Change?
Player props are particularly sensitive to information that can change shortly before first pitch.
Playing time is one of the biggest variables.
For hitters, expected plate appearances can have a major effect on counting statistics. A player batting near the top of the lineup generally has more opportunities than the same player batting toward the bottom.
Lineup changes can also affect the surrounding matchup. If a key hitter is scratched, the opposing pitcher may face a different sequence of batters. That can change both opportunity and matchup quality.
Pitcher workload is another important consideration. A strikeout projection may look attractive based on the pitcher's historical performance, but that projection can change if there are concerns about pitch count, recent workload, or expected innings.
Weather can matter as well. Wind, temperature, and other environmental conditions can influence offensive production, although the magnitude of the effect depends on the stadium and specific conditions.
Recent performance should also be handled carefully.
A player hitting four home runs over his last seven games may genuinely be showing improved performance, but that short stretch does not automatically represent his new true talent level. A good model needs to distinguish meaningful changes from normal statistical variation.
Data quality creates another challenge.
A model using several metrics that all measure essentially the same underlying skill may accidentally count the same information multiple times. More variables do not necessarily create a better model.
The goal is to identify information that genuinely improves the forecast.
Probability Is More Useful Than a Simple Over or Under Prediction
A basic player-prop prediction might say:
Over 5.5 strikeouts.
That statement is easy to understand, but it leaves out a lot of information.
A probability-based model might instead say:
Over 5.5 strikeouts: 57% probability.
Now you have a much clearer idea of the model's expectation.
But even that number is incomplete without the price.
If the market price requires a 65% probability to break even, the 57% projection tells a different story than it would at a price requiring only 48%.
This is why probability and odds should be evaluated together.
A model does not need to predict every individual result correctly to be useful. The more important question is whether its probabilities are well calibrated and whether its estimates provide a sensible way to compare player projections with market prices.
How ATSwins Approaches MLB Player Prop Analysis
ATSwins focuses on sports forecasting, statistical modeling, player projections, simulations, probability analysis, and market evaluation rather than presenting sports outcomes as guaranteed results.
For MLB player props, that type of framework is useful because the projection should be connected to a probability distribution and then compared with the available market price.
The process can be thought of as a sequence.
First, estimate the player's expected performance.
Next, determine the distribution of possible outcomes.
Then calculate the probability of clearing the specific prop line.
After that, convert the probability into a theoretical fair price.
Finally, compare the fair price with the available market and evaluate how reliable the underlying model is.
This approach creates a much more complete picture than simply asking which player is projected to have the best performance.
ATSwins has also discussed calibrated probabilities and forecasting evaluation methods in its broader sports analytics content. That focus is important because the quality of a model depends not only on whether it gets individual predictions right, but also on whether its probability estimates are trustworthy.
For someone analyzing MLB player props, that distinction can make a significant difference.
A 70% probability should carry considerably more weight than a 52% probability, assuming both probabilities are properly calibrated. At the same time, neither number represents certainty.
Common Mistakes When Comparing MLB Prop Odds and Probability
One common mistake is treating the model probability as a guarantee.
A 60% projection still means the outcome does not occur 40% of the time under the model's assumptions.
Another mistake is ignoring the price.
A player can have a 65% probability of hitting a prop, but that does not tell you whether the available odds are attractive. The price determines the probability required to justify the position.
It is also easy to confuse prediction accuracy with profitability.
A model can correctly predict more winners than losers while still producing poor prices. Conversely, a model does not need to predict every game correctly to produce useful pricing information.
Another issue is failing to update the model when new information becomes available.
An early projection created before a lineup is confirmed may not have the same probability after the official lineup is announced.
Finally, small samples can create false confidence.
If a particular player has cleared a prop in eight of his last ten games, that does not automatically mean he has an 80% probability of doing it again. Historical results need context, and the underlying opportunity and matchup need to be considered.
Reading MLB Player Props as Prices, Not Just Predictions
The central idea behind MLB player prop probability vs odds is simple: a projection and a betting price answer different questions.
A projection estimates what a player is expected to do. Probability puts a number around the range of possible outcomes. Odds establish the market price for that outcome.
The useful comparison happens when those numbers disagree.
That is why implied probability, fair odds, expected value, and calibration are important parts of MLB prop analysis. They turn a simple over-or-under prediction into a more structured evaluation of probability and price.
For ATSwins, this probability-first approach fits the broader goal of applying sports data and predictive analytics to market evaluation. The platform's MLB modeling resources provide additional context for how advanced statistics, player information, and projections can be combined when analyzing player props.
The key takeaway is that a probability is only meaningful when you understand how reliable it is and how it compares with the available price.
MLB games remain unpredictable, and no model can eliminate variance. But comparing estimated probability with implied odds gives analysts a more disciplined way to evaluate player props, identify pricing differences, and understand exactly what a projection is saying.
Conclusion: Use Probability and Price Together
Understanding MLB player prop probability vs odds comes down to comparing two different pieces of information. Your model estimates how likely an outcome is, while the market odds tell you the price being offered for that outcome. Converting the odds into implied probability makes it possible to compare the two directly.
A strong MLB prop analysis should go beyond recent statistics or a simple over-and-under prediction. Player projections, expected playing time, matchup data, pitcher and hitter performance, weather, lineup changes, probability distributions, and model calibration all influence the final estimate. Even when a model identifies a difference between its probability and the market's implied probability, that difference should be treated as an analytical signal rather than a guarantee.
ATSwins.ai focuses on using statistical modeling, projections, simulations, and probability analysis to provide a more structured way to evaluate sports markets. By comparing model probabilities with fair odds and available prices, you can better understand where the numbers agree, where they differ, and how much uncertainty exists behind a particular MLB player prop.
Frequently Asked Questions About MLB Player Prop Probability vs Odds
What is MLB player prop probability?
MLB player prop probability is the estimated chance that a specific player reaches or exceeds a particular statistical outcome. For example, a model could estimate that a pitcher has a 58% probability of recording over 5.5 strikeouts. The probability represents the model's forecast, not a guarantee that the event will happen in the next game.
How do you convert MLB odds into implied probability?
For positive American odds, divide 100 by the odds plus 100. For example, +150 equals approximately a 40% implied probability. For negative odds, divide the absolute value of the odds by that number plus 100. For example, -150 equals approximately a 60% implied probability.
What are fair odds for an MLB player prop?
Fair odds represent the theoretical price corresponding to a particular probability without including a market margin. If an MLB model estimates a 60% probability, the corresponding fair American odds are approximately -150. Comparing those fair odds with the available market price can show how differently the model and market are pricing the same outcome.
Is a higher MLB prop probability always better?
No. Probability needs to be considered alongside price. A player prop with a 65% probability is not automatically attractive if the available odds require an even higher probability to break even. Conversely, a lower-probability outcome can have favorable pricing when the market offers sufficient compensation for the uncertainty.
Why can MLB player prop probabilities change before a game?
Player prop probabilities can change when new information becomes available. Confirmed lineups, injuries, batting order changes, starting-pitcher updates, expected workload, weather, and other matchup factors can affect a player's expected opportunities and performance. This is why projections made well before first pitch may need to be updated as new information arrives.
Does a 60% probability mean an MLB prop will win?
No. A 60% probability means the model estimates the outcome should occur about 60% of the time across a sufficiently large number of comparable situations. The outcome can still fail in an individual game. Probability measures uncertainty rather than eliminating it.
What is the difference between implied probability and model probability?
Implied probability comes from the market odds, while model probability comes from a statistical forecasting system. For example, if +110 odds imply approximately 47.6% and an MLB model estimates a 55% probability, the two sources disagree about the likelihood of the outcome. The difference is useful for analysis, but it does not prove that the model is correct.
Why is calibration important for MLB prop models?
Calibration measures whether a model's probability estimates correspond reasonably well with actual outcomes over time. If a model consistently assigns 70% probabilities to a group of events, those events should occur close to 70% of the time over a sufficiently large sample. A model that is consistently too confident may need recalibration even if its overall prediction accuracy appears reasonable.