

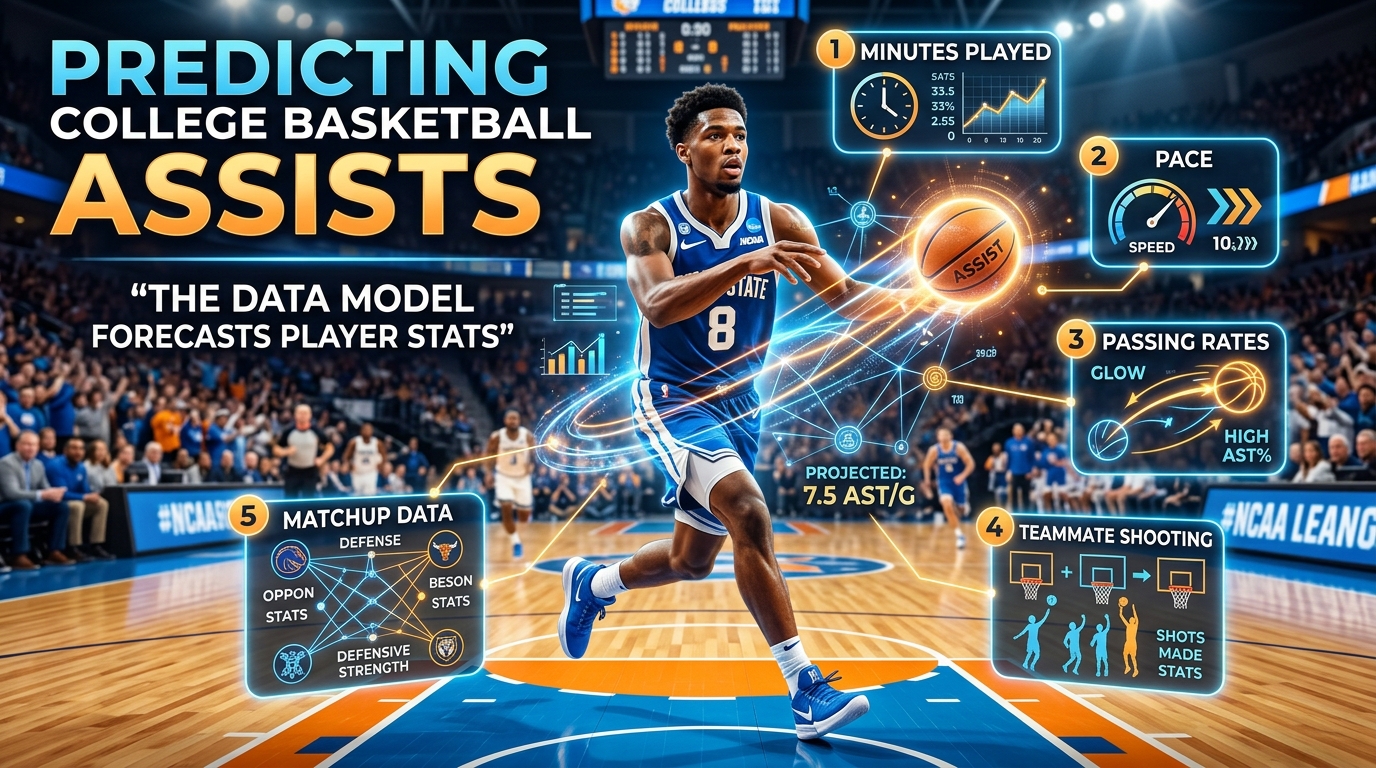
A college basketball player assists prediction model estimates how many assists an individual player is likely to record in an upcoming game by analyzing playing time, offensive responsibilities, team pace, teammate shooting efficiency, and opponent defensive tendencies. Instead of relying entirely on season averages, statistical models evaluate how these factors interact under specific game conditions.
Assists are particularly interesting to forecast because they depend on more than one player's performance. A point guard might create several excellent scoring opportunities, but those opportunities only become official assists when teammates convert their shots and the official scorer credits the pass. That makes assist projections different from simpler individual statistics.
For NCAAB analysis, a reliable model needs to estimate both the number of opportunities a player will receive and the likelihood those opportunities become recorded assists. Understanding that relationship provides a better foundation for player projections, probability estimates, and matchup analysis.
Table of Contents
What Is a College Basketball Player Assists Prediction Model?
The Statistics Behind College Basketball Assist Projections
How AI Estimates Expected Player Assists
Why Matchups and Team Pace Change Assist Projections
A Practical Example of an NCAAB Assist Projection
How to Evaluate Projection Accuracy and Uncertainty
How ATSwins Approaches College Basketball Player Analysis
Frequently Asked Questions
What Is a College Basketball Player Assists Prediction Model?
A college basketball assists prediction model is a statistical forecasting system that estimates the expected assists a player will record during a particular game.
Its purpose is to evaluate the conditions surrounding an individual player's performance rather than simply repeating historical averages.
For example, imagine a starting point guard who averages 5.8 assists per game. That number provides a useful starting point, but it does not tell the entire story. The player might be facing a defense that forces frequent turnovers, playing alongside teammates who have struggled with shooting, or entering a game where the coach expects a smaller rotation.
Each situation can change the expected number of assists.
A forecasting model attempts to account for those differences by combining historical player statistics with game-specific information.
It may examine expected minutes, team possessions, assist percentage, passing responsibilities, teammate field-goal efficiency, opponent defensive performance, and lineup availability.
The final projection might estimate 6.2 assists rather than the player's usual 5.8.
That difference does not mean the player is guaranteed to record six or more assists. It represents an adjusted statistical expectation based on the information available before the game.
There is also an important distinction between assists and potential assists. Potential assists describe passes that create scoring opportunities, while official assists are recorded only when the scoring play meets the statistical criteria.
According to the NCAA's official basketball statisticians' manual, an assist is credited when a player's pass is judged to be the principal contribution directly leading to a field goal or awarded score. Only one assist can be credited on a qualifying field goal. The NCAA Basketball Statisticians' Manual explains these scoring standards.
This distinction is essential because a player can distribute the ball effectively without accumulating as many official assists as expected.
The Statistics Behind College Basketball Assist Projections
A useful NCAAB player assist prediction model needs several different categories of information. No individual statistic consistently explains future assist totals on its own.
Player Minutes and Offensive Responsibilities
Expected playing time is one of the most important inputs.
A starting guard projected to play 34 minutes generally has more opportunities to record assists than a backup guard expected to play 14 minutes.
However, playing time alone does not explain how frequently someone creates scoring opportunities.
A model also needs to identify the player's offensive role.
Primary ball handlers usually initiate possessions, bring the ball into the offensive half, organize plays, and create opportunities for teammates. Secondary guards might spend more time playing off the ball, while forwards sometimes generate assists through post passing, handoffs, and interior playmaking.
Two players with similar minutes can therefore have very different assist expectations.
Assist Percentage and Assist-to-Turnover Ratio
Assist percentage measures the share of teammate field goals a player assists while on the court. It provides a better indication of playmaking responsibility than raw assist totals alone.
Assist-to-turnover ratio adds another layer by comparing assists with turnovers.
A player who consistently creates scoring opportunities while limiting turnovers may demonstrate a more stable playmaking profile than someone whose assist totals fluctuate heavily.
However, these statistics should not be treated as independent guarantees of future performance. They still depend on team structure, opponent quality, and the player's expected role.
Team Shooting Efficiency
This is one of the most overlooked factors in assist forecasting.
A pass does not automatically become an assist. The teammate receiving the ball must convert the scoring opportunity under the applicable statistical rules.
Consider two point guards who each generate eight strong scoring opportunities.
One plays alongside efficient shooters who consistently make open jump shots. The other plays with teammates who struggle to finish around the basket.
Even if both players distribute the ball equally well, their recorded assist totals may differ.
A useful model therefore evaluates teammate shooting percentages, field-goal attempts, shot locations, lineup combinations, and expected shooting efficiency.
Team Pace and Possession Volume
Faster games generally create more opportunities for offensive actions.
A team expected to play more possessions may generate additional passing opportunities, shot attempts, and potential assists.
However, faster pace does not automatically translate into more assists for every player.
A team that plays quickly but relies heavily on isolation scoring may produce fewer assists than a slower team with structured ball movement.
This is why possession estimates need to be combined with offensive style and player responsibilities.
ATSwins has previously discussed this relationship in its analysis of college basketball pace projection models.
How AI Estimates Expected Player Assists
Artificial intelligence models approach assist forecasting by identifying relationships between historical performance and the conditions surrounding individual games.
Instead of assuming that every game resembles the player's previous appearance, the model evaluates multiple variables simultaneously.
A typical modeling framework includes several stages.
Establishing a Player Baseline
The first stage establishes a reasonable estimate of the player's normal assist production.
Historical game logs provide information about assists, minutes, starts, opponent strength, and changes in playing responsibilities.
Recent performance can be useful, but it should not completely replace season-long information.
For example, a player who records nine assists in one game might simply have benefited from an unusually efficient shooting performance from teammates.
A model should avoid treating one exceptional performance as proof that the player's underlying ability has permanently changed.
Rolling averages, season-long statistics, and opponent-adjusted performance can provide a more balanced starting point.
Estimating Expected Minutes
The next stage estimates how much playing time the player is likely to receive.
This estimate should consider starting status, recent rotations, injuries, foul tendencies, coaching decisions, and the possibility of a lopsided game.
Minutes projections deserve particular attention because even an excellent passer cannot generate assists while sitting on the bench.
A player moving from a 22-minute role into a 32-minute starting position may experience a meaningful increase in statistical opportunities.
However, additional minutes do not always produce proportional increases in assists. The player's role during those minutes still matters.
Estimating Assist Opportunities
After establishing expected minutes, the model evaluates how frequently the player creates scoring opportunities.
Useful inputs include:
Historical assist production per minute.
Assist percentage and passing responsibilities.
Expected team possessions.
Offensive role and lineup combinations.
Opponent defensive pressure.
Teammate shooting efficiency.
A model might use regression techniques to estimate expected production, while tree-based algorithms such as gradient boosting can identify more complicated relationships between player roles, opponents, and game environments.
For example, the effect of increased pace may be different for a primary point guard than for a forward who only handles the ball occasionally.
A model needs to recognize those differences rather than applying the same adjustment to every player.
Adjusting for Game-Specific Conditions
The final forecasting stage incorporates information that may change the player's expected performance.
An injured starting shooting guard could increase another player's playmaking responsibilities. A returning point guard might reduce the number of possessions handled by a backup.
Defensive schemes matter too.
Some opponents pressure ball handlers aggressively, potentially increasing turnovers and disrupting offensive possessions. Others allow more penetration but collapse toward the paint, creating opportunities for kick-out passes.
These adjustments should be supported by historical evidence rather than assumptions based on team reputation.
The model then combines its inputs to produce an expected assist total and, ideally, a distribution showing the range of possible outcomes.
Why Matchups and Team Pace Change Assist Projections
College basketball has substantial differences in offensive systems, coaching philosophies, and player responsibilities.
That makes opponent-specific analysis especially important.
A team that aggressively pressures the perimeter can force uncomfortable decisions from opposing guards. Another team may defend conservatively and allow ball handlers more time to organize the offense.
Neither defensive approach automatically creates an over or under assist opportunity.
The model needs to evaluate how the defense influences the specific player's responsibilities.
For example, a team that sends extra defenders toward the primary ball handler might create passing opportunities for teammates. However, if the defense also disrupts passing lanes, the same strategy could reduce successful assists.
Game pace introduces another complication.
A projected increase from 65 to 70 possessions creates more potential offensive actions. But the actual assist impact depends on the number of made field goals, the team's assist tendencies, and the player's involvement.
Opponent strength also needs adjustment.
A guard averaging six assists against weaker defenses should not automatically receive the same projection against a team with stronger perimeter defenders and better defensive communication.
Travel, rest, neutral-site games, and conference familiarity can provide additional context, although these factors should receive meaningful weight only when supported by sufficient historical data.
For readers interested in the broader statistical foundation, ATSwins also discusses college basketball offensive efficiency modeling.
A Practical Example of an NCAAB Assist Projection
Consider a fictional college basketball point guard preparing for an upcoming conference matchup.
His recent season averages are:
Statistical Category | Player Average |
Minutes per game | 32 |
Assists per game | 5.5 |
Potential assists per game | 8.0 |
Turnovers per game | 2.4 |
Team pace | 68 possessions |
These numbers provide an initial picture of his performance.
Now suppose the model evaluates the upcoming matchup and identifies three important changes.
First, the player's expected minutes increase from 32 to 34 because the team's backup guard is unavailable.
Second, the opponent is projected to play at a slightly faster pace, creating additional offensive possessions.
Third, the player's teammates have performed better than average when receiving passes in scoring positions.
After incorporating those conditions, the model produces an illustrative projection of 6.2 assists.
What does the projection actually mean?
It means the model estimates an average outcome of approximately 6.2 assists under its assumptions.
It does not mean the player will record exactly six assists, nor does it establish that an over bet is automatically favorable.
Suppose a hypothetical sportsbook offers an over/under line of 5.5 assists.
The model still needs to estimate the probability of recording at least six assists.
A projected average of 6.2 does not directly establish that probability because two players with the same expected assists can have different distributions of possible outcomes.
One player might consistently record between five and seven assists. Another might alternate between two and ten.
A stronger forecasting system models the entire distribution rather than relying exclusively on the average.
This is where probability analysis becomes more useful than a single projected number.
How to Evaluate Projection Accuracy and Uncertainty
A college basketball player assists prediction model should be evaluated using historical games that were not included in its training data.
Testing a model on the same games used to build it creates an unrealistic picture of forecasting performance.
A proper evaluation uses chronological testing. Historical information trains the model, while later games are reserved for testing.
Several metrics provide useful information.
Mean absolute error (MAE) measures the average difference between projected assists and actual assists. If a model projects 6.0 assists and the player records eight, the absolute error is two.
Root mean squared error (RMSE) penalizes larger forecasting mistakes more heavily. It can reveal whether a model occasionally produces extremely inaccurate projections.
Calibration evaluates whether estimated probabilities match actual frequencies over many observations. If a model assigns a 60% probability to a particular outcome across a large group of comparable predictions, approximately 60% should occur over time.
Distribution coverage examines whether the model's uncertainty intervals contain actual results at the expected frequency.
These measurements provide different perspectives. A model might have a reasonable average projection error while still producing poorly calibrated probabilities.
Sample size also matters.
A college basketball guard with 12 games of meaningful playing time provides less historical evidence than a veteran with multiple seasons of consistent production.
Transfers, freshmen, coaching changes, and new offensive systems create additional uncertainty.
The model should reflect those limitations instead of presenting every projection with the same apparent confidence.
For further background on statistical evaluation, the academic article Alley-Oop! Basketball Analytics in R provides useful context about basketball data and analytical methods.
How ATSwins Approaches College Basketball Player Analysis
ATSwins.ai focuses on sports forecasting, statistical projections, and probability-based analysis across multiple sports, including college basketball.
Its platform includes a player prop projections section covering NCAAB alongside other sports. According to the ATSwins User Guide, these projections use current-season player statistics and display available player projections with confidence grades. The guide also distinguishes these statistical projections from tracked predictions.
That distinction matters when evaluating player performance.
A projected assist total should be treated as an estimate based on available information, not a guarantee about the next game.
For college basketball analysis, the most useful questions involve expected playing time, offensive responsibilities, team pace, opponent tendencies, and the conditions surrounding the player's teammates.
ATSwins also publishes broader research covering AI player prop modeling and the statistical methods used to evaluate player performance.
Readers can use these analytical concepts to better understand why projected numbers change between games and why some player statistics carry more uncertainty than others.
The goal is to approach player performance through measurable information rather than relying entirely on recent box scores or subjective expectations.
Frequently Asked Questions
How does a college basketball player assists prediction model work?
It combines historical player statistics with expected minutes, offensive responsibilities, team pace, teammate shooting efficiency, and opponent defensive tendencies. Statistical algorithms use these inputs to estimate expected assists for an upcoming game. More advanced systems also estimate the probability of reaching specific assist totals rather than producing only one projected number.
What statistics matter most when predicting college basketball assists?
Expected minutes, assists per minute, assist percentage, potential assists, team possessions, and teammate shooting efficiency are particularly useful. Opponent defensive pressure and lineup changes provide additional context. No single statistic explains future assist production, so stronger models evaluate several variables together.
Can AI accurately predict NCAAB player assists?
AI can identify statistical relationships and produce useful estimates, but it cannot eliminate uncertainty. Injuries, foul trouble, coaching decisions, shooting variance, and changes in player responsibilities can affect actual results. Model quality should be evaluated through historical testing, forecast errors, and probability calibration rather than isolated successful predictions.
Why do projected assists change before a college basketball game?
Projections may change when new information becomes available. Starting lineup announcements, player injuries, rotation changes, opponent adjustments, and updated pace expectations can all influence the estimated number of assists. A player expected to handle more possessions after a teammate becomes unavailable may receive a higher projection.
Is a higher projected assist total automatically a good over bet?
No. A higher projected average does not automatically establish favorable value. The probability of exceeding the posted line must be compared with the implied probability of the available odds. The distribution of possible outcomes, pricing, uncertainty, and potential changes in playing time all matter when evaluating a player prop.
Building Better Expectations for College Basketball Assists
Forecasting assists requires a different approach from predicting individual scoring totals. The statistic depends on a combination of player decision-making, offensive opportunities, teammate shooting, and the way an opponent defends.
A reliable college basketball player assists prediction model accounts for these relationships instead of treating season averages as fixed expectations. Expected minutes establish the opportunity baseline, possession estimates describe the game environment, and passing responsibilities help explain how those opportunities translate into recorded assists.
The strongest analytical approach also recognizes uncertainty. A projection is an estimate, not a promise, and its usefulness depends on data quality, realistic assumptions, and consistent historical evaluation.
ATSwins.ai provides a platform for exploring sports projections and player performance analysis. Visit ATSwins to examine its available college basketball analytics and approach upcoming matchups with a more data-driven perspective.