

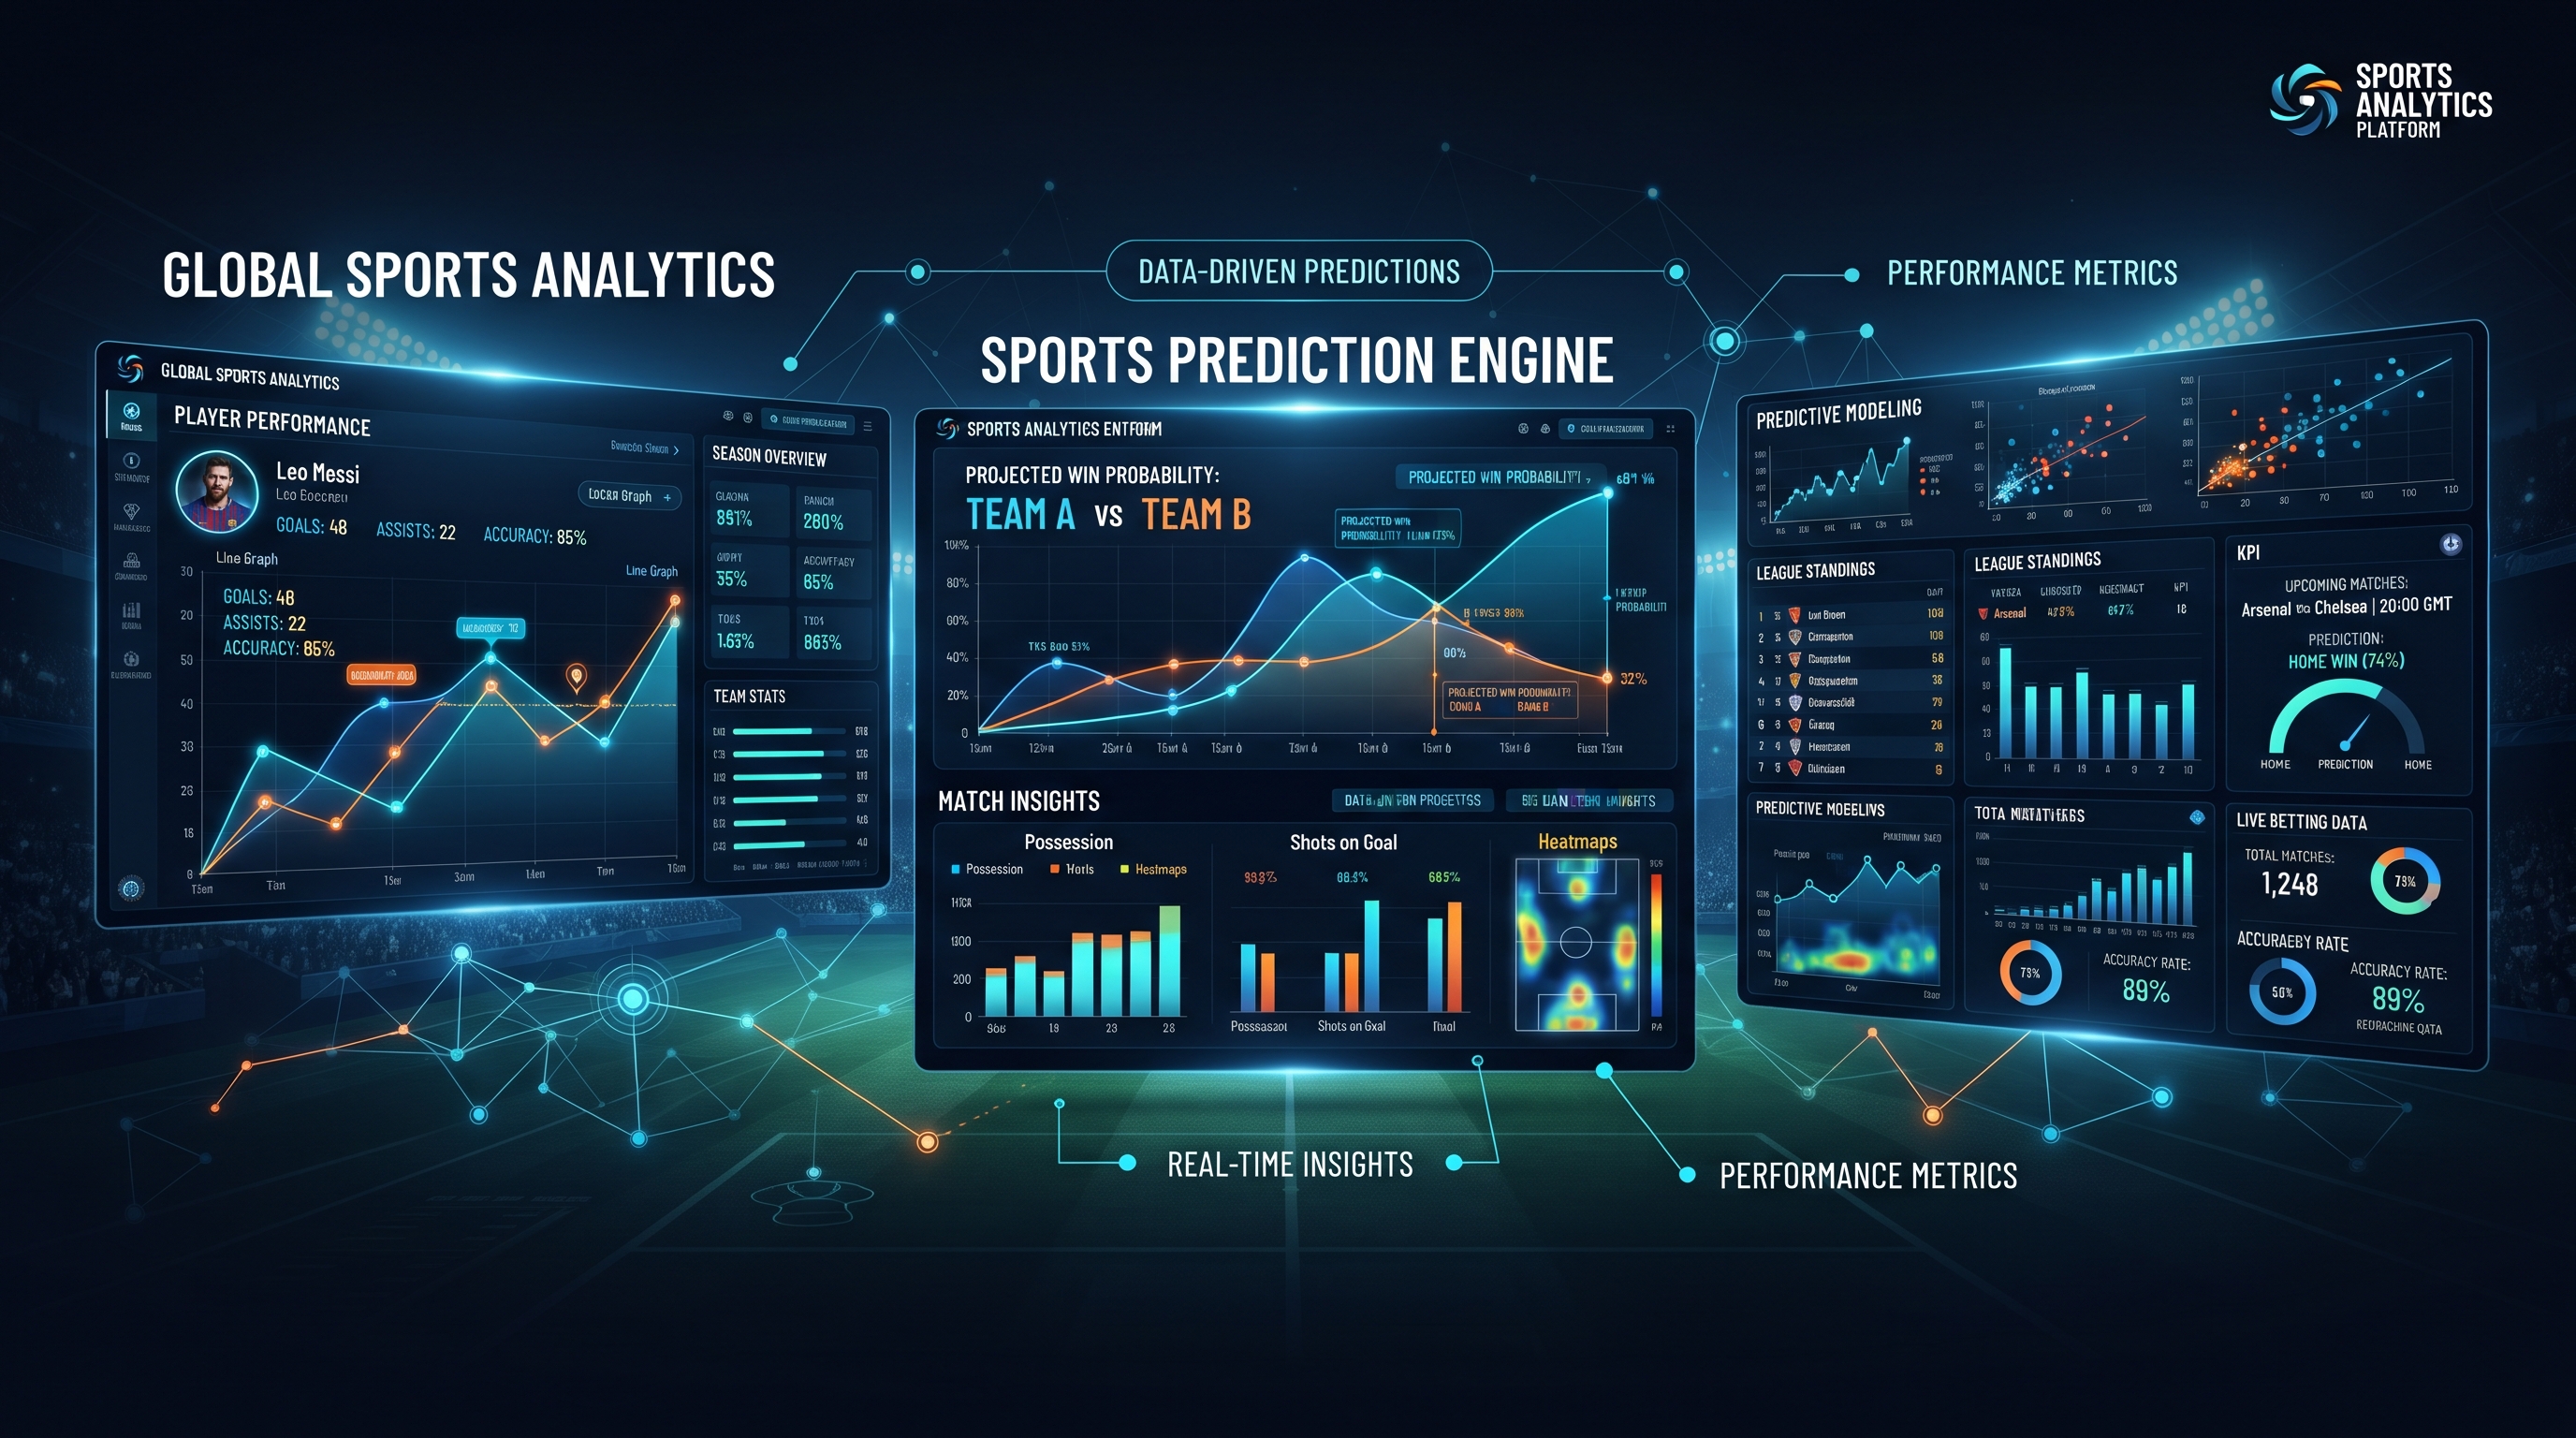
The landscape of modern athletics and sports forecasting has fundamentally shifted. Gone are the days when picking a winning team, forecasting player outputs, or analyzing game outcomes relied solely on gut feeling, loyal fandom, or basic historical averages. Today, advanced platforms lead the charge by turning massive amounts of computational data into sharp, actionable insights.
At the heart of this revolution are sports prediction models. Whether evaluating expected goals ($xG$) in football, player efficiency ratings in basketball, or complex multi-variable regression pipelines across global sports leagues, data science dictates the edge.
However, building a model is only half the battle. The true differentiator of an elite forecasting system lies in its model performance statistics—the rigorous metrics used to measure accuracy, reliability, calibration, and overall profitability. This guide explores how sports prediction model performance statistics work, why they matter, and how advanced analytics platforms harness them to redefine accuracy.
1. The Evolution of Sports Prediction: From Intuition to Big Data
For generations, best sports probability modeling software was qualitative. Analysts looked at a team's last five games, checked if a star player had a sprained ankle, and made a subjective judgment. While human expertise remains invaluable, it is fundamentally limited by cognitive biases, recency bias, and an inability to process millions of data points simultaneously.
Modern sports analytics integrates vast inputs:
Tracking Data: Wearable GPS units tracking player speed, acceleration, workload, and fatigue thresholds in real time.
Contextual Variables: Weather conditions, travel schedules, rest days, referee tendencies, and historical head-to-head performance.
Advanced Metrics: Expected possession value, shot quality metrics, and high-frequency spatial tracking data.
When algorithms ingest these variables, they output a probability distribution rather than a simple binary guess. For instance, instead of predicting that "Team A will win," a sophisticated model states that "Team A has a 64.2% probability of winning, with a 54% likelihood of covering a -3.5 spread."
Evaluating whether that 64.2% figure is trustworthy requires a deep dive into model performance statistics.
2. Core Evaluation Metrics: How We Measure Model Success
To understand how well a sports prediction model performs, data scientists rely on a robust suite of statistical evaluation metrics. Each metric answers a specific question about the model's predictive tendencies.
A. Accuracy, Precision, and Recall
In binary classification models (e.g., Will Team A win or lose?), standard metrics provide a foundational baseline:
Accuracy: The percentage of total match outcomes correctly predicted by the model. While intuitive, accuracy can be misleading if a dataset is heavily skewed toward heavy favorites.
Precision: Out of all the games the model predicted as wins for a specific team, how many actually resulted in wins? High precision means fewer false positives.
Recall (Sensitivity): Out of all the actual winning outcomes that occurred, what percentage did the model successfully capture?
B. Log Loss (Binary Cross-Entropy)
Unlike simple accuracy, which only cares if a prediction was right or wrong, Log Loss evaluates the confidence of the prediction.
If a model assigns a 90% win probability to a team that ultimately loses, it is penalized severely by log loss.
A lower log loss score indicates a model that is not only accurate in its binary choices but also well-calibrated in its probabilistic confidence.
C. Brier Score
The Brier score measures the accuracy of probabilistic predictions. It calculates the mean squared difference between the predicted probability and the actual outcome (0 for loss, 1 for win).
Ranging from 0 to 1, a lower Brier score signifies superior predictive accuracy. It is widely considered the gold standard for evaluating sports forecasting models that output percentage-based win probabilities.
D. Receiver Operating Characteristic (ROC) and Area Under the Curve (AUC)
The ROC-AUC curve visualizes a model's ability to discriminate between classes (e.g., distinguishing between a winning bet and a losing bet across various threshold settings). An AUC of 0.5 represents random guessing, while an AUC closer to 1.0 indicates a model with exceptional discriminatory power.
3. Advanced Statistical Foundations: Under the Hood of Predictive Modeling
To achieve high performance statistics, sports models utilize advanced mathematical and machine learning architectures.
Polynomial and Logistic Regression Frameworks
While simple linear models assume straight-line relationships, sports dynamics are rarely linear. Polynomial regression allows models to capture complex, non-linear relationships—such as how escalating player fatigue curves exponentially increase injury risk or alter scoring efficiency late in a match.
Mathematically, a multi-variable regression model evaluates performance ($y$) based on independent variables ($x$) like player load, historical efficiency, and venue conditions:
Avoiding Overfitting: Cross-Validation
A common trap in sports modeling is overfitting—where a model performs brilliantly on historical training data but fails miserably on future games because it memorized noise rather than true signal.
To combat this, elite platforms implement rigorous cross-validation techniques:
Out-of-Sample Testing: Holding back entire seasons or unseen tournament blocks to test true generalization.
K-Fold Cross-Validation: Splitting historical data into multiple subsets, training on subsets, and validating iteratively to guarantee stable performance metrics across varied conditions.
4. Why Model Performance Statistics Matter for Analytics Platforms
For users engaging with sports forecasting platforms, raw marketing claims of "90% win rates" are often red flags. Real, sustainable sports prediction involves navigating inherent variance, luck, and shifting dynamics. This is why transparent model performance statistics are vital:
Objective Validation: Statistics like Brier scores and log loss remove emotional bias, showing exactly how closely a model's assigned probabilities align with reality.
Bankroll and Risk Management: Knowing a model’s precision and historical drawdown limits allows users to optimize stake sizes and manage risk intelligently.
Continuous Iteration: Performance tracking exposes specific blind spots—such as whether a model struggles with away underdogs or weather-impacted outdoor games—allowing data scientists to refine feature weights.
By focusing on deep statistical validity, top-tier platforms bridge the gap between complex data science and practical, data-driven sports insights.
Frequently Asked Questions (FAQs)
1. What are sports prediction model performance statistics?
Sports prediction model performance statistics are quantitative metrics—such as accuracy, Brier score, log loss, and ROC-AUC—used to evaluate how reliably and accurately a statistical model forecasts athletic outcomes, match winners, and game variables.
2. Why is traditional accuracy not enough to judge a sports model?
Traditional accuracy only measures whether a prediction was right or wrong, ignoring the confidence behind it. For example, predicting a heavy favorite with 90% certainty is very different from predicting an upset with 51% certainty. Metrics like log loss and Brier scores account for this nuance by evaluating probabilistic calibration.
3. How do modern platforms ensure their predictions remain accurate?
Advanced platforms rely on continuous out-of-sample testing, cross-validation, and real-time data ingestion. By regularly measuring model performance against fresh incoming matches, data pipelines can adapt to roster changes, tactical shifts, and league-wide trends.
4. What is a Brier score and why is it important in sports forecasting?
The Brier score measures the accuracy of probabilistic predictions by calculating the mean squared difference between predicted probabilities and actual results. Ranging from 0 to 1, a lower score indicates superior calibration, making it one of the most trusted benchmarks for sports models.
5. Can any sports prediction model achieve 100% accuracy?
No. Sports are inherently unpredictable due to human variance, injuries, officiating decisions, and random chance (often referred to in analytics as stochastic noise). Even the most advanced machine learning models operate within statistical probability ranges rather than absolute certainties.