

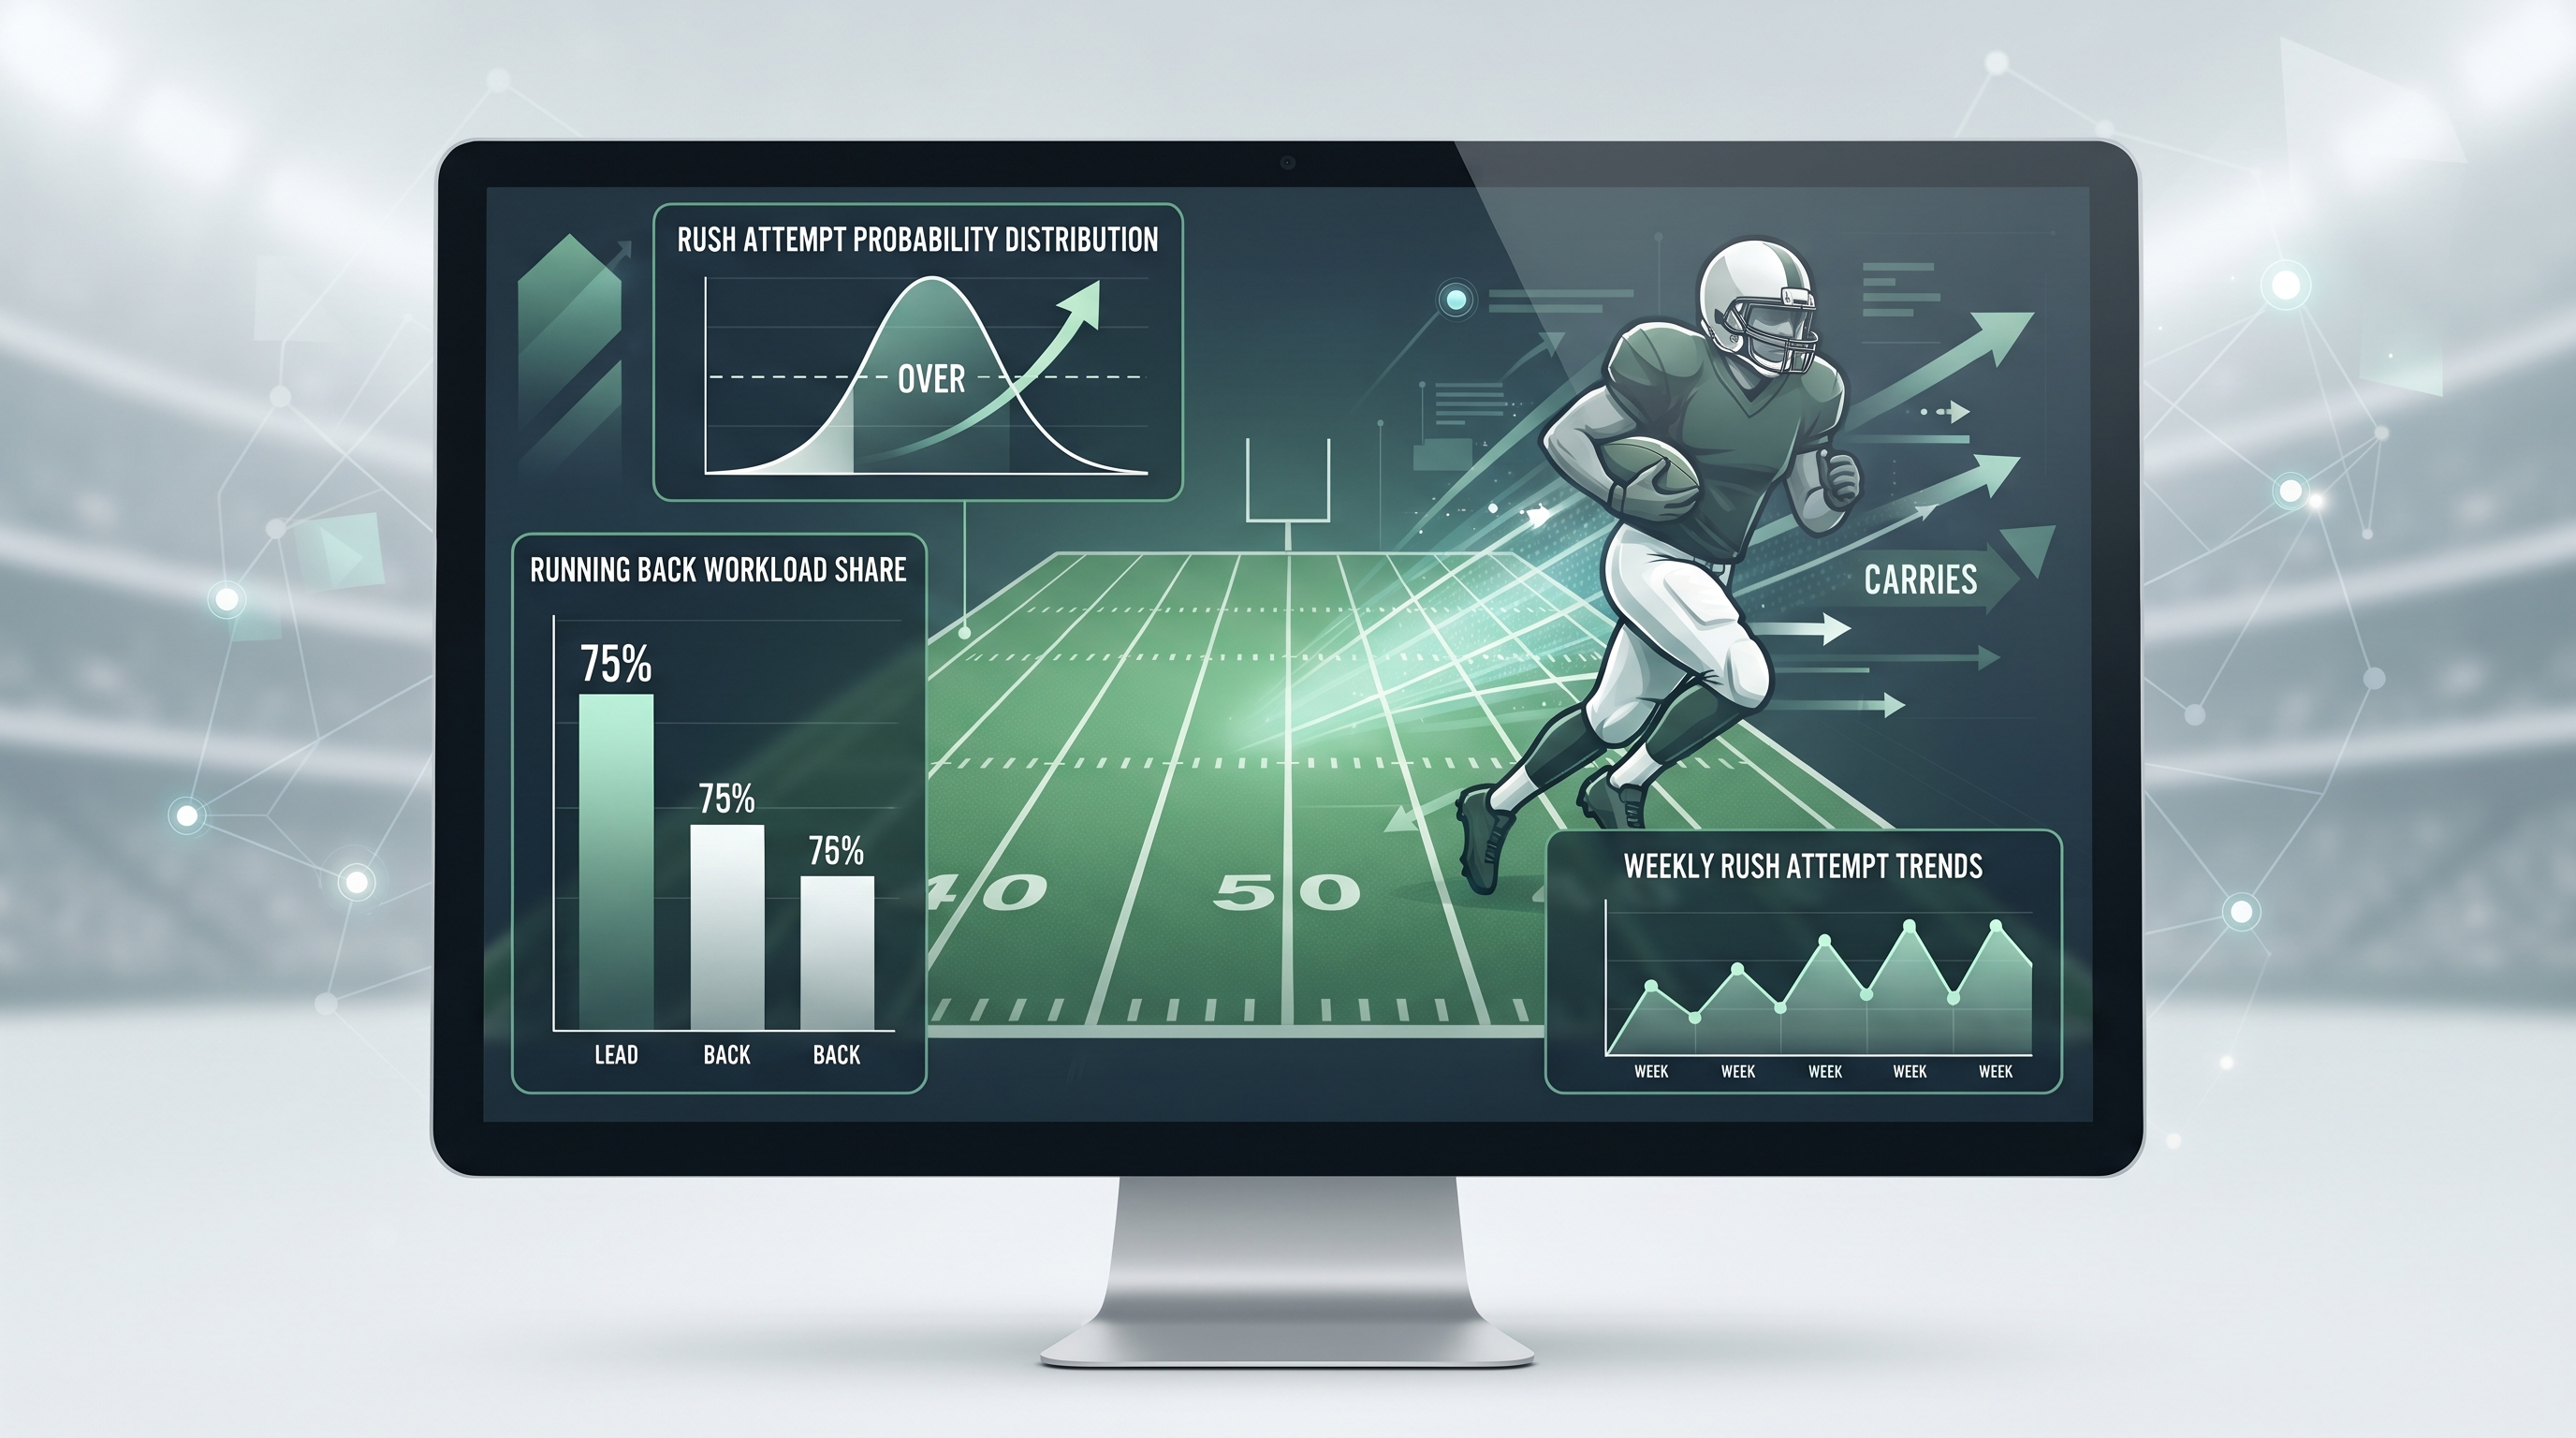
When you sit down to look at a slate of National Football League games, it is really easy to get sucked into the flashing lights of yardage totals and touchdown props. Everyone loves seeing a running back rumble down the sideline for a long score or accumulate massive chunks of real estate on the ground. But if you talk to anyone who spends their weekends knee-deep in sports forecasting and data science, they will tell you that the real sharpness lives in a much simpler, highly repeatable metric. We are talking about volume. Specifically, we are talking about evaluating player props by focusing purely on rushing attempts rather than waiting to see how many yards a player happens to pick up on any given Sunday. Yards can be wildly volatile. A back can have an awful game efficiency-wise, getting tripped up in the backfield multiple times, yet still cruise past his over/under because his team fed him the football twenty-five times to kill the clock. Conversely, a runner can rip off an eighty-yard touchdown on his very first carry, average ten yards a pop, and still stay under his total because his offense abandoned the running game early. That is why shifting your focus toward carry distribution changes everything about how you look at a weekly slate.
To understand why volume is king, you have to look at how offensive playcalling operates on a macro level. Unlike yards, which require blocking, breaking tackles, avoiding lucky ankle taps, and winning open-field footraces, a rushing attempt is almost entirely a function of coaching trust and offensive philosophy. When a coach hands the ball off to a running back, that decision is tied to predetermined game plans, personnel groupings, and down-and-distance tendencies. By studying historical carry shares rather than focusing on explosive plays, analysts can map out a baseline expectation for how many times a player is likely to touch the ball. This is where modern tools from a premier sports forecasting platform come into play. Instead of guessing whether a player will break a long run against a stout defensive front, analytical models ingest thousands of historical snaps to project the baseline number of opportunities a player will receive. Opportunities are stable; outcomes are noisy. A running back who consistently commands seventy percent or more of his team’s backfield work is a much more reliable anchor for a projection model than a flashy backup who needs four broken tackles just to salvage a three-yard gain. When you evaluate the market through the lens of pure usage, you strip away a lot of the chaotic noise that makes football forecasting so frustrating.
One of the biggest factors that influences rushing volume is game script, which is just a fancy way of describing how the flow of a game dictates playcalling choices. If a team enters a matchup as heavy favorites, their probability of establishing a ground game in the second half skyrockets because they want to bleed the clock and protect their lead. On the flip side, if a team falls behind by multiple scores early, their offensive coordinator is forced to abandon the run entirely in favor of pass-heavy hurry-up offenses. Predictive models evaluate these scripts by simulating thousands of potential game outcomes before the opening kickoff. This allows forecasters to see how various point spreads and total projections impact a player’s expected rushing attempts. If a game is projected to be a tightly contested, one-possession battle, the running back on both sides is much more likely to see a stable floor of carries. However, if a massive favorite builds a quick lead, the primary back might get twenty-two carries while the backup sweeps up garbage-time touches. Understanding these nuances requires looking past the raw player stats and examining how team-level pace and opponent defensive tendencies interact. A defense that bleeds yards on the ground might still force an opponent into a pass-heavy approach if that opponent's passing attack is their primary engine. This interplay between defensive strengths, offensive identities, and predicted game scripts forms the foundation of robust player forecasting.
A common trap for casual observers is assuming that high yards-per-carry averages translate directly into high rushing attempt totals or future success. In reality, efficiency is notoriously unstable from week to week. A running back might post an elite seven yards per carry in Week One, but if that production was built on two long runs while he only touched the ball eight times, his baseline is actually quite fragile. Coaches do not reward low-volume efficiency with an immediate bump in workload unless that player demonstrates reliability in pass protection and short-yardage situations. This is why statistical models prioritize volume over efficiency metrics when evaluating props. A player who grinds out three yards a carry on twenty-five touches is infinitely more valuable to an over/under prop investor than a player who gets six yards a carry on eight touches. The twenty-five-touch player has a locked-in role that protects his floor, whereas the eight-touch player is one negative game script away from disappearing completely. When you build probability distributions around these workloads, you begin to see that variance is the enemy of consistency. By focusing on carry projections, you align your analysis with the decisions coaches actually make on the sidelines rather than hoping for a statistical outlier.
Even the most sophisticated forecasting models cannot predict every single snap with absolute certainty, and acknowledging that uncertainty is crucial for disciplined analysis. Football is an inherently chaotic sport plagued by sudden injuries, weather shifts, referee interpretations, and unexpected play calls. A smart analytical approach does not look at a projection as a fixed destiny; instead, it looks at a distribution of possible outcomes. When you rely on an advanced AI sports betting probability model, the output generates a probability range for every single player prop rather than a single static number. If a running back's median projected rushing attempts sit at sixteen and a half, the simulation might show that he hits the over fifty-four percent of the time across ten thousand simulated game iterations. That small edge is where long-term analytical value lives. It is about understanding that variance exists and leveraging predictive sports analytics to find spots where the market price deviates from true mathematical likelihood. Maintaining this kind of disciplined perspective keeps you from overreacting to short-term variance and ensures your analysis stays grounded in sound statistical principles.
Why are rushing attempts considered more stable than rushing yards for player props?
Rushing attempts are primarily driven by coaching decisions, offensive scheme, and game script, making them far more consistent from game to game. Rushing yards, on the other hand, depend heavily on blocking, defender positioning, open-field tackling, and explosive plays, which carry a much higher degree of random variance.
How does game script affect running back carry projections?
Game script dictates whether a team will maintain a balanced offensive attack or abandon the run entirely. Teams leading late in games generally increase their rushing volume to run down the clock, while teams trailing by multiple scores are forced to throw, which directly suppresses running back carry totals.
What role does simulation play in evaluating player props?
Simulation models run thousands of possible game scenarios using historical data, team pacing, and situational tendencies. This process produces a probability distribution rather than a single guess, allowing analysts to identify when market lines misjudge the true likelihood of an over or under outcome.
Can weather conditions impact rushing attempt props?
Yes, severe weather conditions such as heavy rain, snow, or high winds often force coaching staffs to lean more heavily on the running game to minimize handling errors in the passing attack. However, extreme weather can also lead opponents to load the box with defenders, which changes the efficiency landscape even if the raw carry count remains high.
As you refine your approach to evaluating weekly player matchups, remember that sustainable analysis is built on discipline, probability, and a deep respect for uncertainty. By tuning out the noise of explosive yardage highlights and focusing squarely on foundational volume metrics like carry share and game script projections, you can approach the market with a much clearer analytical lens. Whether you are building complex game simulations or simply trying to understand why a specific running back commands a massive share of his offense, grounding your research in data-driven probabilities will always serve you better than chasing fleeting results.