


SOUTH FLORIDA
BULLSUSF
1-1 | Road
80

DEPAUL
BLUE DEMONSDEP
2-0 | Home
82
Key Game
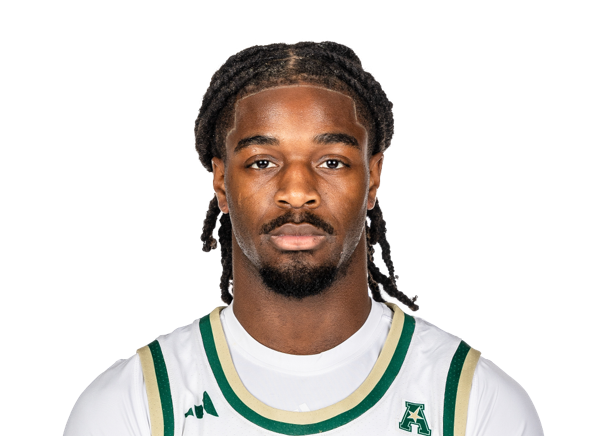
KEY GAME
Josh Omojafo
#8 | Guard@

KEY GAME
Koree Cotton
#4 | Guard| Player | |
|---|---|
| Josh Omojafo | None-None |
| Koree Cotton | None-None |
None-None
W-L
None-None
AI Model Win Probability
BULLS
58%
BLUE DEMONS
42%
▲ Edge: +26.20% (USF)
BULLS
32%
Book Odds: +217
BLUE DEMONS
72%
Book Odds: -261
AI Model Projected Total
AI Projection
146.0
Projected
Book Total
150.5
Over / Under Line
▼
Edge: +4.5 (Under)
Over 150.5
39%
Under 150.5
61%
AI Model Spread Expectation
AI Spread Proj
-6.4
SOUTH FLORIDA
Book Spread
+6
Book Line
▲ Edge: +12.4 points (South Florida)
Spread Distribution
AI Model
-30-20-100+10+20+30
Distribution centered around USF -6.4 expected margin.
Margin of Victory (USF)
USF By 1-7 points
26.6%
USF By 8-14 points
24.7%
DEP By 1-7 points
16.3%
DEP By 8-14 points
6.4%
AI Model Projected Score
South Florida
76.2
SOUTH FLORIDA
Book Implied: 72.20
DePaul
69.8
DEPAUL
Book Implied: 78.20
Simulated Score
South Florida
72
SOUTH FLORIDA
Book Implied: 72.20
DePaul
78
DEPAUL
Book Implied: 78.20
Projections Grades
Moneyline (ML)
Divergence
AI
Bulls
Loss
58% Win Prob
C
Sim
Blue Demons
Win
66% Win Prob
B
Point Spread (ATS)
Agreement
AI
Bulls (+6)
Win
Proj Spread: -6.4
A
Sim
Bulls (+6)
Win
Proj Spread: +6.0
D
Over/Under (Total)
Agreement
AI
u150.5
Loss
Proj Total: 146.0
B
Sim
u150.5
Loss
Proj Total: 150.0
D
Head-to-Head History
Date
Game
Score
Nov 5, 2026
USF @ DEP
80 - 82
Apr 5, 2019
USF @ DEP
77 - 65
Apr 3, 2019
USF @ DEP
96 - 100
Apr 1, 2019
DEP @ USF
61 - 63
Key Model Drivers
Steals (L5)
+48.9% more
South Florida: 12.2
vs
DePaul: 6.2
Rebounding (L5)
+13.7% more
South Florida: 41.7
vs
DePaul: 36.0
Assists (L5)
+8.6% more
South Florida: 15.1
vs
DePaul: 13.8
Free Throw % (L5)
+6.4%
South Florida: 77.4%
vs
DePaul: 71.1%
Post-Mortem Analysis
Metric
Projected
Actual
Score Game
USF Score
76.2
80
DEP Score
69.8
82
Team Stats Splits (Home / Away)
3pt Field Goal %
28.0 / 32.9
44.0 / 35.0
Assists
13.8 / 15.1
19.0 / 17.0
Blocks
4.1 / 3.2
5.0 / 5.0
Field Goal %
38.7 / 44.1
47.0 / 48.0
Free Throw %
71.1 / 77.4
71.0 / 79.0
Rebounding
36.0 / 41.7
31.0 / 30.0
Steals
6.2 / 12.2
3.0 / 6.0
Turnovers
11.3 / 9.0
10.0 / 6.0
Public Market Splits
Moneyline
Open: +205 / -250
→
+217 / -261
↑
Spread (ATS)
Open: +6.5 / -6.5
→
+6 / -6
↓
Total (O/U)
Open: 150.5
→
150.5
Situational Trends
📊 Win-Loss
USF
3-3-0
(50.0%)
Margin: 8.0
ATS +/-: -1.0
DEP
Advantage
5-0-0
(100.0%)
Margin: 24.0
ATS +/-: +7.1
🎯 ATS (Spread)
USF
3-3-0
(50.0%)
Margin: 8.0
ATS +/-: -1.0
DEP
Advantage
3-2-0
(60.0%)
Margin: 24.0
ATS +/-: +7.1
⚖️ Over/Under
USF
3-0-0
O: 100.0% / U: 0.0%
Total +/-: +11.2
DEP
1-3-0
O: 25.0% / U: 75.0%
Total +/-: -7.3
Season to Date Model Accuracy
AI Model
SIM Engine
DEP
USF
DEP
USF
ML
60%
3-2
83%
5-1
80%
4-1
80%
4-1
ATS
40%
2-3
33%
2-4
80%
4-1
40%
2-3
TTL
20%
1-4
50%
3-3
0%
0-5
60%
3-2
Contextual Game News
Kansas Faces Critical Decision on Tyran Stokes' Availability for…
Caleb Wilson's Hand Fracture Shakes Up NBA Rookie of the Year Ra…

Illinois Braces for Extended Absence of Jake Davis After Shoulde…
WVU Basketball 2026-27: Staff Predictions Split on Mountaineers'…

Alabama Basketball Opens Season with Injury Concerns for Two Fre…