



VEGAS
GOLDEN KNIGHTSVGK
9-5-2 | Road
2


BOSTON
BRUINSBOS
11-4-1 | Home
3
Goaltending

GOALTENDER
Carter Hart
#79 | Goaltender@

GOALTENDER
Jeremy Swayman
#1 | Goaltender| Player | W-L-OTL | GAA | SV% | SO |
|---|---|---|---|---|
| Carter Hart | None-None | 1.85 | 0.926 | -- |
| Jeremy Swayman | None-None | 1.85 | 0.913 | -- |
None-None
W-L-OTL
None-None
1.85
GAA
1.85
0.926 Ldr
Save %
0.913
--
SO
--
AI Model Win Probability
GOLDEN KNIGHTS
40%
BRUINS
60%
▲ Edge: +9.80% (BOS)
GOLDEN KNIGHTS
52%
Book Odds: -110
BRUINS
50%
Book Odds: -101
AI Model Projected Total
AI Projection
6.5
Projected
Book Total
6.0
Over / Under Line
▲
Edge: +0.5 (Over)
Over 6.0
50%
Under 6.0
50%
AI Model Spread Expectation
AI Spread Proj
-1.5
BOSTON
Book Spread
+1.5
Book Line
▲ Edge: +3.0 points (Boston)
Spread Distribution
AI Model
+6+4+20-2-4-6
Distribution centered around BOS -1.5 expected margin.
Margin of Victory (BOS)
VGK By 1 goal
9.2%
VGK By 2-3 goals
6.1%
BOS By 1 goal
19.1%
BOS By 2-3 goals
34.1%
AI Model Projected Score
Vegas
2.5
VEGAS
Book Implied: 3.80
Boston
4
BOSTON
Book Implied: 2.20
Simulated Score
Vegas
2
VEGAS
Book Implied: 3.80
Boston
3
BOSTON
Book Implied: 2.20
Projections Grades
Moneyline (ML)
Agreement
AI
Bruins
Win
60% Win Prob
C
Sim
Bruins
Win
69% Win Prob
A
Puck Line (ATS)
Agreement
👑 Top Selection
AI
Bruins (+1.5)
Win
Proj Goals: -1.5
A
Sim
Bruins (+1.5)
Win
Proj Goals: -1.0
A
Over/Under (Total)
Divergence
AI
o6.0
Loss
Proj Total: 6.5
D
Sim
u6.0
Win
Proj Total: 5.0
A
Head-to-Head History
Date
Game
Score
Nov 2, 2026
VGK @ BOS
2 - 3
Jan 22, 2026
VGK @ BOS
3 - 4
Oct 16, 2025
BOS @ VGK
5 - 6
Mar 20, 2025
BOS @ VGK
1 - 5
Feb 8, 2025
VGK @ BOS
4 - 3
Key Model Drivers
Takeaways (L5)
+19.1% more
Boston: 3.6
vs
Vegas: 3.0
Faceoff % (L5)
+10.5%
Boston: 59.9%
vs
Vegas: 49.4%
Shots on Goal (L5)
+10.1% more
Boston: 28.6
vs
Vegas: 26.0
Power Play % (L5)
+41.9%
Vegas: 51.0%
vs
Boston: 9.0%
Post-Mortem Analysis
Metric
Projected
Actual
Score Game
VGK Score
2.5
2
BOS Score
4.0
3
Team Stats Splits (Home / Away)
Blocked Shots
13.2 / 16.7
13.0 / 15.0
Faceoff %
59.9 / 49.4
53.7 / 46.3
Hits
20.5 / 26.3
14.0 / 28.0
Power Play %
9.0 / 51.0
25.0 / 33.3
Shots on Goal
28.6 / 26.0
27.0 / 23.0
Takeaways
3.6 / 3.0
5.0 / 3.0
Public Market Splits
Moneyline
Open: -112 / -108
→
-110 / -101
↓
Spread (ATS)
Open: -1.5 / +1.5
→
-1.5 / +1.5
Total (O/U)
Open: 6.5
→
6
↓
Season to Date Model Accuracy
AI Model
SIM Engine
BOS
VGK
BOS
VGK
ML
73%
16-6
58%
14-10
41%
9-13
46%
11-13
ATS
59%
13-9
42%
10-14
55%
12-10
62%
15-9
TTL
55%
12-10
42%
10-14
45%
10-12
54%
13-11
Contextual Game News
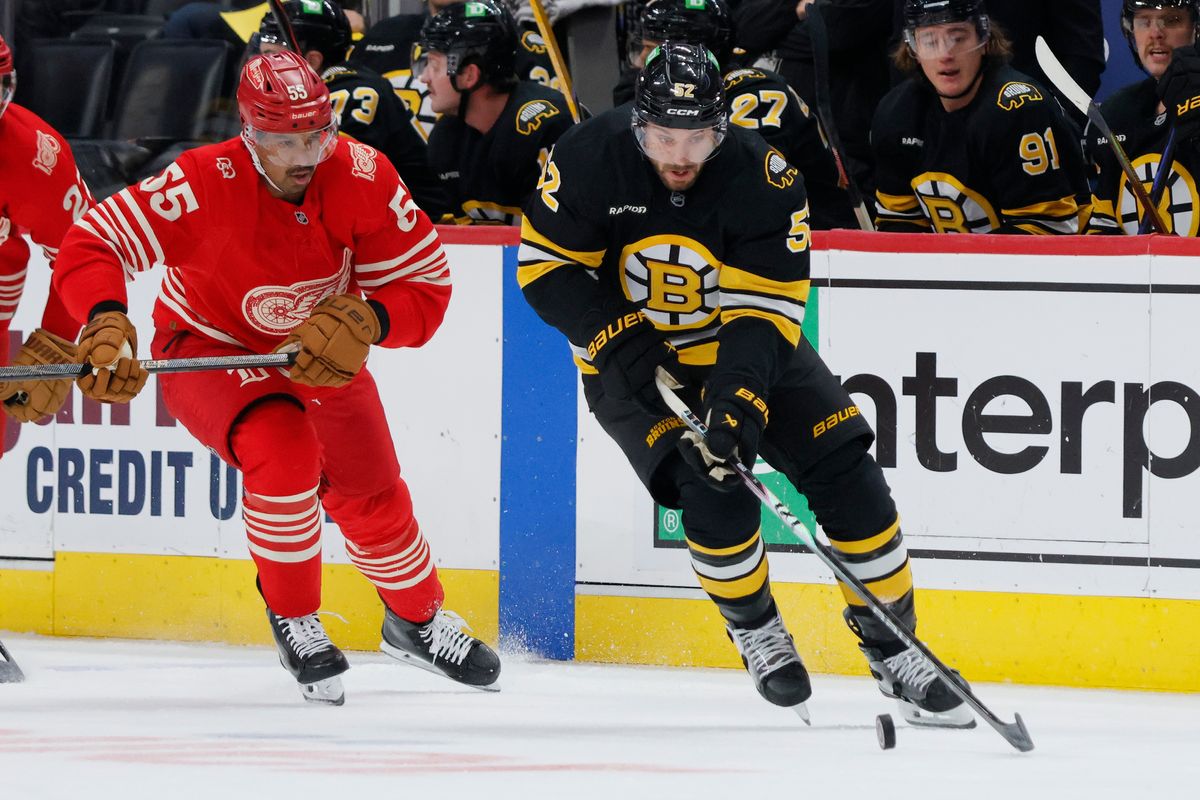
Bruins Spoil Red Wings' Centennial Bash with 4-1 Victory

Bruins Seek Rebound Against Red Wings in Atlantic Division Clash

Boston College Men's Hockey to Honor Johnny Gaudreau with Jersey…
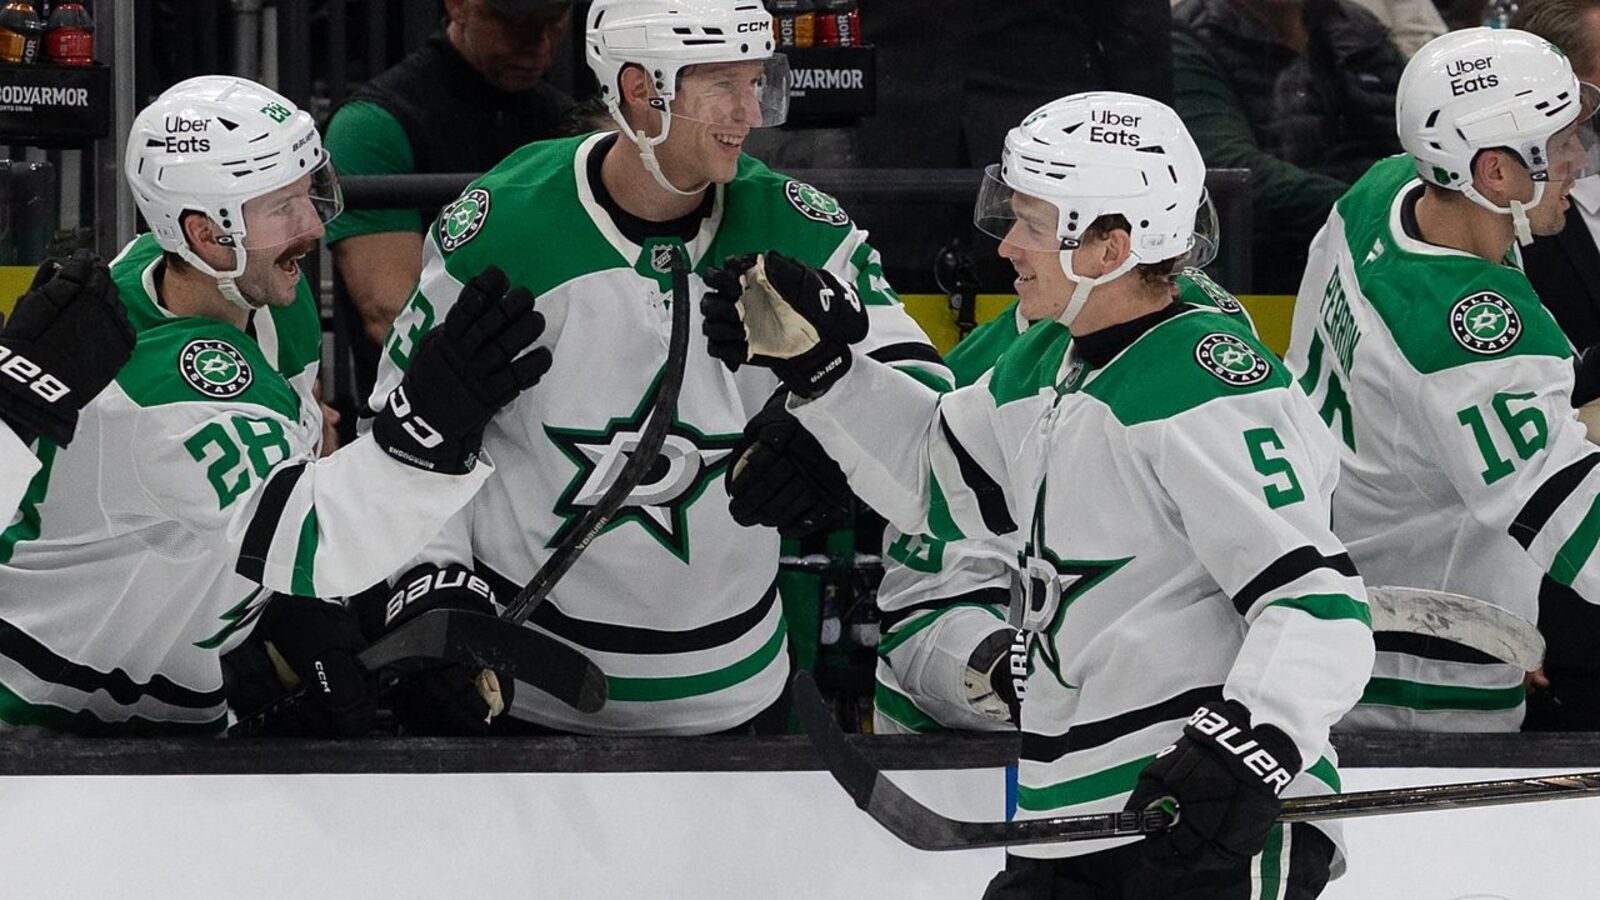
Dallas Stars Stun Vegas with Two Late Goals, Win in OT as Gulutz…
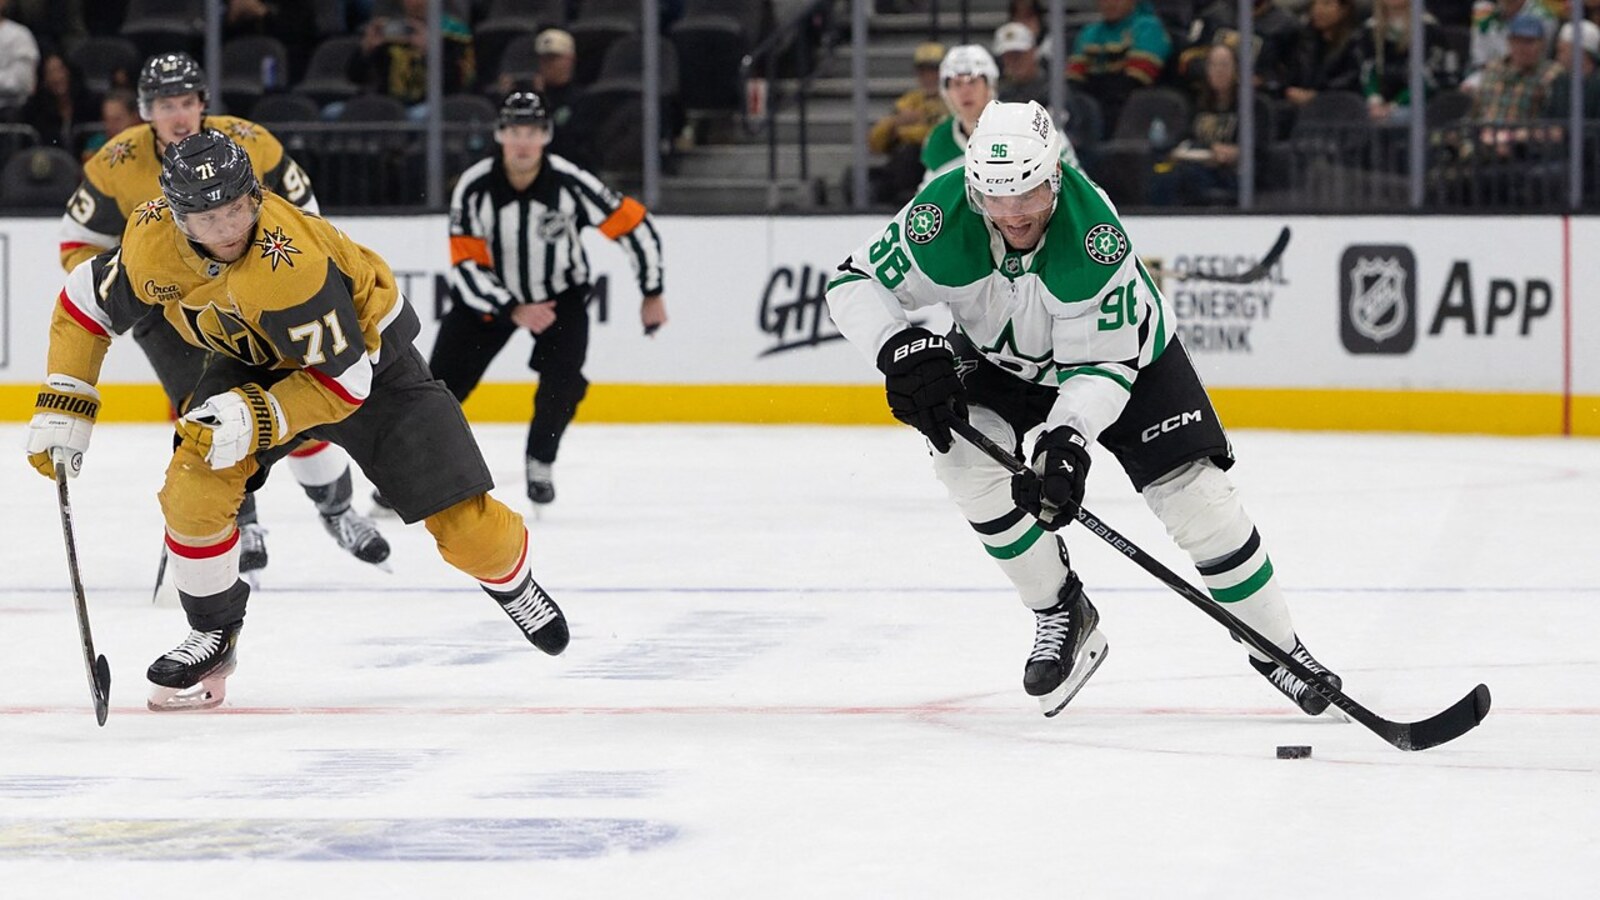
Rantanen's Four-Point Masterclass Lifts Stars Past Golden Knight…