



BOSTON
CELTICSBOS
5-1 | Road
108


ORLANDO
MAGICORL
2-4 | Home
97
Key Game
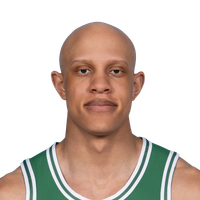
KEY GAME
Jordan Walsh
#27 | Guard@
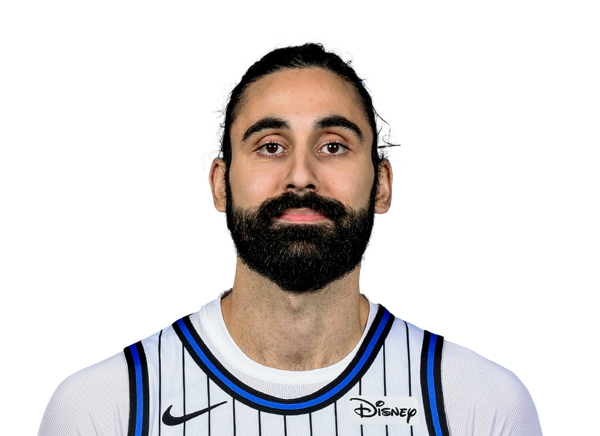
KEY GAME
Goga Bitadze
#35 | Center| Player | |
|---|---|
| Jordan Walsh | None-None |
| Goga Bitadze | None-None |
None-None
W-L
None-None
AI Model Win Probability
CELTICS
73%
MAGIC
27%
▲ Edge: +4.90% (BOS)
CELTICS
68%
Book Odds: -210
MAGIC
34%
Book Odds: +195
AI Model Projected Total
AI Projection
229.5
Projected
Book Total
221.5
Over / Under Line
▲
Edge: +8.0 (Over)
Over 221.5
65%
Under 221.5
35%
AI Model Spread Expectation
AI Spread Proj
-7.5
BOSTON
Book Spread
-6.5
Book Line
▲ Edge: +1.0 points (Boston)
Spread Distribution
AI Model
-30-20-100+10+20+30
Distribution centered around BOS -7.5 expected margin.
Margin of Victory (BOS)
BOS By 1-7 points
25.8%
BOS By 8-14 points
25.8%
ORL By 1-7 points
14.5%
ORL By 8-14 points
5.3%
AI Model Projected Score
Boston
118.5
BOSTON
Book Implied: 114
Orlando
111
ORLANDO
Book Implied: 107.50
Simulated Score
Boston
101
BOSTON
Book Implied: 114
Orlando
95
ORLANDO
Book Implied: 107.50
Projections Grades
Moneyline (ML)
Agreement
👑 Top Selection
AI
Celtics
Win
73% Win Prob
A
Sim
Celtics
Win
67% Win Prob
B
Point Spread (ATS)
Divergence
AI
Celtics (-6.5)
Win
Proj Spread: -7.5
D
Sim
Magic (+6.5)
Loss
Proj Spread: +6.0
C
Over/Under (Total)
Divergence
👑 Top Selection
AI
o221.5
Loss
Proj Total: 229.5
A
Sim
u221.5
Win
Proj Total: 196.0
A
Head-to-Head History
Date
Game
Score
Nov 16, 2026
ORL @ BOS
115 - 105
Nov 1, 2026
BOS @ ORL
108 - 97
Apr 12, 2026
ORL @ BOS
108 - 113
Nov 23, 2025
ORL @ BOS
129 - 138
Nov 9, 2025
BOS @ ORL
111 - 107
Key Model Drivers
Steals (L5)
+19.2% more
Boston: 8.6
vs
Orlando: 6.9
Rebounding (L5)
+15.9% more
Boston: 44.4
vs
Orlando: 37.4
Blocks (L5)
+64.9% more
Orlando: 5.0
vs
Boston: 3.1
Turnovers (L5)
+22.2% more
Orlando: 16.5
vs
Boston: 13.5
Post-Mortem Analysis
Metric
Projected
Actual
Score Game
BOS Score
118.5
108
ORL Score
111.0
97
Team Stats Splits (Home / Away)
3pt Field Goal %
38.9 / 34.0
36.0 / 27.0
Assists
26.0 / 27.5
24.0 / 29.0
Blocks
5.0 / 3.1
2.0 / 7.0
Field Goal %
45.9 / 47.3
42.0 / 44.0
Free Throw %
78.4 / 76.2
79.0 / 85.0
Rebounding
37.4 / 44.4
43.0 / 41.0
Steals
6.9 / 8.6
6.0 / 9.0
Turnovers
15.9 / 15.2
18.0 / 13.0
Public Market Splits
Moneyline
Open: -265 / +224
→
-210 / +195
↑
Spread (ATS)
Open: -6.5 / +6.5
→
-6.5 / +6.5
Total (O/U)
Open: 223.5
→
221.5
↓
Situational Trends
📊 Win-Loss
BOS
Advantage
11-4-0
(73.3%)
Margin: 10.5
ATS +/-: +2.6
ORL
6-8-0
(42.9%)
Margin: -3.4
ATS +/-: -2.5
🎯 ATS (Spread)
BOS
Advantage
8-7-0
(53.3%)
Margin: 10.5
ATS +/-: +2.6
ORL
6-8-0
(42.9%)
Margin: -3.4
ATS +/-: -2.5
⚖️ Over/Under
BOS
5-10-0
O: 33.3% / U: 66.7%
Total +/-: -3.4
ORL
7-7-0
O: 50.0% / U: 50.0%
Total +/-: -1.1
Season to Date Model Accuracy
AI Model
SIM Engine
ORL
BOS
ORL
BOS
ML
57%
8-6
80%
12-3
64%
9-5
87%
13-2
ATS
50%
7-7
50%
7-7-1
64%
9-5
29%
4-10-1
TTL
50%
7-7
33%
5-10
64%
9-5
47%
7-8
Contextual Game News

Mike Boynton Jr. Witnesses Former Michigan Stars and Boss Clash …

Nuggets Overcome 17-Point Deficit to Stun Celtics in Primetime

LeBron James Shrugs Off Injury Scares and Criticism, Delivers Cl…
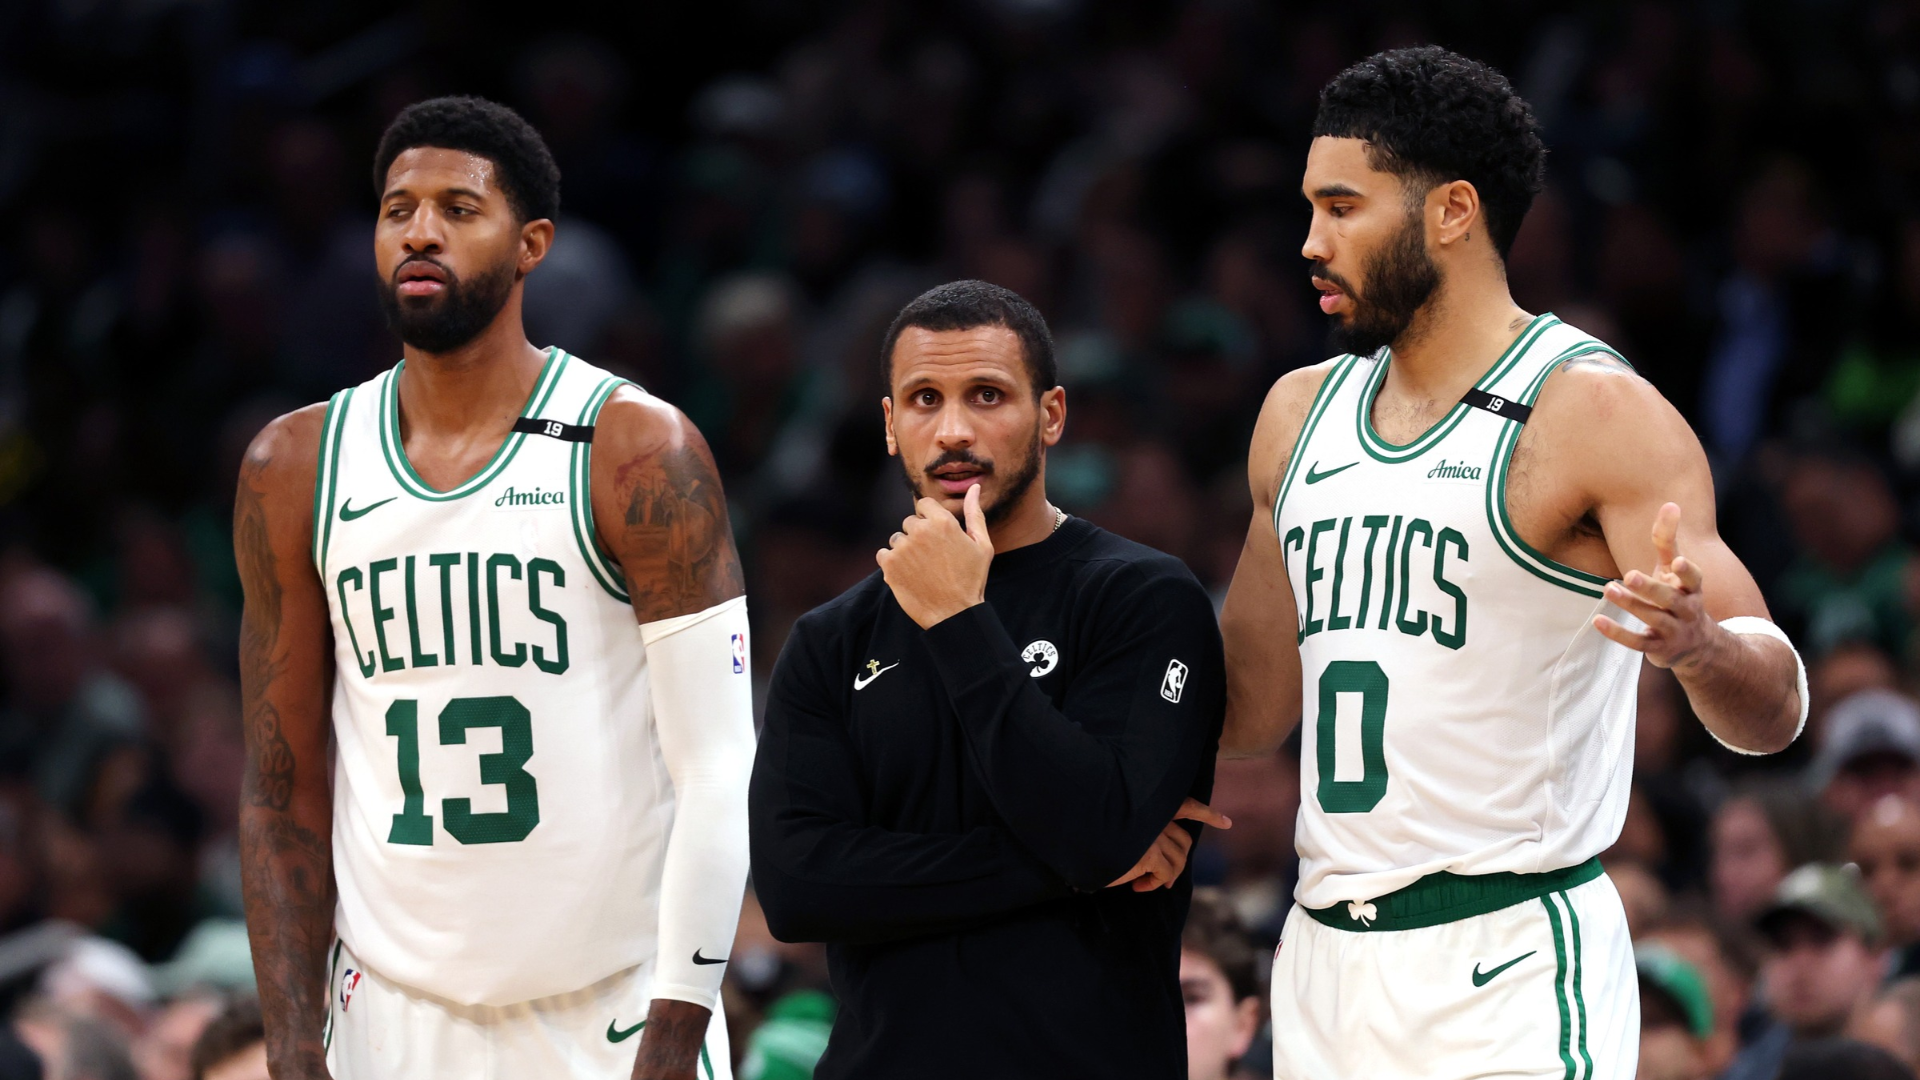
Paul George Says He's 'Not One of Those Guys That Have to Have a…

Draymond Green: Warriors Rookie Yaxel Lendeborg Facing Unfair Pr…