



MINNESOTA
TIMBERWOLVESMIN
4-3 | Road
111


SAN ANTONIO
SPURSSA
4-2 | Home
121
Key Game
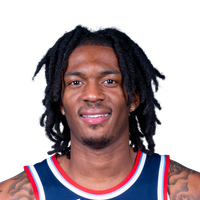
KEY GAME
Bones Hyland
#8 | Guard@
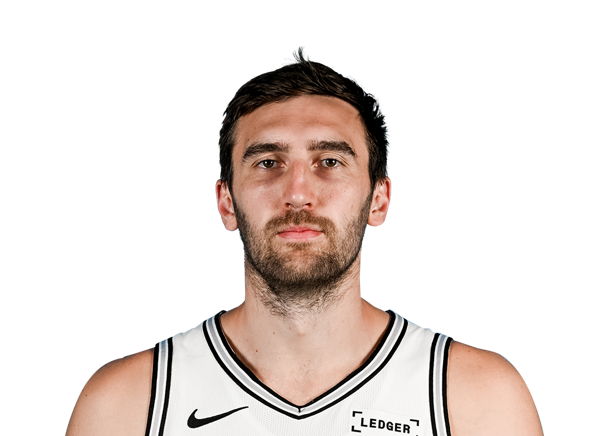
KEY GAME
Luke Kornet
#7 | Center| Player | |
|---|---|
| Bones Hyland | None-None |
| Luke Kornet | None-None |
None-None
W-L
None-None
AI Model Win Probability
TIMBERWOLVES
32%
SPURS
68%
▲ Edge: +14.40% (MIN)
TIMBERWOLVES
17%
Book Odds: +476
SPURS
86%
Book Odds: -607
AI Model Projected Total
AI Projection
217.5
Projected
Book Total
230.0
Over / Under Line
▼
Edge: +12.5 (Under)
Over 230.0
28%
Under 230.0
72%
AI Model Spread Expectation
AI Spread Proj
+3.5
MINNESOTA
Book Spread
+12.5
Book Line
▲ Edge: +9.0 points (Minnesota)
Spread Distribution
AI Model
+30+20+100-10-20-30
Distribution centered around MIN +3.5 expected margin.
Margin of Victory (MIN)
MIN By 1-7 points
20.9%
MIN By 8-14 points
10.0%
SA By 1-7 points
27.3%
SA By 8-14 points
20.9%
AI Model Projected Score
Minnesota
107
MINNESOTA
Book Implied: 108.80
San Antonio
110.5
SAN ANTONIO
Book Implied: 121.20
Simulated Score
Minnesota
99
MINNESOTA
Book Implied: 108.80
San Antonio
103
SAN ANTONIO
Book Implied: 121.20
Projections Grades
Moneyline (ML)
Agreement
AI
Spurs
Win
68% Win Prob
A
Sim
Spurs
Win
61% Win Prob
C
Point Spread (ATS)
Agreement
👑 Top Selection
AI
Timberwolves (+12.5)
Win
Proj Spread: +3.5
A
Sim
Timberwolves (+12.5)
Win
Proj Spread: +4.0
A
Over/Under (Total)
Agreement
👑 Top Selection
AI
u230.0
Loss
Proj Total: 217.5
A
Sim
u230.0
Loss
Proj Total: 202.0
A
Head-to-Head History
Date
Game
Score
Oct 31, 2026
MIN @ SA
111 - 121
May 15, 2026
SA @ MIN
139 - 109
May 12, 2026
MIN @ SA
97 - 126
May 10, 2026
SA @ MIN
109 - 114
May 8, 2026
SA @ MIN
115 - 108
Key Model Drivers
Steals (L5)
+26.3% more
San Antonio: 10.4
vs
Minnesota: 8.2
Blocks (L5)
+24.8% more
San Antonio: 6.0
vs
Minnesota: 4.8
Free Throw % (L5)
+11.9%
San Antonio: 77.6%
vs
Minnesota: 65.7%
Turnovers (L5)
+15.6% more
Minnesota: 14.9
vs
San Antonio: 12.6
Post-Mortem Analysis
Metric
Projected
Actual
Score Game
MIN Score
107.0
111
SA Score
110.5
121
Team Stats Splits (Home / Away)
3pt Field Goal %
35.8 / 38.1
37.0 / 27.0
Assists
29.2 / 28.8
24.0 / 23.0
Blocks
6.0 / 4.8
9.0 / 2.0
Field Goal %
46.4 / 48.5
49.0 / 43.0
Free Throw %
77.6 / 65.7
81.0 / 85.0
Rebounding
46.3 / 46.4
49.0 / 38.0
Steals
10.4 / 8.2
6.0 / 11.0
Turnovers
12.6 / 14.9
16.0 / 14.0
Public Market Splits
Moneyline
Open: +390 / -521
→
+476 / -607
↑
Spread (ATS)
Open: +11.5 / -11.5
→
+12.5 / -12.5
↑
Total (O/U)
Open: 227.5
→
230
↑
Situational Trends
📊 Win-Loss
MIN
11-5-0
(68.8%)
Margin: 9.8
ATS +/-: +7.2
SA
Advantage
13-3-0
(81.3%)
Margin: 11.3
ATS +/-: -0.8
🎯 ATS (Spread)
MIN
Advantage
12-4-0
(75.0%)
Margin: 9.8
ATS +/-: +7.2
SA
6-10-0
(37.5%)
Margin: 11.3
ATS +/-: -0.8
⚖️ Over/Under
MIN
6-10-0
O: 37.5% / U: 62.5%
Total +/-: -7.3
SA
5-11-0
O: 31.3% / U: 68.8%
Total +/-: -3.9
Season to Date Model Accuracy
AI Model
SIM Engine
SA
MIN
SA
MIN
ML
81%
13-3
62%
10-6
75%
12-4
75%
12-4
ATS
56%
9-7
69%
11-5
25%
4-12
56%
9-7
TTL
50%
8-8
50%
8-8
50%
8-8
38%
6-10
Contextual Game News

Eight Under-the-Radar Seniors Poised for Breakout High School Ba…

Golden State's Road Woes Reach Historic Lows Without Stephen Cur…
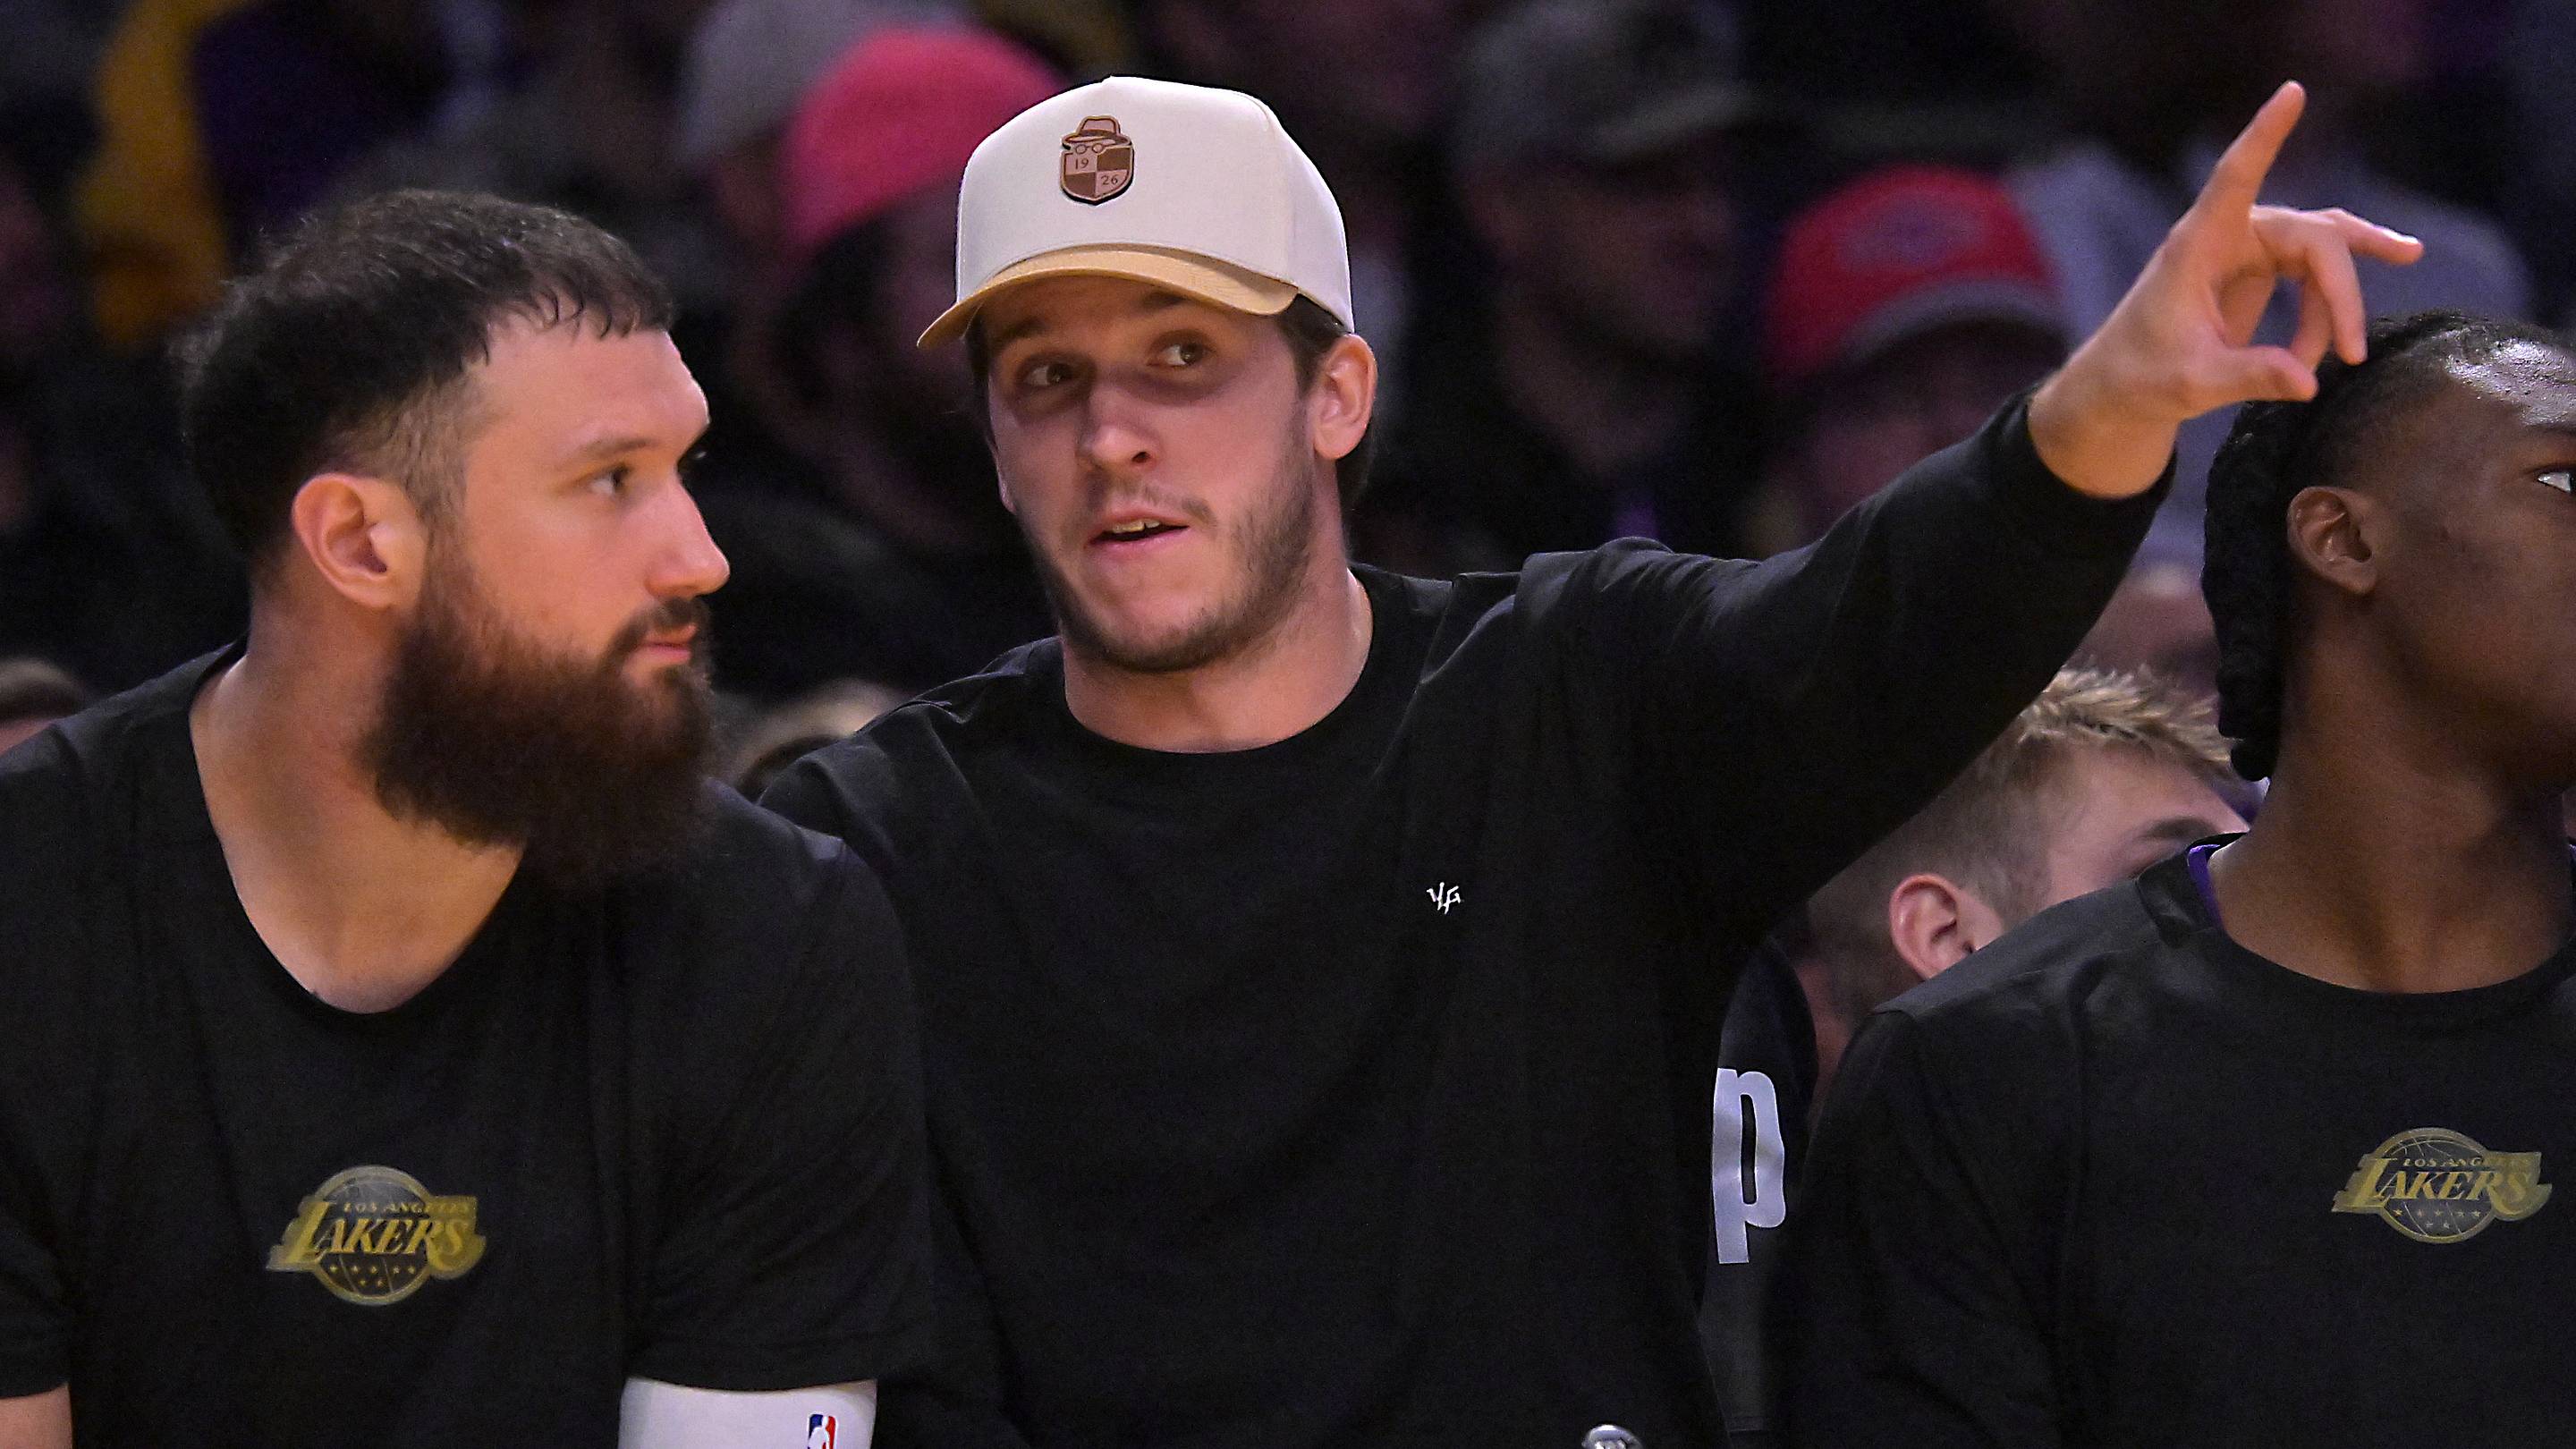
Lakers Rule Out Austin Reaves for NBA Cup Clash Against Kings
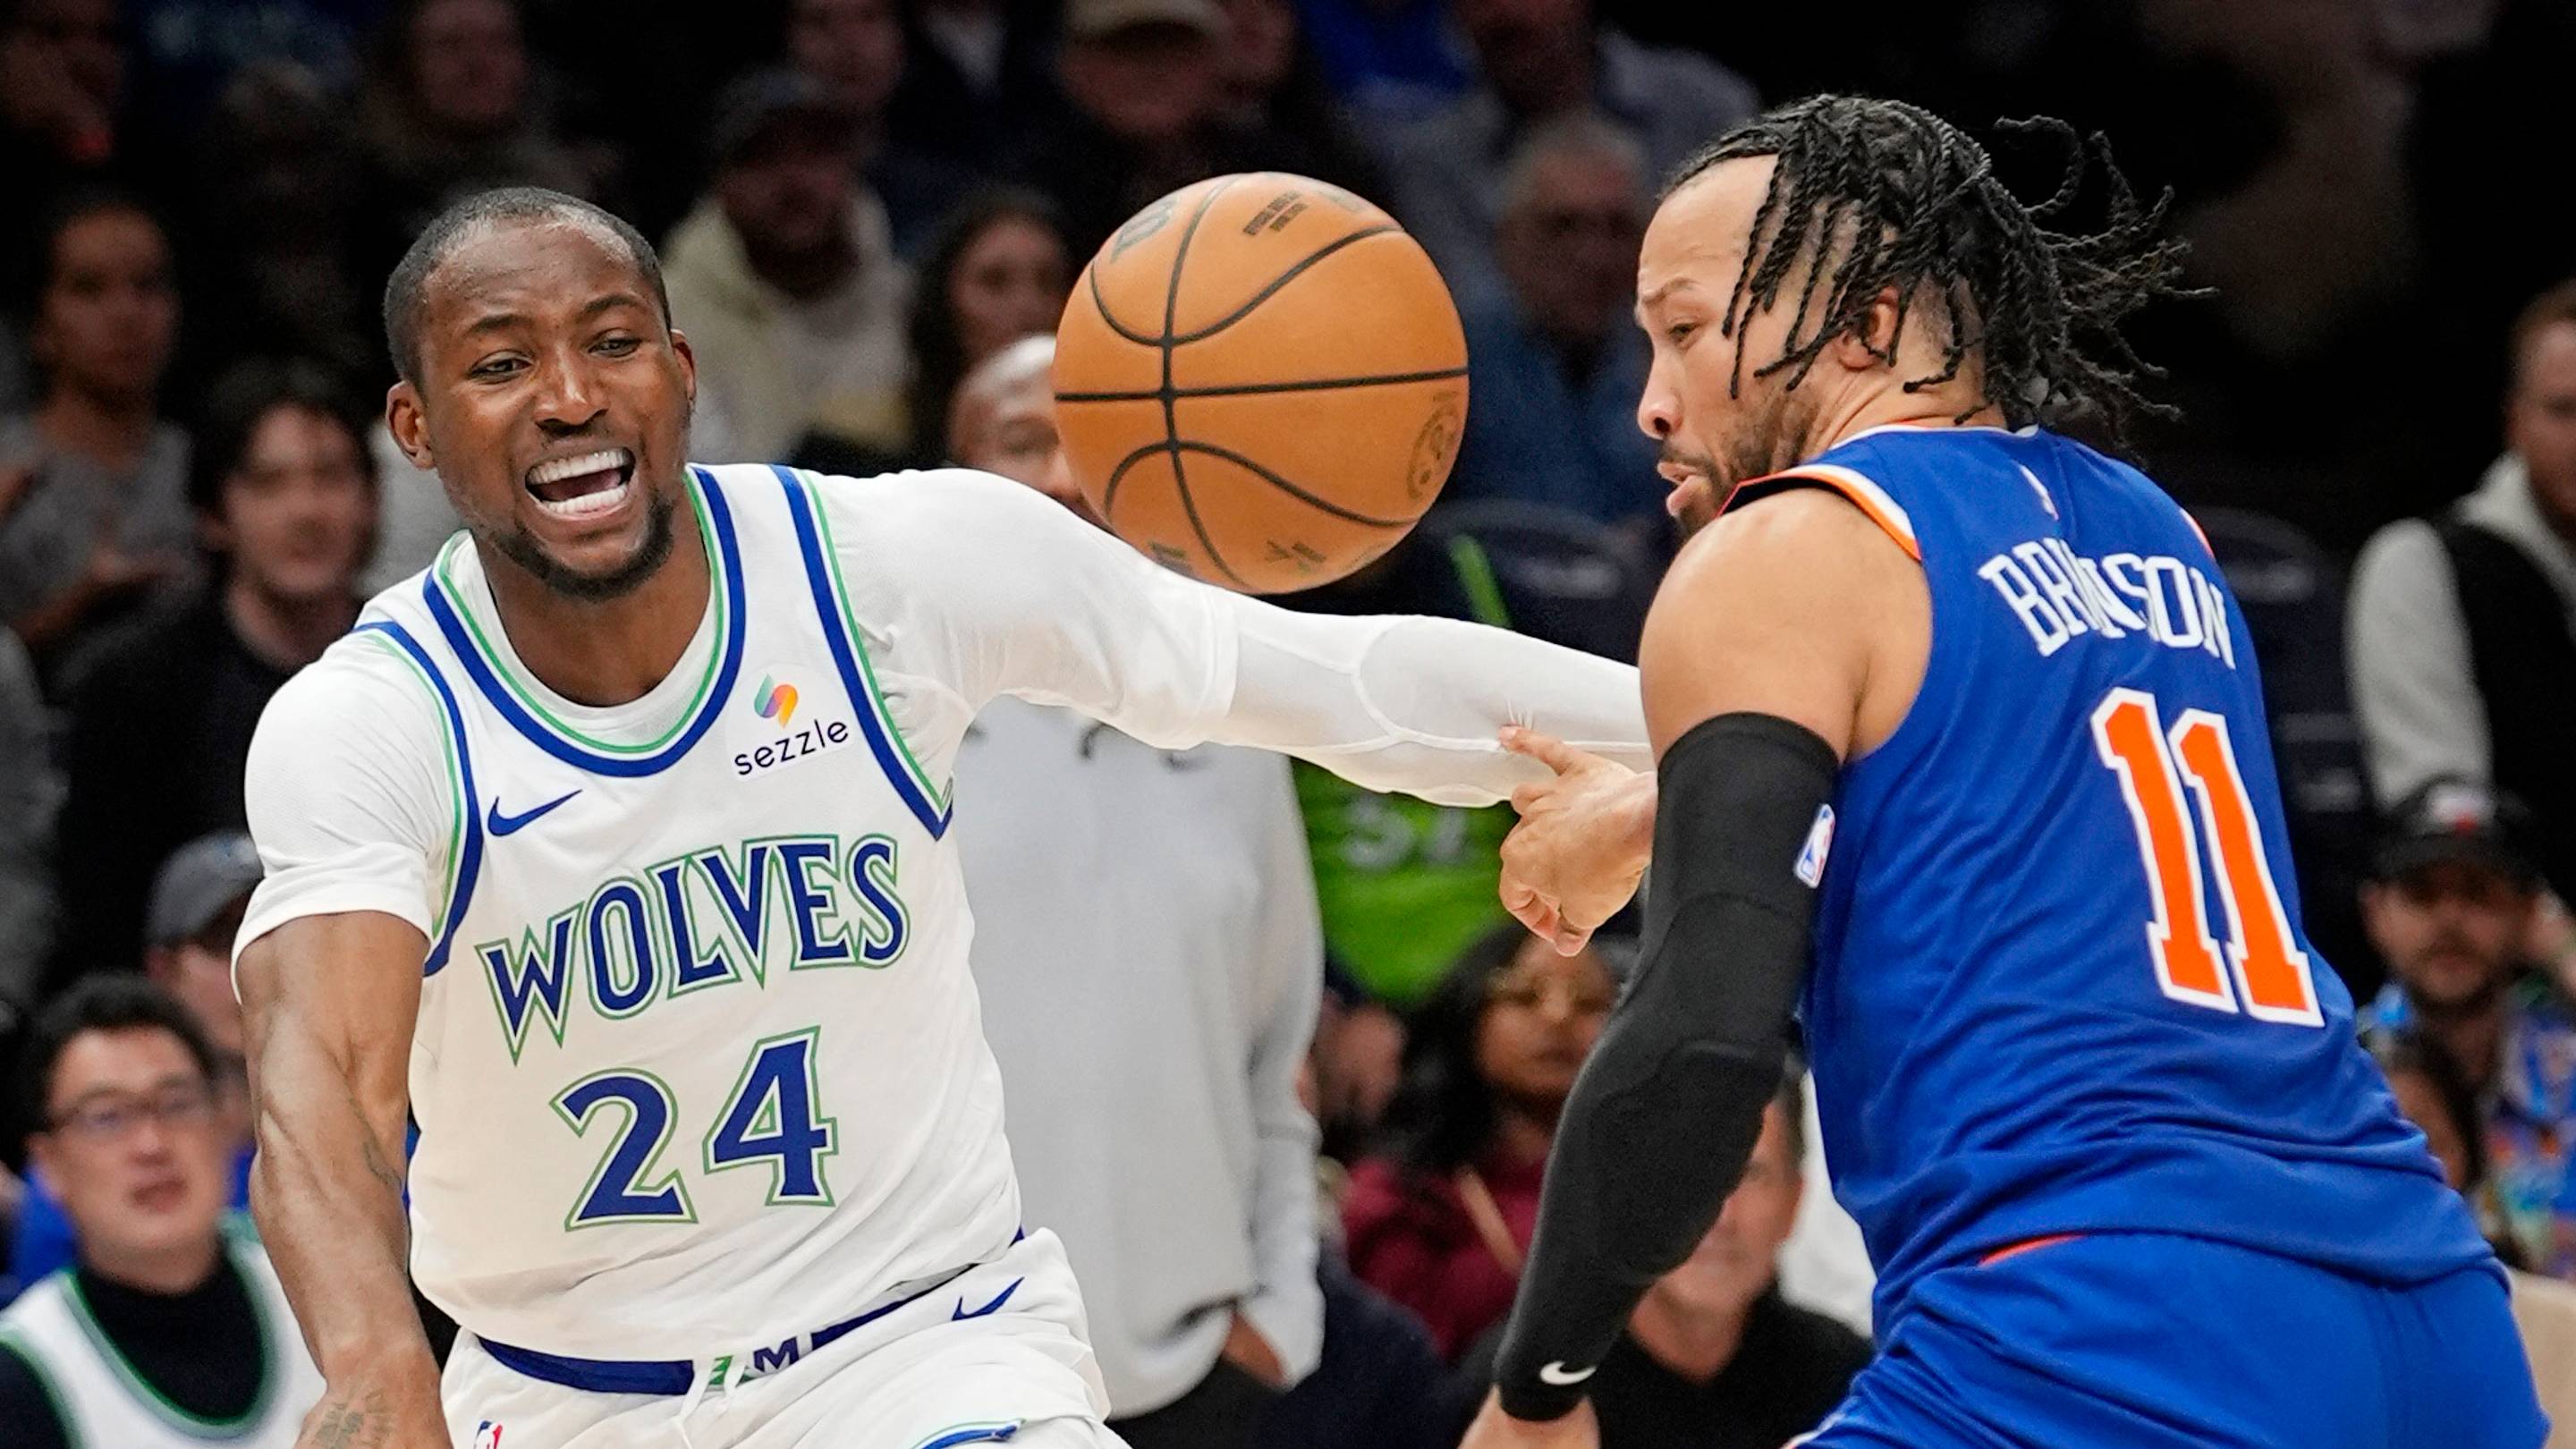
Timberwolves' Comeback Falls Short Against Knicks: Three Plays T…
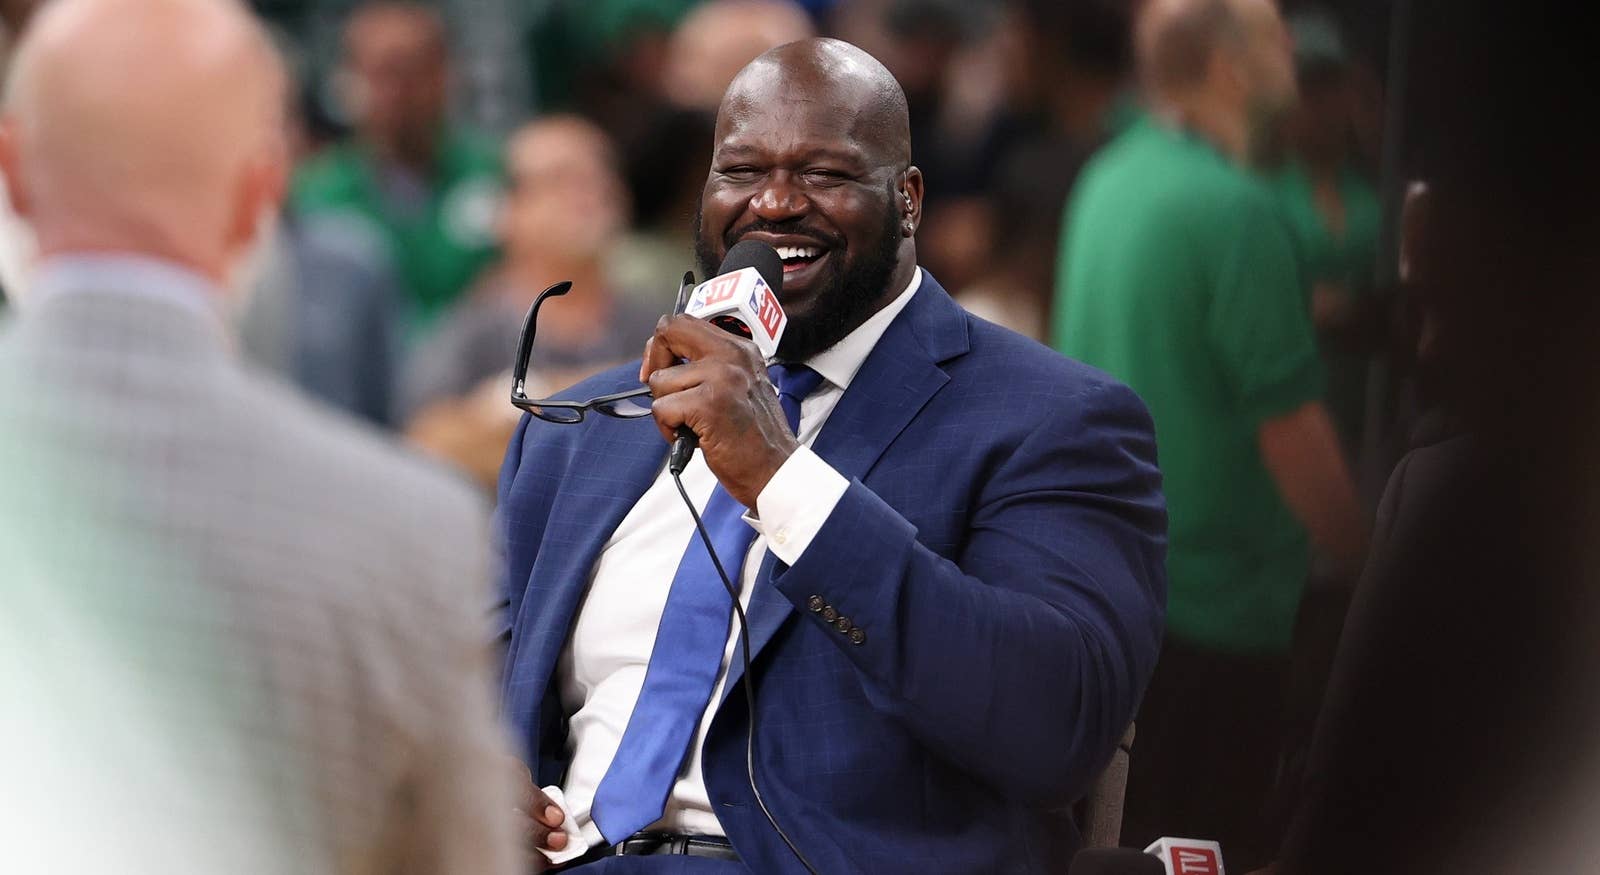
Shaq's Unlikely Discovery: How a 13-Year-Old Giant Fooled LSU Co…