


PHILADELPHIA
76ERSPHI
6-1 | Road
109


CHARLOTTE
HORNETSCHA
3-4 | Home
104
Key Game
KEY GAME
Labaron Philon Jr.
#00 | Guard@
KEY GAME
Christian Anderson
#5 | Guard| Player | |
|---|---|
| Labaron Philon Jr. | None-None |
| Christian Anderson | None-None |
None-None
W-L
None-None
AI Model Win Probability
76ERS
52%
HORNETS
48%
▲ Edge: +2.20% (CHA)
76ERS
57%
Book Odds: -130
HORNETS
46%
Book Odds: +120
AI Model Projected Total
AI Projection
213.0
Projected
Book Total
212.5
Over / Under Line
▲
Edge: +0.5 (Over)
Over 212.5
53%
Under 212.5
47%
AI Model Spread Expectation
AI Spread Proj
+0.6
CHARLOTTE
Book Spread
+2.5
Book Line
▲ Edge: +1.9 points (Charlotte)
Spread Distribution
AI Model
-30-20-100+10+20+30
Distribution centered around CHA +0.6 expected margin.
Margin of Victory (CHA)
PHI By 1-7 points
25.9%
PHI By 8-14 points
16.3%
CHA By 1-7 points
24.7%
CHA By 8-14 points
14.3%
AI Model Projected Score
Philadelphia
106.8
PHILADELPHIA
Book Implied: 107.50
Charlotte
106.2
CHARLOTTE
Book Implied: 105
Simulated Score
Philadelphia
98
PHILADELPHIA
Book Implied: 107.50
Charlotte
97
CHARLOTTE
Book Implied: 105
Projections Grades
Moneyline (ML)
Agreement
AI
76ers
Win
52% Win Prob
D
Sim
76ers
Win
53% Win Prob
D
Point Spread (ATS)
Agreement
AI
Hornets (+2.5)
Loss
Proj Spread: +0.6
D
Sim
Hornets (+2.5)
Loss
Proj Spread: +1.0
D
Over/Under (Total)
Divergence
AI
o212.5
Win
Proj Total: 213.0
D
Sim
u212.5
Loss
Proj Total: 195.0
A
Head-to-Head History
Date
Game
Score
Oct 31, 2026
PHI @ CHA
109 - 104
Mar 28, 2026
PHI @ CHA
118 - 114
Jan 26, 2026
PHI @ CHA
93 - 130
Oct 25, 2025
CHA @ PHI
121 - 125
Dec 20, 2024
CHA @ PHI
98 - 108
Key Model Drivers
Blocks (L5)
+21.0% more
Philadelphia: 4.8
vs
Charlotte: 3.8
Assists (L5)
+16.7% more
Philadelphia: 24.4
vs
Charlotte: 20.3
Field Goal % (L5)
+7.2%
Philadelphia: 45.5%
vs
Charlotte: 38.3%
3pt Field Goal % (L5)
+4.9%
Philadelphia: 33.3%
vs
Charlotte: 28.4%
Post-Mortem Analysis
Metric
Projected
Actual
Score Game
PHI Score
106.8
109
CHA Score
106.2
104
Team Stats Splits (Home / Away)
3pt Field Goal %
28.4 / 33.3
36.0 / 40.0
Assists
20.3 / 24.4
26.0 / 27.0
Blocks
3.8 / 4.8
8.0 / 3.0
Field Goal %
38.3 / 45.5
50.0 / 47.0
Free Throw %
75.1 / 77.0
88.0 / 65.0
Rebounding
49.6 / 40.3
38.0 / 36.0
Steals
8.5 / 8.3
4.0 / 11.0
Turnovers
16.9 / 13.7
18.0 / 8.0
Public Market Splits
Moneyline
Open: -120 / +100
→
-130 / +120
↓
Spread (ATS)
Open: -1.5 / +1.5
→
-2.5 / +2.5
↓
Total (O/U)
Open: 216.5
→
212.5
↓
Situational Trends
📊 Win-Loss
PHI
Advantage
13-3-0
(81.3%)
Margin: 2.9
ATS +/-: -0.2
CHA
4-10-0
(28.6%)
Margin: -10.3
ATS +/-: -7.0
🎯 ATS (Spread)
PHI
Advantage
9-7-0
(56.3%)
Margin: 2.9
ATS +/-: -0.2
CHA
6-8-0
(42.9%)
Margin: -10.3
ATS +/-: -7.0
⚖️ Over/Under
PHI
8-8-0
O: 50.0% / U: 50.0%
Total +/-: -1.9
CHA
6-8-0
O: 42.9% / U: 57.1%
Total +/-: -6.6
Season to Date Model Accuracy
AI Model
SIM Engine
CHA
PHI
CHA
PHI
ML
71%
10-4
69%
11-5
64%
9-5
69%
11-5
ATS
50%
7-7
38%
6-10
43%
6-8
50%
8-8
TTL
50%
7-7
62%
10-6
50%
7-7
50%
8-8
Contextual Game News

NBA Fans Erupt Over James Harden's Latest Foul-Drawing Tactic: '…

LeBron James Shrugs Off Injury Scares and Criticism, Delivers Cl…
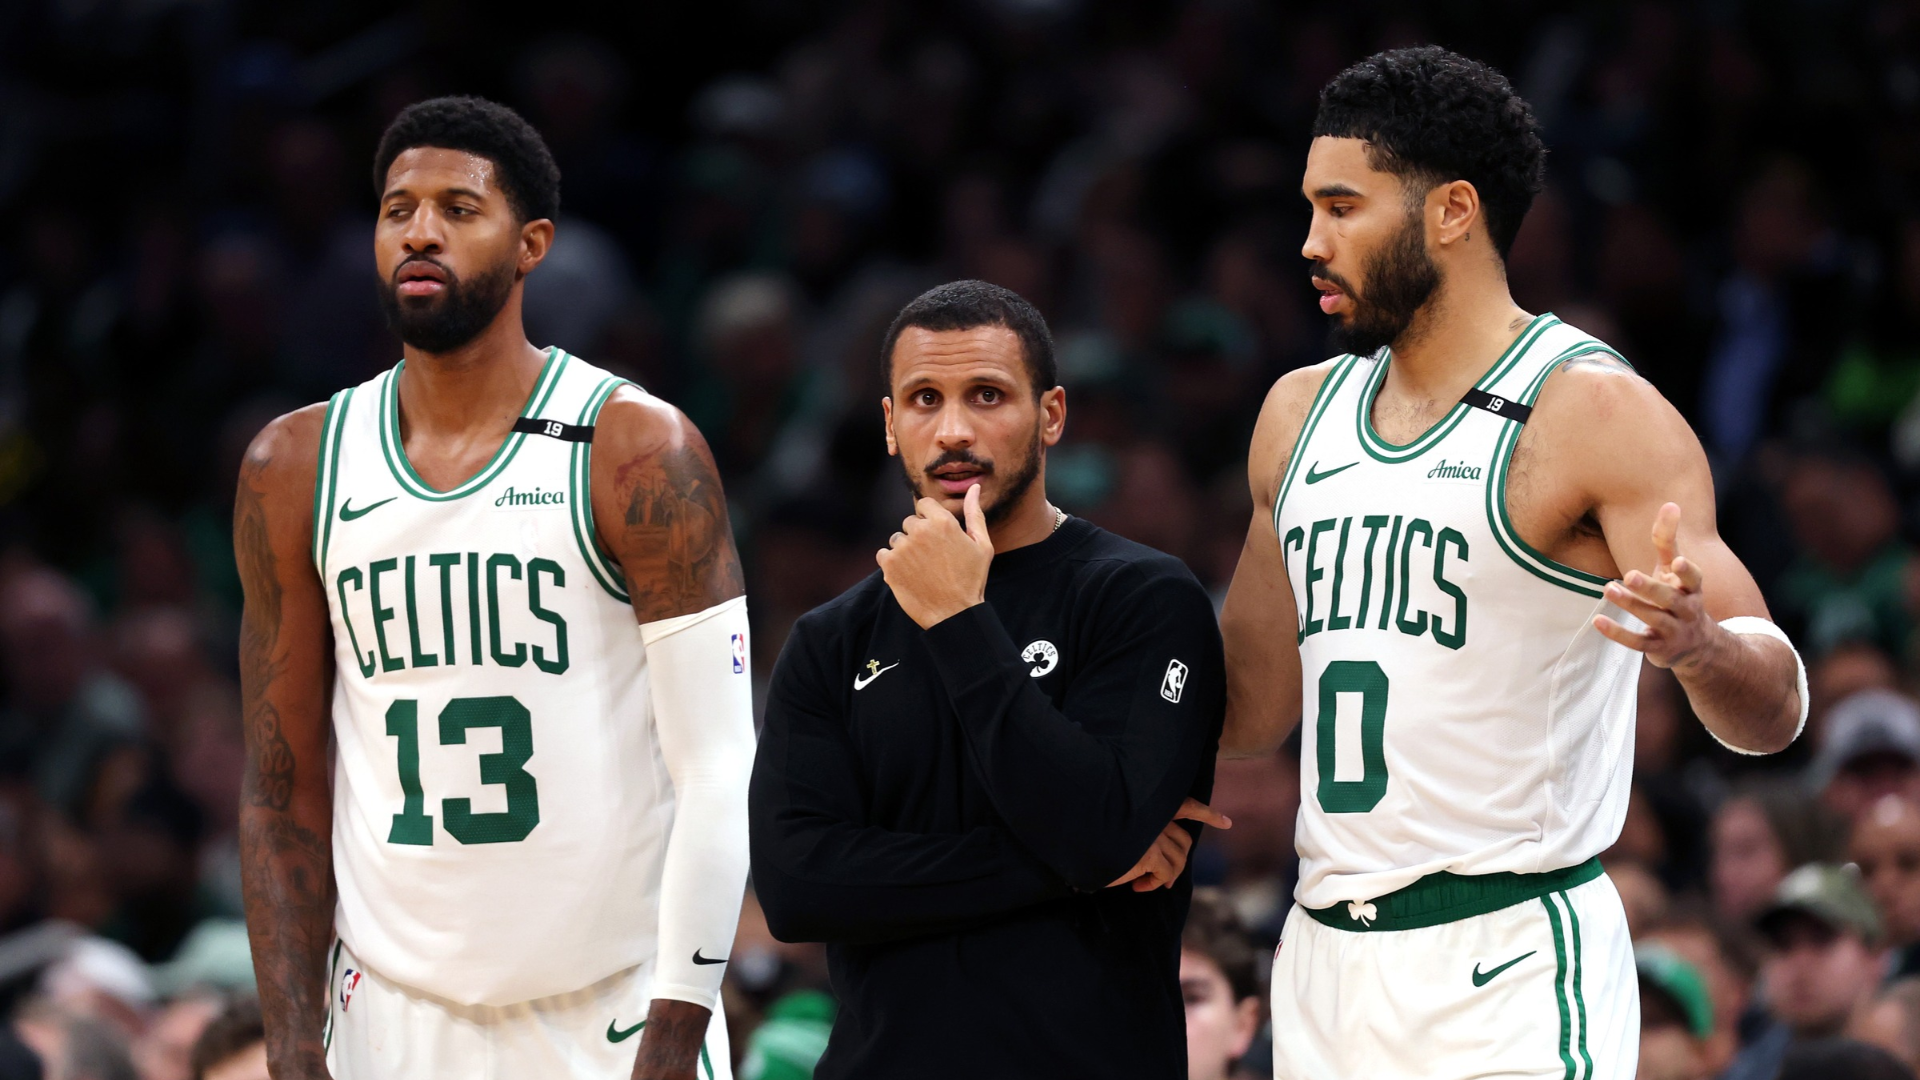
Paul George Says He's 'Not One of Those Guys That Have to Have a…
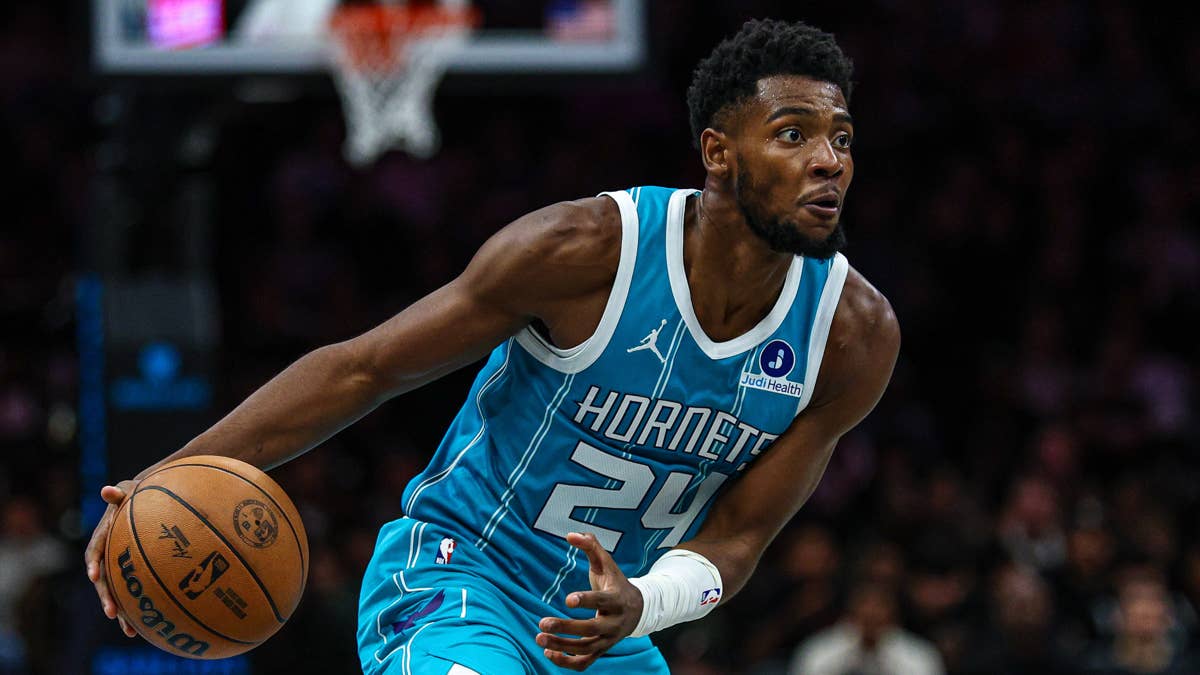
Gilbert Arenas Calls Out Hornets Coach Charles Lee After Disappo…
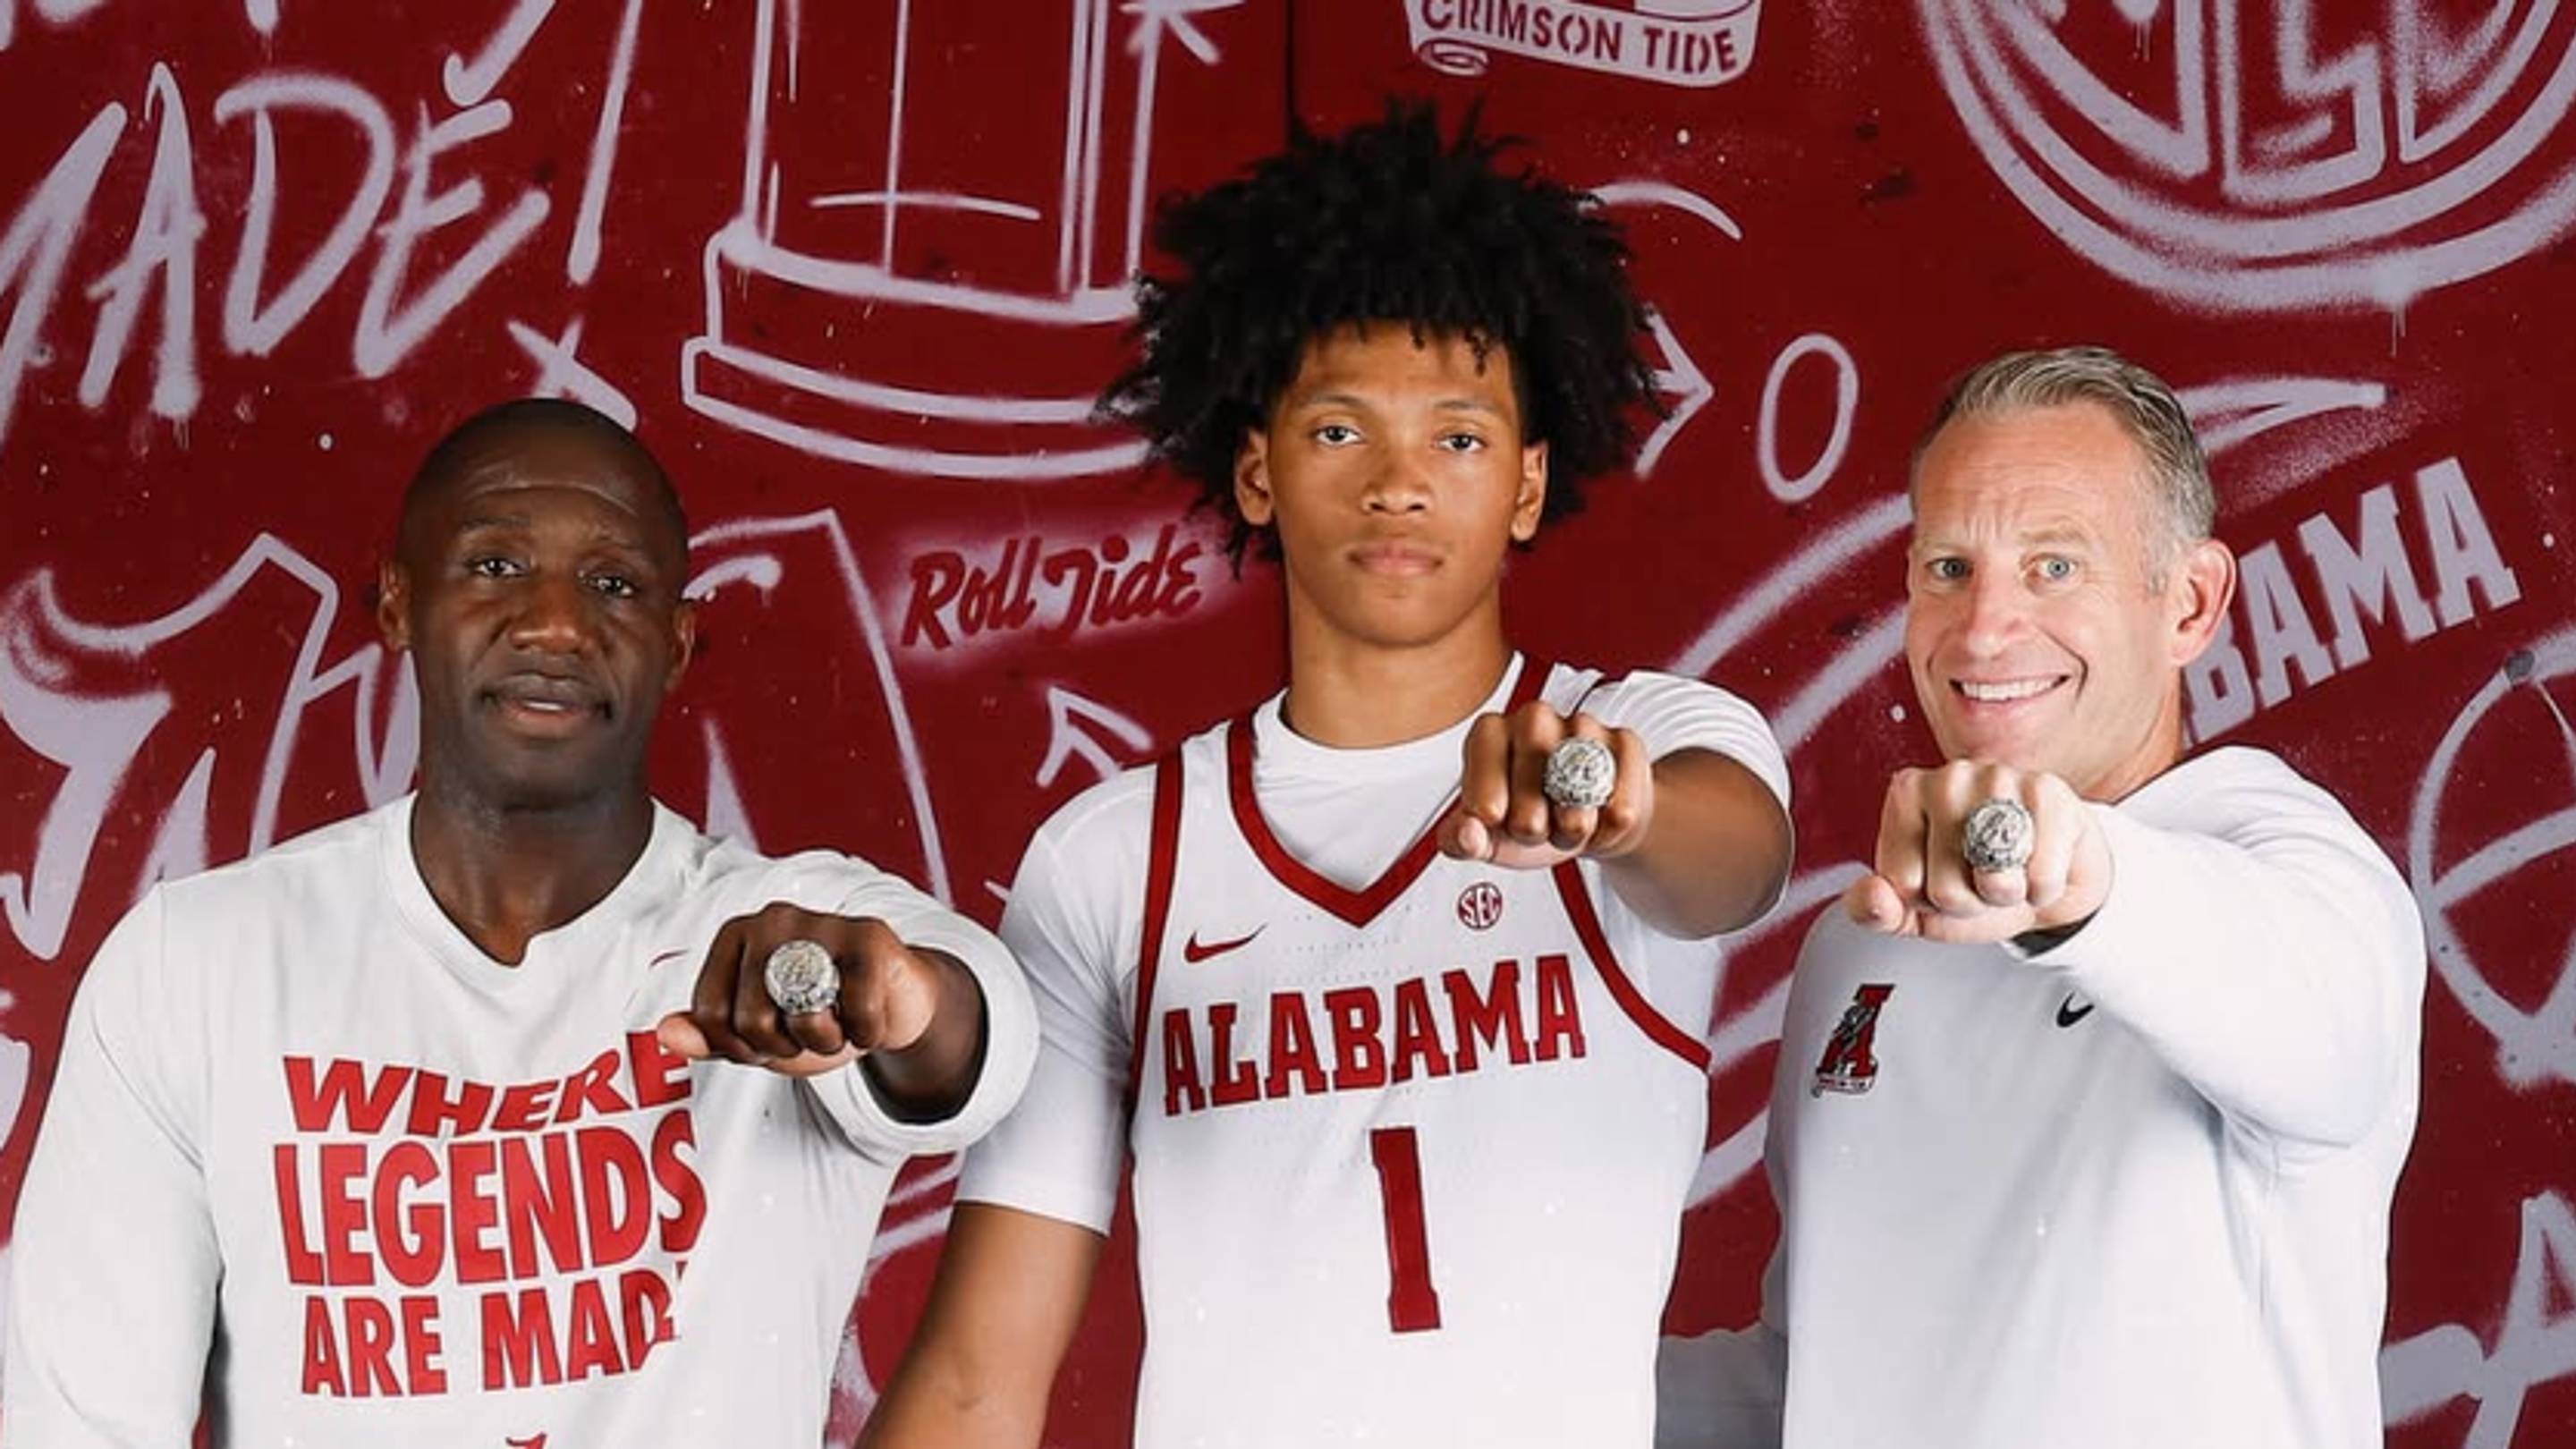
Nate Oats Breaks Down Alabama Basketball's Star-Studded 2027 Sig…