



WINNIPEG
JETSWPG
4-6-3 | Road
4


TAMPA BAY
LIGHTNINGTB
8-3-1 | Home
6
Goaltending

GOALTENDER
Stuart Skinner
#74 | Goaltender@

GOALTENDER
Andrei Vasilevskiy
#88 | Goaltender| Player | W-L-OTL | GAA | SV% | SO |
|---|---|---|---|---|
| Stuart Skinner | None-None | 7.50 | 0.762 | -- |
| Andrei Vasilevskiy | None-None | 4.00 | 0.810 | -- |
None-None
W-L-OTL
None-None
7.50
GAA
Ldr 4.00
0.762
Save %
Ldr 0.810
--
SO
--
AI Model Win Probability
JETS
25%
LIGHTNING
75%
▲ Edge: +6.50% (TB)
JETS
36%
Book Odds: +180
LIGHTNING
69%
Book Odds: -218
AI Model Projected Total
AI Projection
6.0
Projected
Book Total
5.5
Over / Under Line
▲
Edge: +0.5 (Over)
Over 5.5
51%
Under 5.5
49%
AI Model Spread Expectation
AI Spread Proj
-1.6
TAMPA BAY
Book Spread
-1.5
Book Line
▲ Edge: +0.1 points (Tampa Bay)
Spread Distribution
AI Model
+6+4+20-2-4-6
Distribution centered around TB -1.6 expected margin.
Margin of Victory (TB)
WPG By 1 goal
8.6%
WPG By 2-3 goals
5.5%
TB By 1 goal
18.9%
TB By 2-3 goals
34.9%
AI Model Projected Score
Winnipeg
2.2
WINNIPEG
Book Implied: 2
Tampa Bay
3.8
TAMPA BAY
Book Implied: 3.50
Simulated Score
Winnipeg
2
WINNIPEG
Book Implied: 2
Tampa Bay
3
TAMPA BAY
Book Implied: 3.50
Projections Grades
Moneyline (ML)
Agreement
👑 Top Selection
AI
Lightning
Win
75% Win Prob
A
Sim
Lightning
Win
69% Win Prob
A
Puck Line (ATS)
Divergence
AI
Lightning (-1.5)
Win
Proj Goals: -1.6
D
Sim
Jets (+1.5)
Loss
Proj Goals: +1.0
B
Over/Under (Total)
Divergence
AI
o5.5
Win
Proj Total: 6.0
D
Sim
u5.5
Loss
Proj Total: 5.0
A
Head-to-Head History
Date
Game
Score
Nov 8, 2026
TB @ WPG
3 - 4
Oct 29, 2026
WPG @ TB
4 - 6
Mar 5, 2026
TB @ WPG
1 - 4
Jan 29, 2026
WPG @ TB
1 - 4
Nov 14, 2024
WPG @ TB
1 - 4
Key Model Drivers
Power Play % (L5)
+28.0%
Tampa Bay: 31.7%
vs
Winnipeg: 3.7%
Blocked Shots (L5)
+20.1% more
Tampa Bay: 13.3
vs
Winnipeg: 11.0
Shots on Goal (L5)
+13.8% more
Tampa Bay: 30.8
vs
Winnipeg: 27.1
Faceoff % (L5)
+4.8%
Tampa Bay: 49.4%
vs
Winnipeg: 44.6%
Post-Mortem Analysis
Metric
Projected
Actual
Score Game
WPG Score
2.2
4
TB Score
3.8
6
Team Stats Splits (Home / Away)
Blocked Shots
13.3 / 11.0
10.0 / 14.0
Faceoff %
49.4 / 44.6
38.6 / 61.4
Hits
23.0 / 25.4
17.0 / 28.0
Power Play %
31.7 / 3.7
33.3 / 0.0
Shots on Goal
30.8 / 27.1
31.0 / 21.0
Takeaways
3.0 / 5.8
1.0 / 2.0
Public Market Splits
Moneyline
Open: +195 / -238
→
+180 / -218
↓
Spread (ATS)
Open: +1.5 / -1.5
→
+1.5 / -1.5
Total (O/U)
Open: 5.5
→
5.5
Season to Date Model Accuracy
AI Model
SIM Engine
TB
WPG
TB
WPG
ML
52%
11-10
59%
13-9
76%
16-5
55%
12-10
ATS
48%
10-11
27%
6-16
57%
12-9
68%
15-7
TTL
45%
9-11-1
50%
11-11
35%
7-13-1
45%
10-12
Contextual Game News

Lightning Honor Ovechkin with Custom Cigar Box in Final Tampa Ap…

Connections: Sports Edition Puzzle No. 785: Hints and Answers fo…

NHL Weekend Wrap: Jets' Scheifele Sets Record, Utah's Shootout S…
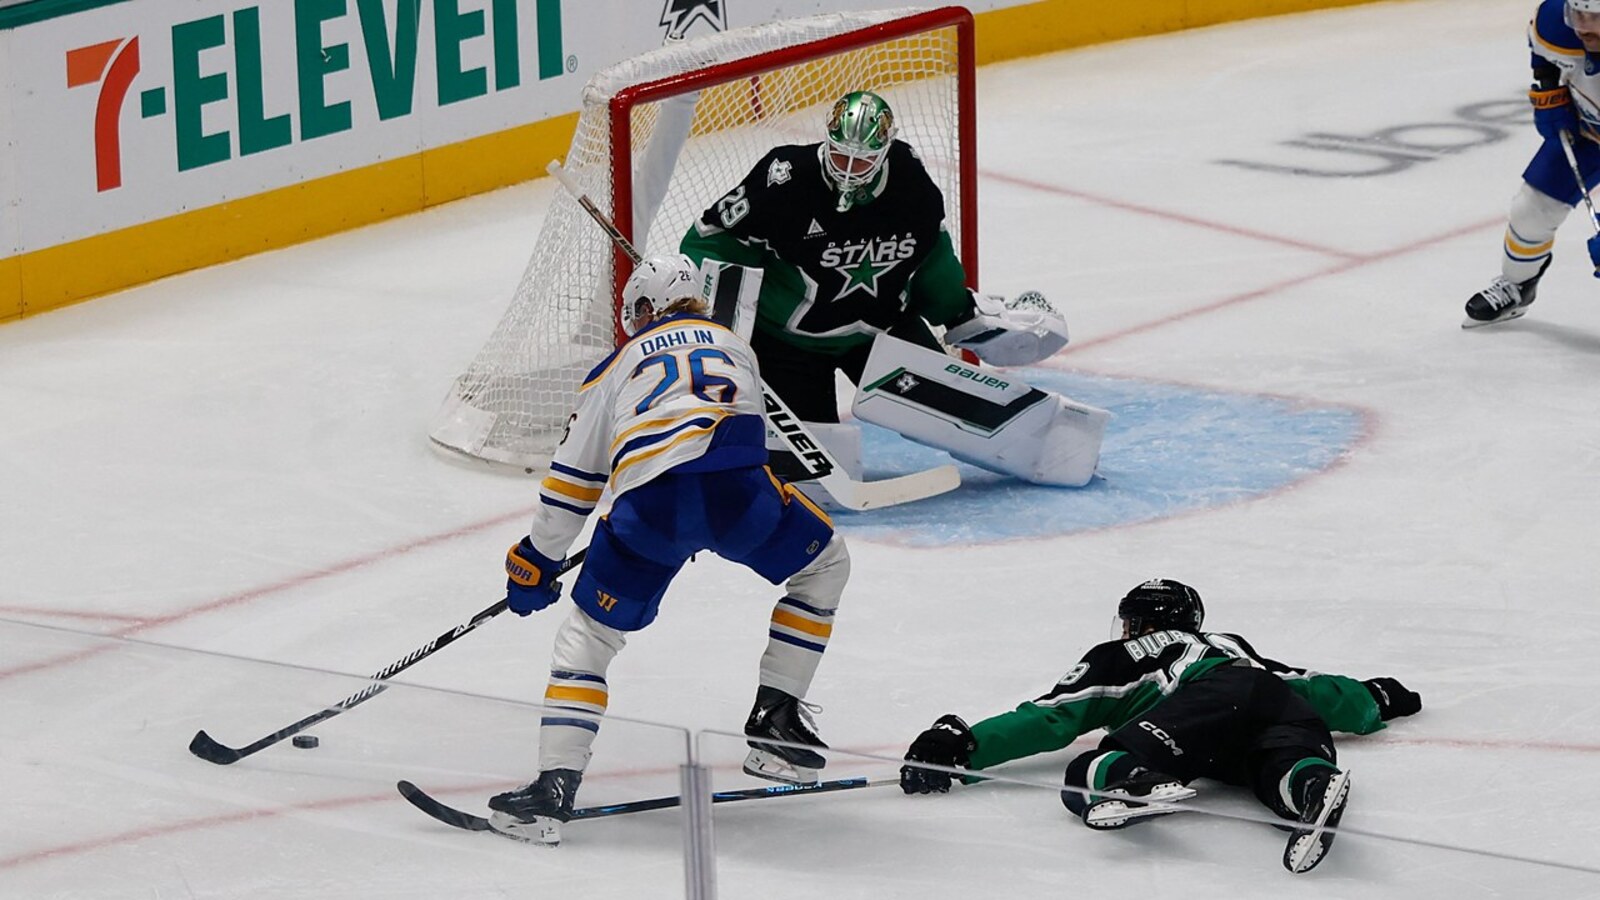
Jake Oettinger Bounces Back with 20th Career Shutout as Stars Bl…

Spencer Knight's Stick Gets Stuck, Jets Score Bizarre Goal