



SACRAMENTO
KINGSSAC
0-5 | Road
120


NEW ORLEANS
PELICANSNO
1-4 | Home
132
Key Game
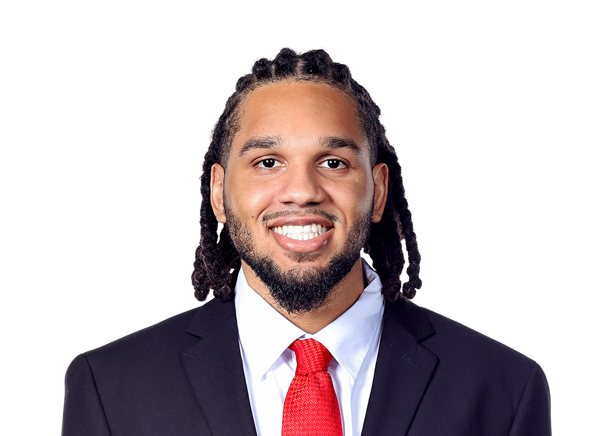
KEY GAME
Emanuel Sharp
#34 | Guard@
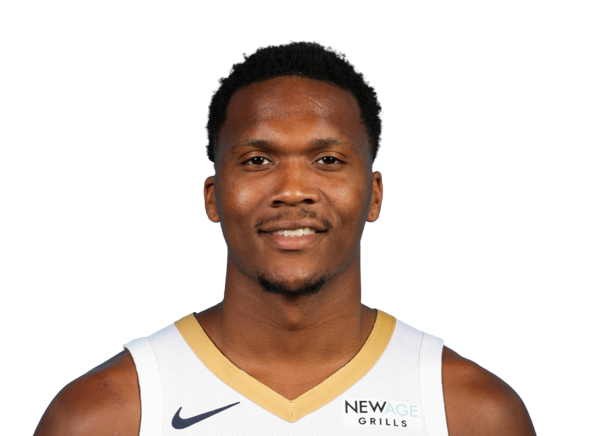
KEY GAME
Bennedict Mathurin
#24 | Guard| Player | |
|---|---|
| Emanuel Sharp | None-None |
| Bennedict Mathurin | None-None |
None-None
W-L
None-None
AI Model Win Probability
KINGS
40%
PELICANS
60%
▲ Edge: +7.10% (SAC)
KINGS
33%
Book Odds: +200
PELICANS
69%
Book Odds: -220
AI Model Projected Total
AI Projection
234.4
Projected
Book Total
234.5
Over / Under Line
▼
Edge: +0.1 (Under)
Over 234.5
47%
Under 234.5
53%
AI Model Spread Expectation
AI Spread Proj
+2.0
SACRAMENTO
Book Spread
+6.5
Book Line
▲ Edge: +4.5 points (Sacramento)
Spread Distribution
AI Model
+30+20+100-10-20-30
Distribution centered around SAC +2.0 expected margin.
Margin of Victory (SAC)
SAC By 1-7 points
23.0%
SAC By 8-14 points
12.2%
NO By 1-7 points
26.8%
NO By 8-14 points
18.6%
AI Model Projected Score
Sacramento
116.2
SACRAMENTO
Book Implied: 114
New Orleans
118.2
NEW ORLEANS
Book Implied: 120.50
Simulated Score
Sacramento
103
SACRAMENTO
Book Implied: 114
New Orleans
109
NEW ORLEANS
Book Implied: 120.50
Projections Grades
Moneyline (ML)
Agreement
AI
Pelicans
Win
60% Win Prob
C
Sim
Pelicans
Win
66% Win Prob
B
Point Spread (ATS)
Agreement
AI
Kings (+6.5)
Loss
Proj Spread: +2.0
B
Sim
Kings (+6.5)
Loss
Proj Spread: +6.0
D
Over/Under (Total)
Agreement
AI
u234.5
Loss
Proj Total: 234.4
D
Sim
u234.5
Loss
Proj Total: 212.0
A
Head-to-Head History
Date
Game
Score
Oct 29, 2026
SAC @ NO
120 - 132
Apr 3, 2026
NO @ SAC
113 - 117
Mar 5, 2026
NO @ SAC
133 - 123
Feb 9, 2026
SAC @ NO
94 - 120
Feb 13, 2025
SAC @ NO
133 - 140
Key Model Drivers
Steals (L5)
+82.6% more
New Orleans: 11.8
vs
Sacramento: 6.4
Blocks (L5)
+21.7% more
New Orleans: 4.5
vs
Sacramento: 3.7
Turnovers (L5)
+9.8% more
New Orleans: 16.5
vs
Sacramento: 15.1
Free Throw % (L5)
+5.9%
New Orleans: 79.5%
vs
Sacramento: 73.5%
Post-Mortem Analysis
Metric
Projected
Actual
Score Game
SAC Score
116.2
120
NO Score
118.2
132
Team Stats Splits (Home / Away)
3pt Field Goal %
28.0 / 31.8
34.0 / 32.0
Assists
23.4 / 23.9
32.0 / 31.0
Blocks
4.5 / 3.7
6.0 / 1.0
Field Goal %
45.8 / 45.2
60.0 / 52.0
Free Throw %
79.5 / 73.5
69.0 / 80.0
Rebounding
44.5 / 41.8
38.0 / 39.0
Steals
11.8 / 6.4
18.0 / 12.0
Turnovers
16.5 / 15.1
20.0 / 25.0
Public Market Splits
Moneyline
Open: +164 / -198
→
+200 / -220
↑
Spread (ATS)
Open: +5.5 / -5.5
→
+6.5 / -6.5
↑
Total (O/U)
Open: 237.5
→
234.5
↓
Situational Trends
📊 Win-Loss
SAC
1-12-0
(7.7%)
Margin: -13.5
ATS +/-: -3.4
NO
Advantage
5-10-0
(33.3%)
Margin: -7.1
ATS +/-: -3.8
🎯 ATS (Spread)
SAC
4-9-0
(30.8%)
Margin: -13.5
ATS +/-: -3.4
NO
Advantage
8-7-0
(53.3%)
Margin: -7.1
ATS +/-: -3.8
⚖️ Over/Under
SAC
7-6-0
O: 53.8% / U: 46.2%
Total +/-: -1.4
NO
8-7-0
O: 53.3% / U: 46.7%
Total +/-: +5.1
Season to Date Model Accuracy
AI Model
SIM Engine
NO
SAC
NO
SAC
ML
67%
10-5
92%
12-1
67%
10-5
77%
10-3
ATS
47%
7-8
38%
5-8
73%
11-4
38%
5-8
TTL
53%
8-7
23%
3-10
47%
7-8
38%
5-8
Contextual Game News

Stojakovic's 46-Point Masterpiece Shatters 67-Year-Old Record as…

Gilbert Arenas Says Klay Thompson's Breakup With Megan Thee Stal…

RJ Luis Added to LSU Basketball Roster After Court Battle, No Pe…

Trae Young Urges Patience as Wizards' Skid Hits Eight Games

Draymond Green: Warriors Rookie Yaxel Lendeborg Facing Unfair Pr…