



BUFFALO
BILLSBUF
7-1 | Road
23


MINNESOTA
VIKINGSMIN
6-2 | Home
6
Key Game
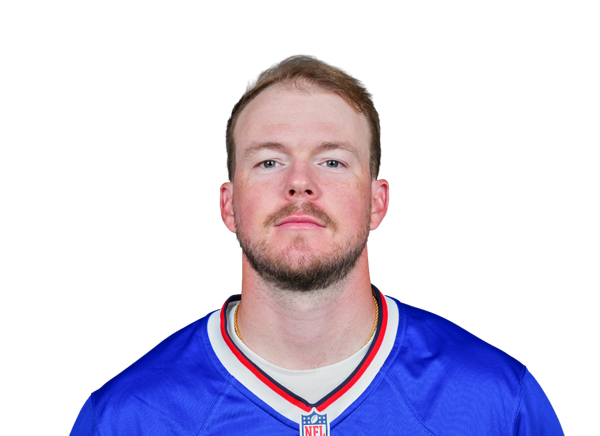
KEY GAME
Tyler Bass
#16 | Place kicker@

KEY GAME
Brett Thorson
#19 | Punter| Player | |
|---|---|
| Tyler Bass | None-None |
| Brett Thorson | None-None |
None-None
W-L
None-None
AI Model Win Probability
BILLS
58%
VIKINGS
42%
▲ Edge: +4.60% (MIN)
BILLS
65%
Book Odds: -186
VIKINGS
38%
Book Odds: +166
AI Model Projected Total
AI Projection
50.0
Projected
Book Total
45.5
Over / Under Line
▲
Edge: +4.5 (Over)
Over 45.5
63%
Under 45.5
37%
AI Model Spread Expectation
AI Spread Proj
+1.0
MINNESOTA
Book Spread
+3
Book Line
▲ Edge: +2.0 points (Minnesota)
Spread Distribution
AI Model
-42-28-140+14+28+42
Distribution centered around MIN +1.0 expected margin.
Margin of Victory (MIN)
BUF By 1-6 points
16.7%
BUF By 7-13 points
16.1%
MIN By 1-6 points
16.1%
MIN By 7-13 points
14.6%
AI Model Projected Score
Buffalo
25.5
BUFFALO
Book Implied: 24.20
Minnesota
24.5
MINNESOTA
Book Implied: 21.20
Simulated Score
Buffalo
25
BUFFALO
Book Implied: 24.20
Minnesota
22
MINNESOTA
Book Implied: 21.20
Projections Grades
Moneyline (ML)
Agreement
AI
Bills
Win
58% Win Prob
C
Sim
Bills
Win
62% Win Prob
C
Point Spread (ATS)
Agreement
AI
Vikings (+3)
Loss
Proj Spread: +1.0
C
Sim
Vikings (+3)
Loss
Proj Spread: +3.0
D
Over/Under (Total)
Agreement
AI
o45.5
Loss
Proj Total: 50.0
B
Sim
o45.5
Loss
Proj Total: 47.0
C
Head-to-Head History
Date
Game
Score
Nov 9, 2026
BUF @ MIN
23 - 6
Nov 13, 2022
MIN @ BUF
33 - 30
Sep 23, 2018
BUF @ MIN
27 - 6
Oct 19, 2014
MIN @ BUF
16 - 17
Dec 5, 2010
BUF @ MIN
14 - 38
Key Model Drivers
Turnovers (L5)
+51.2% more
Buffalo: 1.6
vs
Minnesota: 0.8
First Downs (L5)
+31.8% more
Buffalo: 23.6
vs
Minnesota: 16.1
Net Passing Yards (L5)
+30.1% more
Buffalo: 247.2
vs
Minnesota: 172.8
Total Yards (L5)
+27.5% more
Buffalo: 394.5
vs
Minnesota: 285.9
Post-Mortem Analysis
Metric
Projected
Actual
Score Game
BUF Score
25.5
23
MIN Score
24.5
6
Team Stats Splits (Home / Away)
First Downs
16.1 / 23.6
9.0 / 22.0
Net Passing Yards
172.8 / 247.2
127.0 / 205.0
Rushing Yards
113.0 / 147.3
51.0 / 134.0
Third Down Efficiency
0.3 / 0.4
0.0 / 0.39
Time of Possession
0.5 / 0.5
0.29 / 0.71
Total Yards
285.9 / 394.5
178.0 / 339.0
Turnovers
0.8 / 1.6
3.0 / 1.0
Yards Per Play
5.0 / 6.0
3.9 / 4.3
Public Market Splits
Moneyline
Open: -170 / +142
→
-186 / +166
↓
Spread (ATS)
Open: -3 / +3
→
-3 / +3
Total (O/U)
Open: 48.5
→
45.5
↓
Situational Trends
📊 Win-Loss
BUF
Advantage
7-1-0
(87.5%)
Margin: 8.6
ATS +/-: +4.9
MIN
6-2-0
(75.0%)
Margin: 3.8
ATS +/-: +2.6
🎯 ATS (Spread)
BUF
Advantage
6-2-0
(75.0%)
Margin: 8.6
ATS +/-: +4.9
MIN
4-4-0
(50.0%)
Margin: 3.8
ATS +/-: +2.6
⚖️ Over/Under
BUF
5-3-0
O: 62.5% / U: 37.5%
Total +/-: +4.1
MIN
1-7-0
O: 12.5% / U: 87.5%
Total +/-: -10.8
Season to Date Model Accuracy
AI Model
SIM Engine
MIN
BUF
MIN
BUF
ML
62%
5-3
62%
5-3
75%
6-2
62%
5-3
ATS
25%
2-6
25%
2-6
75%
6-2
12%
1-7
TTL
12%
1-7
38%
3-5
12%
1-7
25%
2-6
Contextual Game News

Vikings vs. Packers Week 10: TV Channel, Streaming Options, and …

Bengals vs. Steelers: Week 10 Sunday Night Football Kickoff Time…

Wake Forest Makes Statement, Georgia Dominates, and UCLA's Stunn…

Broncos Still Eyeing 300-Tackle Linebacker Daiyan Henley Despite…
Vikings' Late-Night Pursuit of Kirk Cousins: How a Fifth-Round O…