



CINCINNATI
BENGALSCIN
6-2 | Road
34


ATLANTA
FALCONSATL
3-6 | Home
17
Key Game

KEY GAME
Ryan Rehkow
#8 | Punter@

KEY GAME
Jake Bailey
#16 | Punter| Player | |
|---|---|
| Ryan Rehkow | None-None |
| Jake Bailey | None-None |
None-None
W-L
None-None
AI Model Win Probability
BENGALS
65%
FALCONS
35%
▲ Edge: +1.20% (CIN)
BENGALS
63%
Book Odds: -173
FALCONS
39%
Book Odds: +155
AI Model Projected Total
AI Projection
47.0
Projected
Book Total
52.5
Over / Under Line
▼
Edge: +5.5 (Under)
Over 52.5
33%
Under 52.5
67%
AI Model Spread Expectation
AI Spread Proj
+2.0
ATLANTA
Book Spread
+3
Book Line
▲ Edge: +1.0 points (Atlanta)
Spread Distribution
AI Model
-42-28-140+14+28+42
Distribution centered around ATL +2.0 expected margin.
Margin of Victory (ATL)
CIN By 1-6 points
16.9%
CIN By 7-13 points
16.8%
ATL By 1-6 points
15.7%
ATL By 7-13 points
13.8%
AI Model Projected Score
Cincinnati
24.5
CINCINNATI
Book Implied: 27.80
Atlanta
22.5
ATLANTA
Book Implied: 24.80
Simulated Score
Cincinnati
28
CINCINNATI
Book Implied: 27.80
Atlanta
23
ATLANTA
Book Implied: 24.80
Projections Grades
Moneyline (ML)
Agreement
👑 Top Selection
AI
Bengals
Win
65% Win Prob
B
Sim
Bengals
Win
69% Win Prob
A
Point Spread (ATS)
Divergence
AI
Falcons (+3)
Loss
Proj Spread: +2.0
D
Sim
Bengals (-3)
Win
Proj Spread: -5.0
B
Over/Under (Total)
Agreement
AI
u52.5
Win
Proj Total: 47.0
A
Sim
u52.5
Win
Proj Total: 51.0
C
Head-to-Head History
Date
Game
Score
Nov 8, 2026
CIN @ ATL
34 - 17
Oct 23, 2022
ATL @ CIN
17 - 35
Sep 30, 2018
CIN @ ATL
37 - 36
Sep 14, 2014
ATL @ CIN
10 - 24
Oct 24, 2010
CIN @ ATL
32 - 39
Key Model Drivers
Net Passing Yards (L5)
+44.1% more
Cincinnati: 325.1
vs
Atlanta: 181.7
First Downs (L5)
+37.3% more
Cincinnati: 24.1
vs
Atlanta: 15.1
Third Down Efficiency (L5)
+34.0% more
Cincinnati: 0.6
vs
Atlanta: 0.3
Total Yards (L5)
+28.7% more
Cincinnati: 405.1
vs
Atlanta: 289.0
Post-Mortem Analysis
Metric
Projected
Actual
Score Game
CIN Score
24.5
34
ATL Score
22.5
17
Team Stats Splits (Home / Away)
First Downs
15.1 / 24.1
20.0 / 24.0
Net Passing Yards
181.7 / 325.1
162.0 / 265.0
Rushing Yards
107.3 / 80.1
157.0 / 123.0
Third Down Efficiency
0.3 / 0.6
0.5 / 0.6
Time of Possession
0.5 / 0.5
0.5 / 0.5
Total Yards
289.0 / 405.1
319.0 / 388.0
Turnovers
2.2 / 1.9
1.0 / 0.0
Yards Per Play
5.0 / 6.4
5.8 / 7.1
Public Market Splits
Moneyline
Open: -230 / +190
→
-173 / +155
↑
Spread (ATS)
Open: -5.5 / +5.5
→
-3 / +3
↑
Total (O/U)
Open: 49.5
→
52.5
↑
Situational Trends
📊 Win-Loss
CIN
Advantage
6-2-0
(75.0%)
Margin: 8.1
ATS +/-: +3.8
ATL
3-6-0
(33.3%)
Margin: -3.9
ATS +/-: -1.6
🎯 ATS (Spread)
CIN
Advantage
4-4-0
(50.0%)
Margin: 8.1
ATS +/-: +3.8
ATL
3-6-0
(33.3%)
Margin: -3.9
ATS +/-: -1.6
⚖️ Over/Under
CIN
5-3-0
O: 62.5% / U: 37.5%
Total +/-: +4.3
ATL
4-5-0
O: 44.4% / U: 55.6%
Total +/-: -0.6
Season to Date Model Accuracy
AI Model
SIM Engine
ATL
CIN
ATL
CIN
ML
56%
5-4
62%
5-3
33%
3-6
62%
5-3
ATS
33%
3-6
29%
2-5-1
33%
3-6
86%
6-1-1
TTL
33%
3-6
50%
4-4
44%
4-5
88%
7-1
Contextual Game News
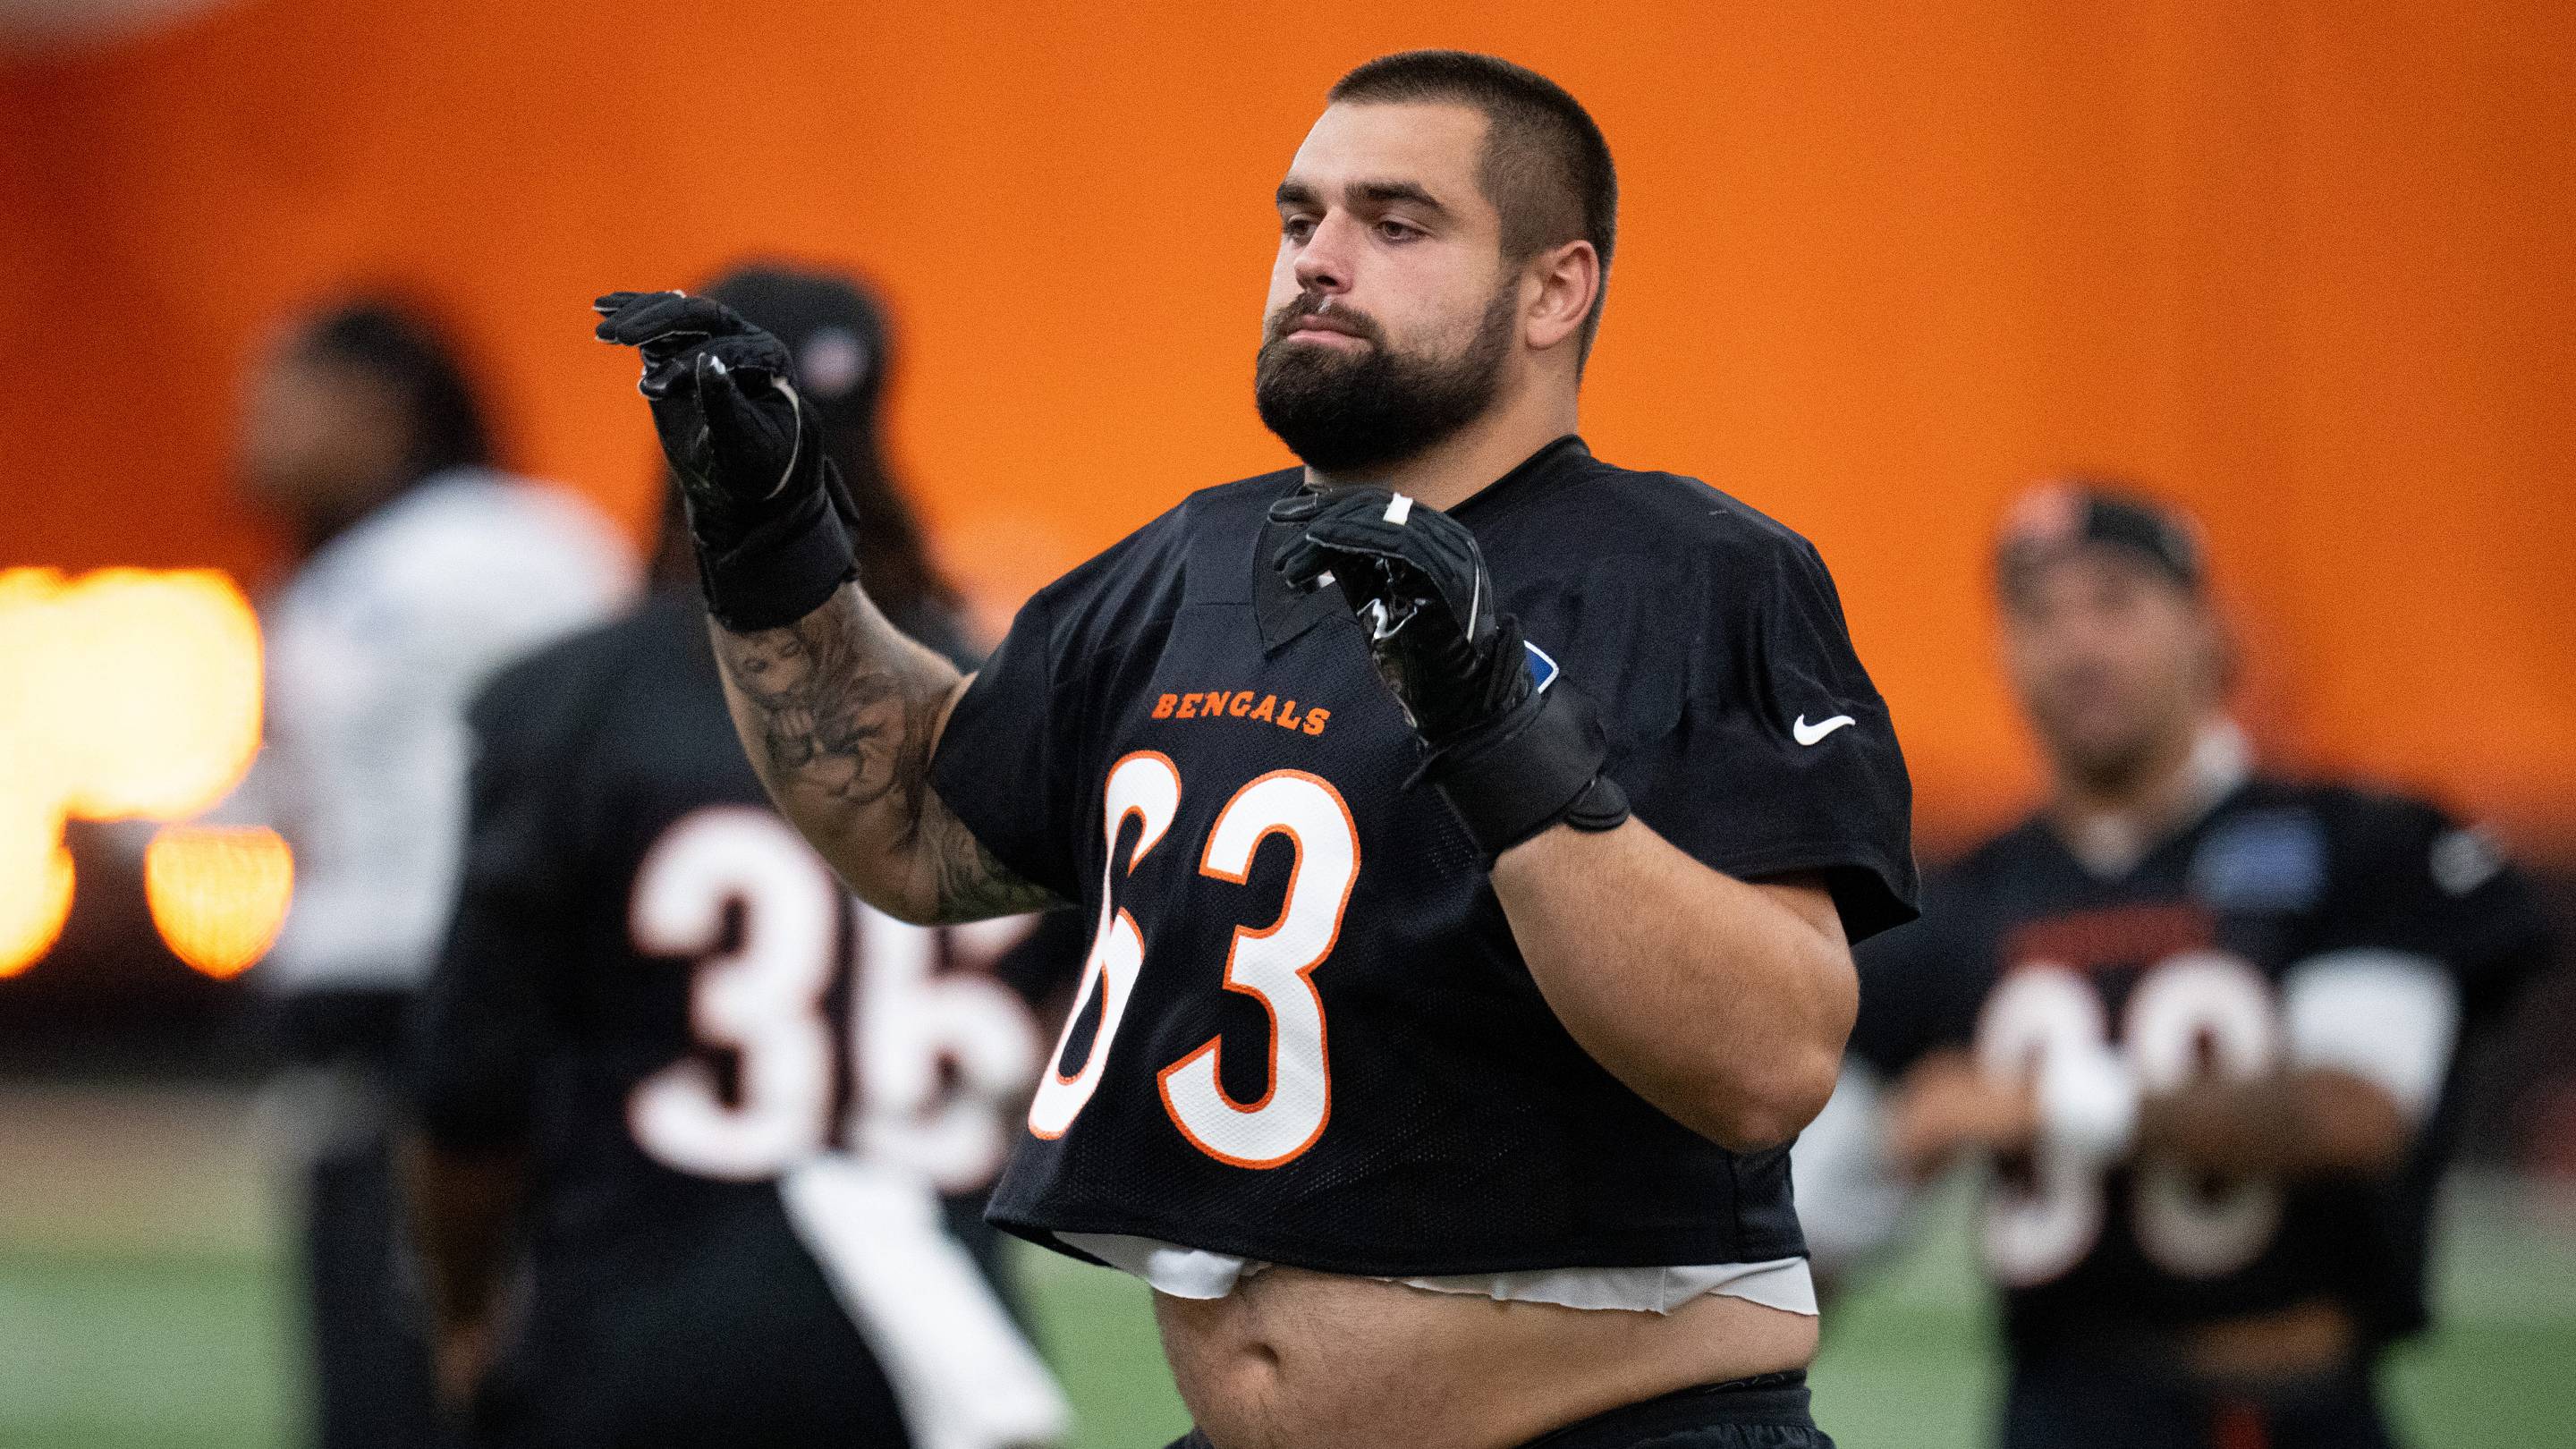
Bengals Injury Update: Dylan Fairchild Limited as Cincinnati Pre…

Bengals-Eagles Arnold Ebiketie Trade Collapses Over Compensatory…

Falcons Replace Kicker Nick Folk with Jake Moody in Roster Shake…
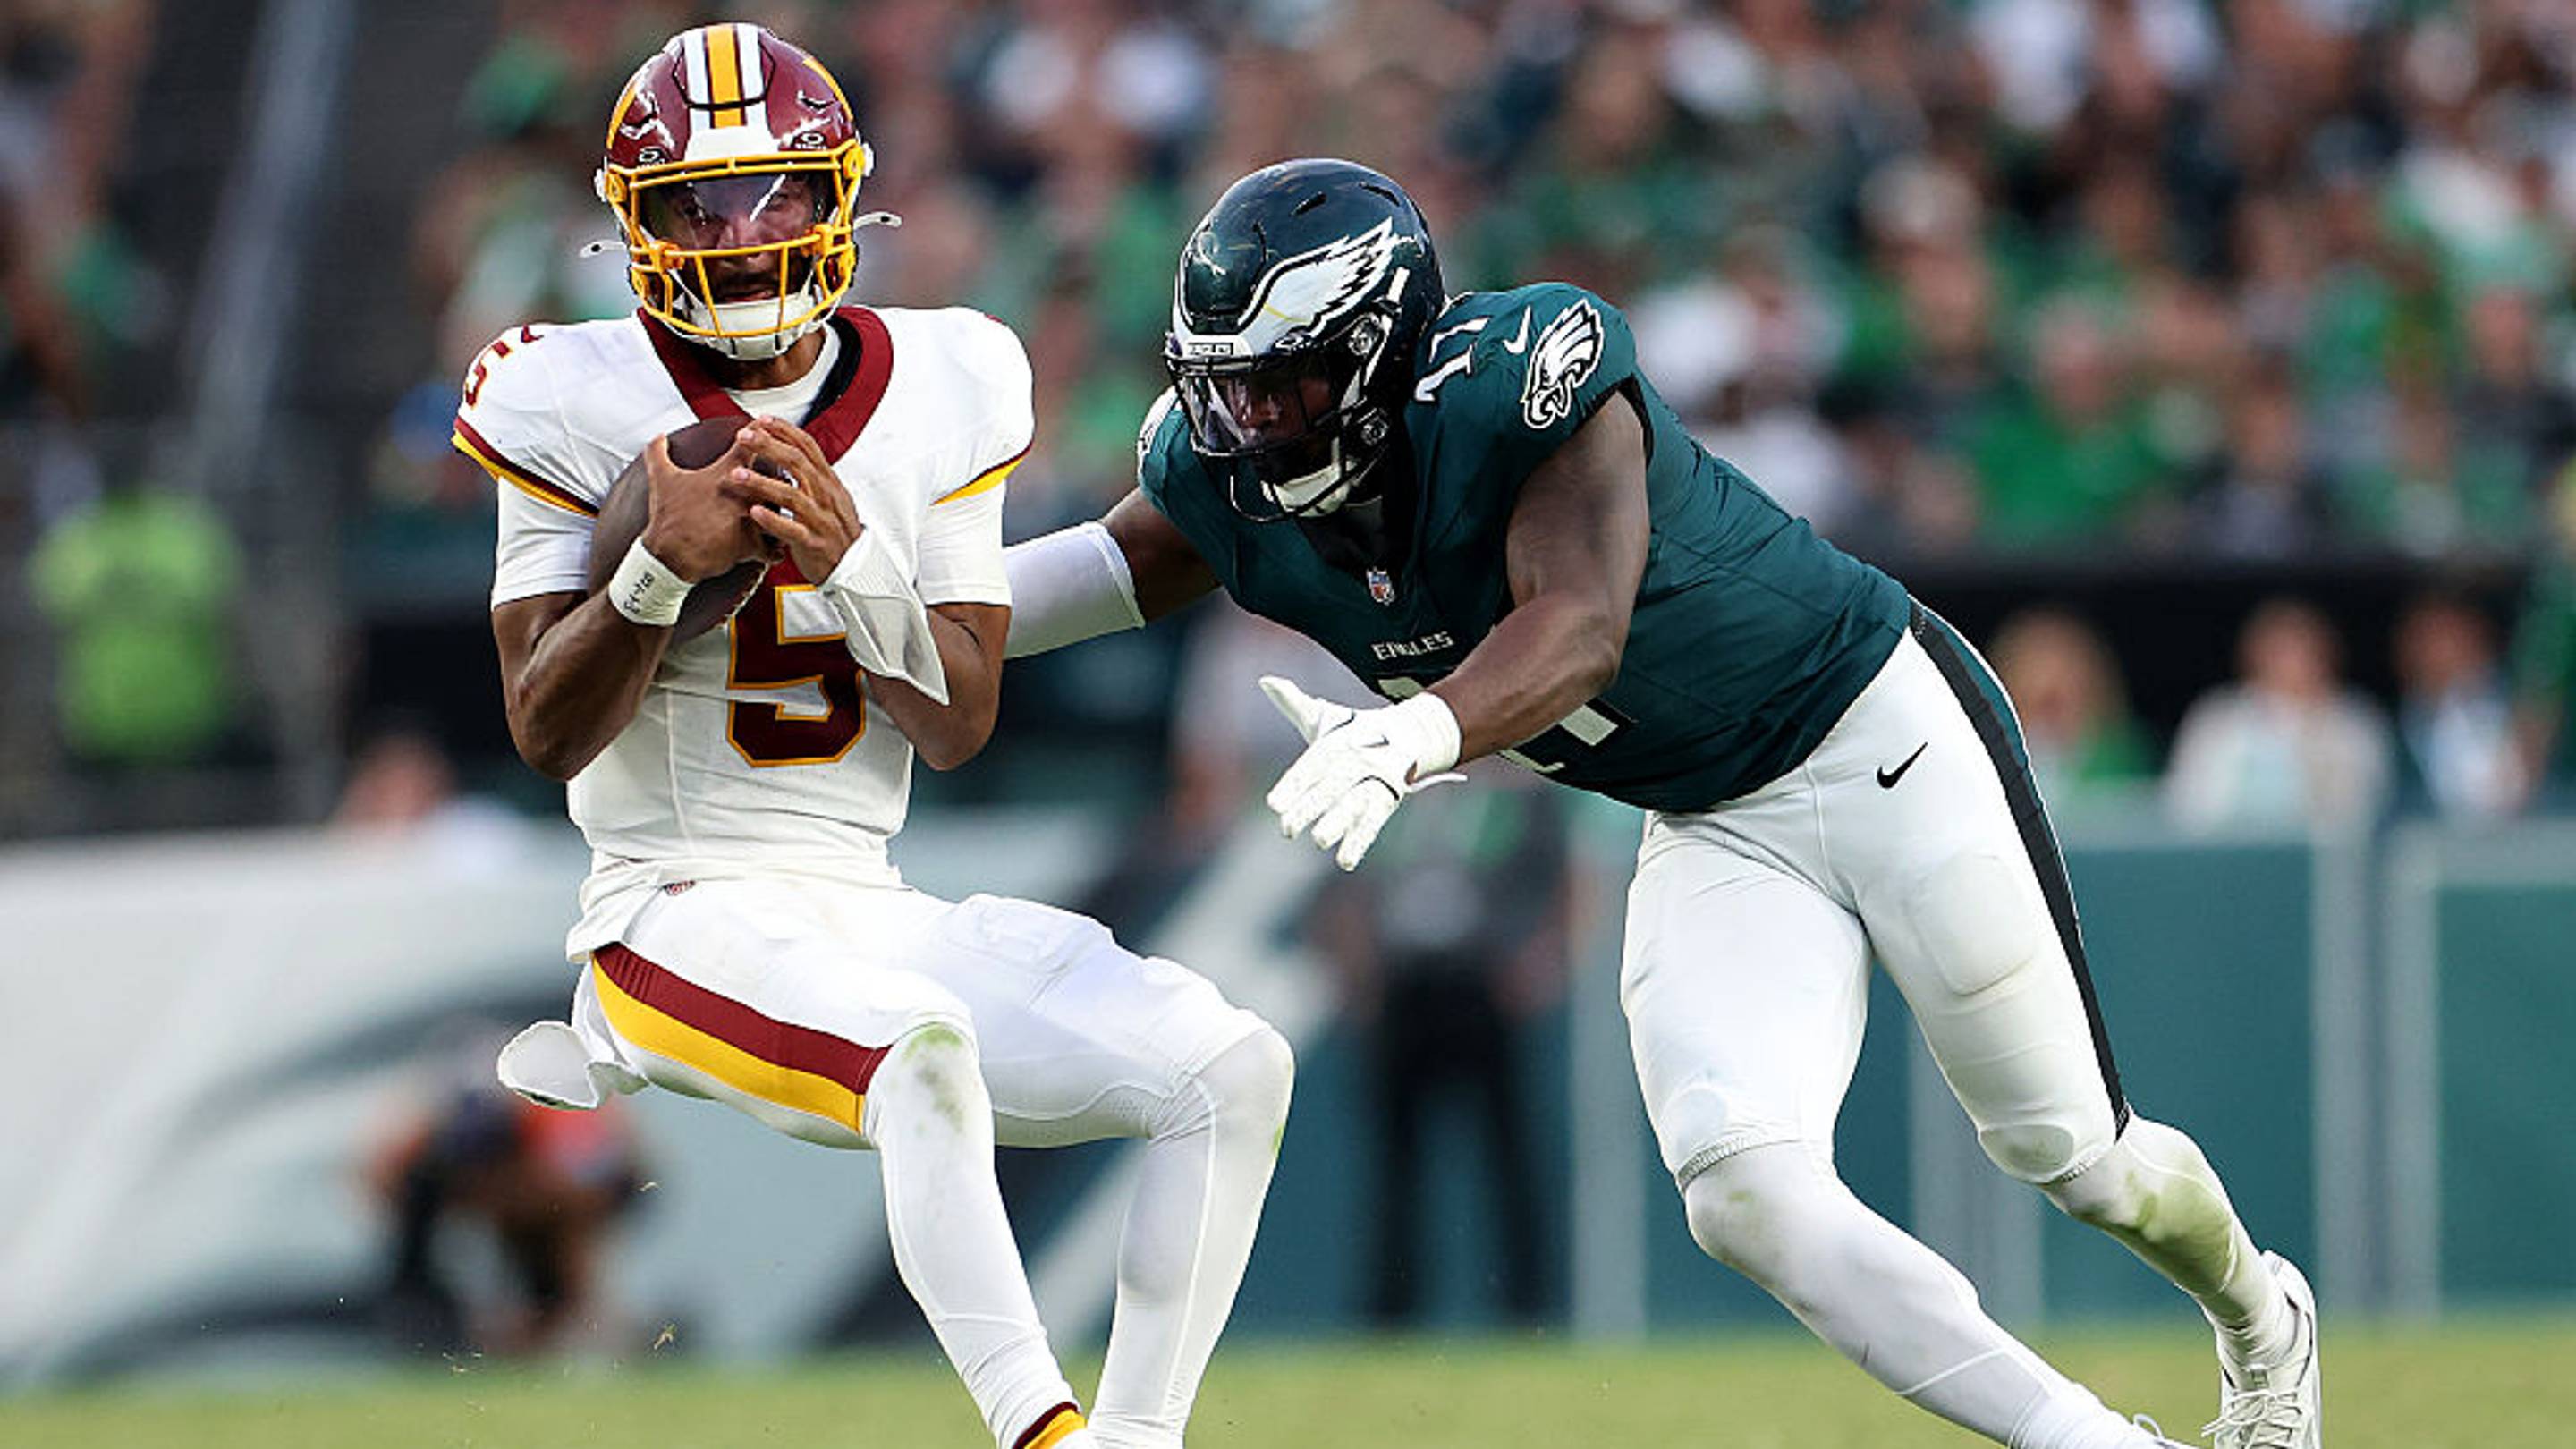
Bengals' Ebiketie Trade: Hidden Cost Turns Heads as Philadelphia…

Jaguars Land Pro Bowl Safety Jessie Bates III in Trade with Falc…