



OTTAWA
SENATORSOTT
8-5-0 | Road
1


VEGAS
GOLDEN KNIGHTSVGK
9-4-1 | Home
4
Goaltending

GOALTENDER
Jonas Johansson
#31 | Goaltender@

GOALTENDER
Adin Hill
#33 | Goaltender| Player | W-L-OTL | GAA | SV% | SO |
|---|---|---|---|---|
| Jonas Johansson | None-None | 2.06 | 0.926 | -- |
| Adin Hill | None-None | 1.00 | 0.962 | -- |
None-None
W-L-OTL
None-None
2.06
GAA
Ldr 1.00
0.926
Save %
Ldr 0.962
--
SO
--
AI Model Win Probability
SENATORS
44%
GOLDEN KNIGHTS
56%
▲ Edge: +2% (OTT)
SENATORS
42%
Book Odds: +136
GOLDEN KNIGHTS
62%
Book Odds: -162
AI Model Projected Total
AI Projection
6.0
Projected
Book Total
6.5
Over / Under Line
▼
Edge: +0.5 (Under)
Over 6.5
41%
Under 6.5
59%
AI Model Spread Expectation
AI Spread Proj
-1.6
VEGAS
Book Spread
-1.5
Book Line
▲ Edge: +0.1 points (Vegas)
Spread Distribution
AI Model
+6+4+20-2-4-6
Distribution centered around VGK -1.6 expected margin.
Margin of Victory (VGK)
OTT By 1 goal
8.6%
OTT By 2-3 goals
5.5%
VGK By 1 goal
18.9%
VGK By 2-3 goals
34.9%
AI Model Projected Score
Ottawa
2.2
OTTAWA
Book Implied: 2.50
Vegas
3.8
VEGAS
Book Implied: 4
Simulated Score
Ottawa
3
OTTAWA
Book Implied: 2.50
Vegas
2
VEGAS
Book Implied: 4
Projections Grades
Moneyline (ML)
Divergence
AI
Golden Knights
Win
56% Win Prob
D
Sim
Senators
Loss
70% Win Prob
A
Puck Line (ATS)
Divergence
AI
Golden Knights (-1.5)
Win
Proj Goals: -1.6
D
Sim
Senators (+1.5)
Loss
Proj Goals: -1.0
A
Over/Under (Total)
Agreement
👑 Top Selection
AI
u6.5
Win
Proj Total: 6.0
B
Sim
u6.5
Win
Proj Total: 5.0
A
Head-to-Head History
Date
Game
Score
Oct 27, 2026
OTT @ VGK
1 - 4
Jan 25, 2026
VGK @ OTT
1 - 7
Nov 26, 2025
OTT @ VGK
4 - 3
Nov 21, 2024
VGK @ OTT
3 - 2
Oct 25, 2024
OTT @ VGK
4 - 6
Key Model Drivers
Takeaways (L5)
+24.8% more
Vegas: 5.6
vs
Ottawa: 4.5
Power Play % (L5)
+10.1%
Vegas: 14.7%
vs
Ottawa: 4.6%
Blocked Shots (L5)
+9.0% more
Ottawa: 15.8
vs
Vegas: 14.3
Faceoff % (L5)
+4.5%
Ottawa: 52.7%
vs
Vegas: 48.2%
Post-Mortem Analysis
Metric
Projected
Actual
Score Game
OTT Score
2.2
1
VGK Score
3.8
4
Team Stats Splits (Home / Away)
Blocked Shots
14.3 / 15.8
24.0 / 6.0
Faceoff %
48.2 / 52.7
47.2 / 52.8
Hits
25.1 / 26.0
14.0 / 24.0
Power Play %
14.7 / 4.6
50.0 / 33.3
Shots on Goal
28.3 / 28.6
29.0 / 26.0
Takeaways
5.6 / 4.5
1.0 / 4.0
Public Market Splits
Moneyline
Open: +136 / -162
→
+136 / -162
Spread (ATS)
Open: +1.5 / -1.5
→
+1.5 / -1.5
Total (O/U)
Open: 6.5
→
6.5
Season to Date Model Accuracy
AI Model
SIM Engine
VGK
OTT
VGK
OTT
ML
67%
14-7
43%
9-12
52%
11-10
38%
8-13
ATS
48%
10-11
43%
9-12
62%
13-8
67%
14-7
TTL
38%
8-13
57%
12-9
57%
12-9
67%
14-7
Contextual Game News

Penguins' Hall of Fame Celebration Overshadowed by Brutal 4-1 Lo…

Maple Leafs Hit Rock Bottom: No More Moral Victories After Sixth…

Jakub Dobes Trade Talk: Canadiens Not Shopping Goalie, But Calls…
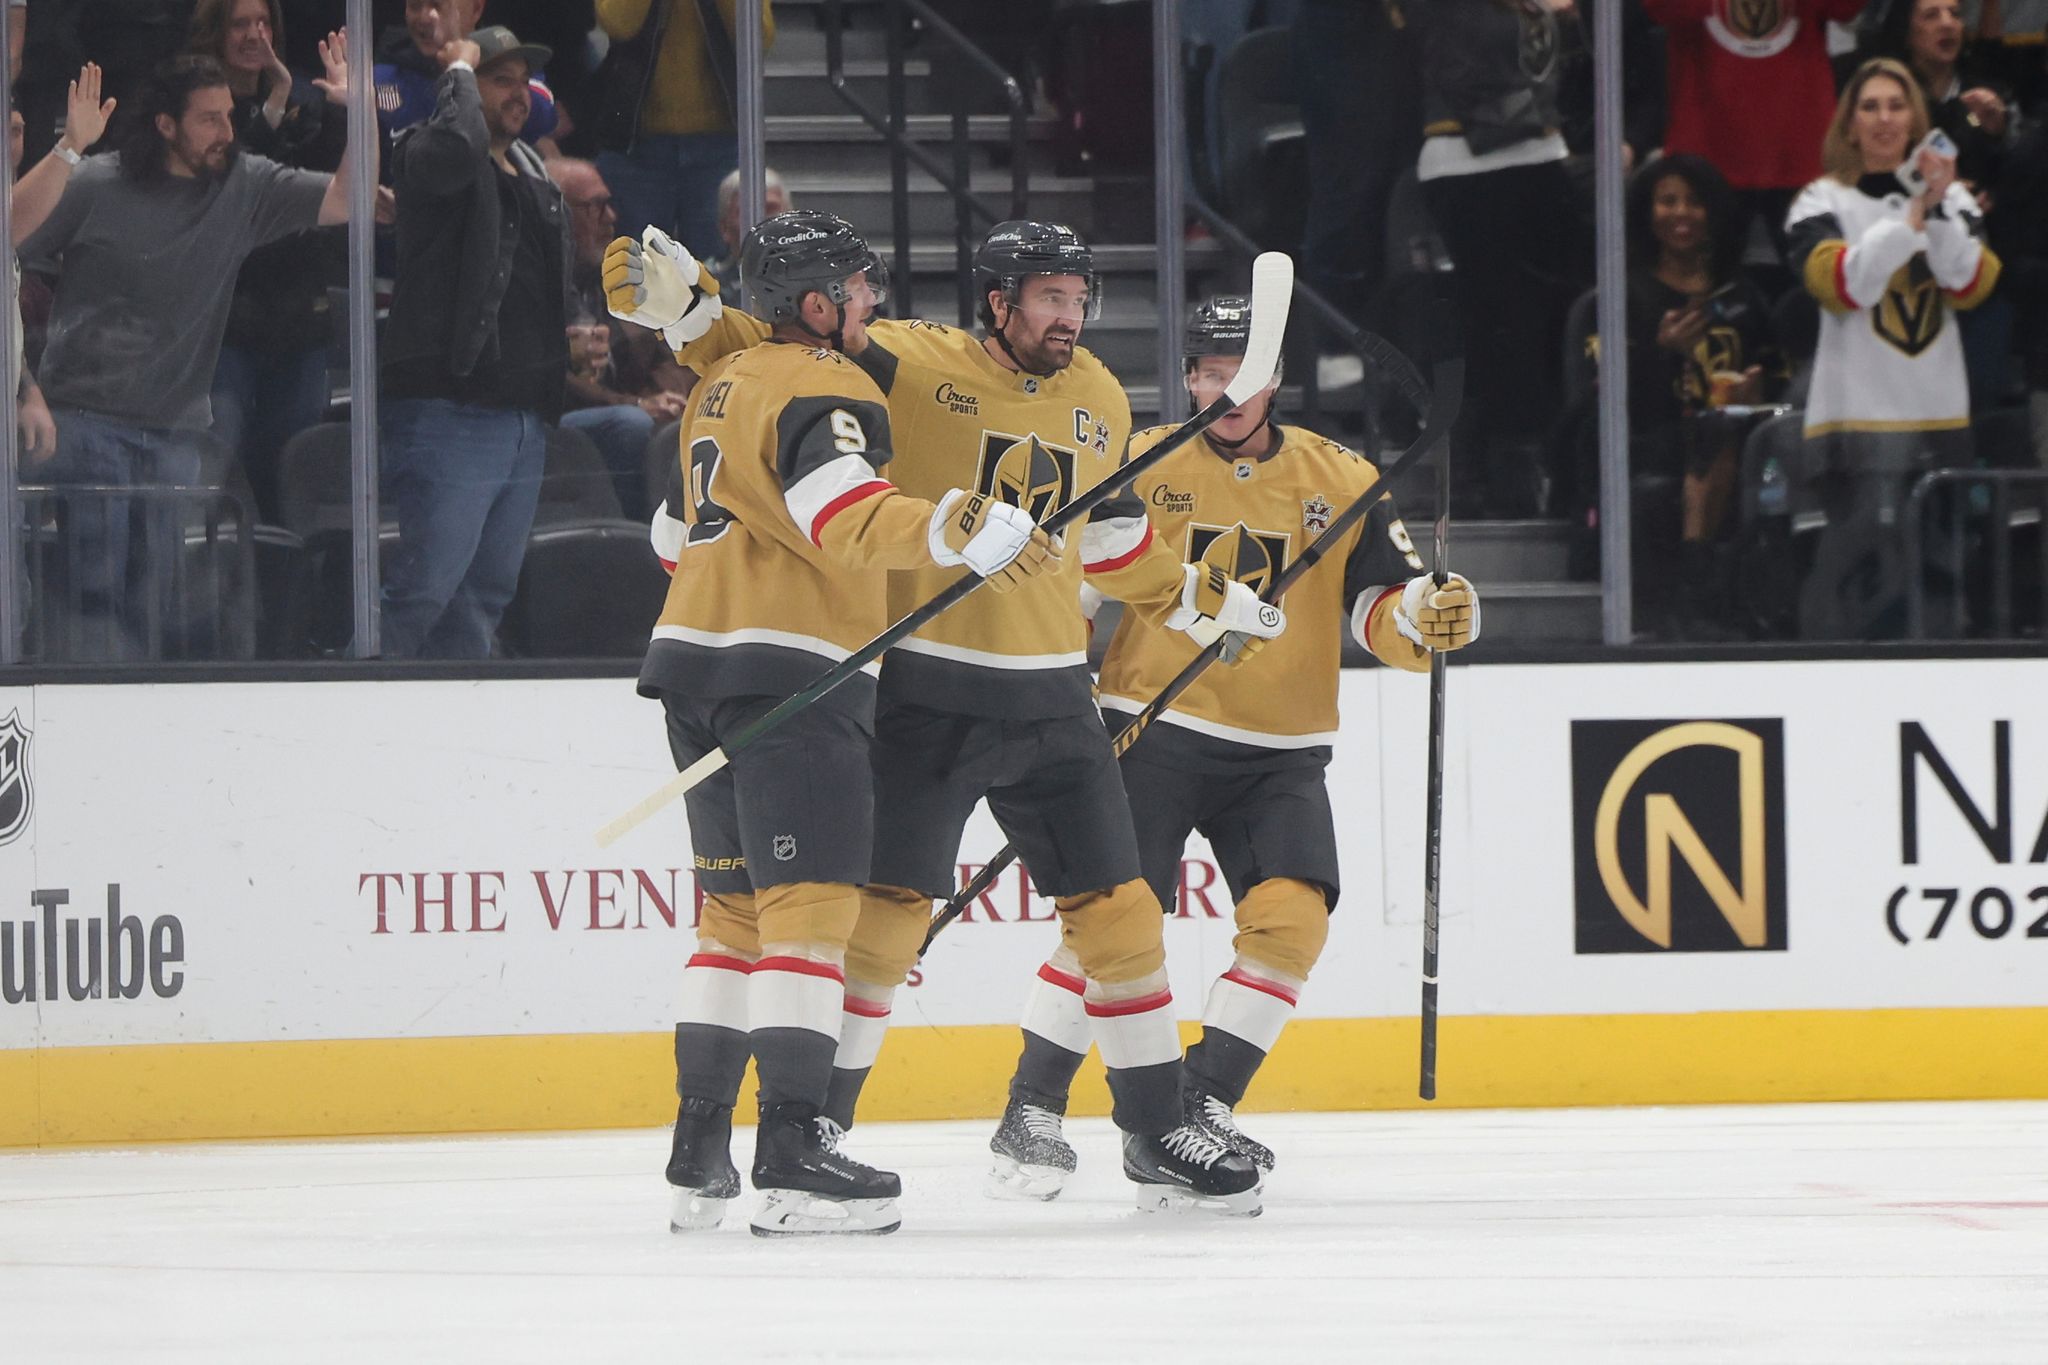
Mark Stone Nears Vegas Scoring Record as Golden Knights Down Uta…

Ovechkin: Russia's World Championship Fate Rests with Others, No…