


PENN STATE
PENN STATEPSU
5-4 | Road
28

WASHINGTON
WASHINGTONWASH
5-4 | Home
25
Key Game

KEY GAME
Ryan Barker
#94 | Place kicker@

KEY GAME
Tyler Robles
#95 | Place kicker| Player | |
|---|---|
| Ryan Barker | None-None |
| Tyler Robles | None-None |
None-None
W-L
None-None
AI Model Win Probability
PENN STATE
34%
WASHINGTON
66%
▲ Edge: +8.70% (WASH)
PENN STATE
47%
Book Odds: +114
WASHINGTON
57%
Book Odds: -135
AI Model Projected Total
AI Projection
51.4
Projected
Book Total
46.5
Over / Under Line
▲
Edge: +4.9 (Over)
Over 46.5
64%
Under 46.5
36%
AI Model Spread Expectation
AI Spread Proj
-7.0
WASHINGTON
Book Spread
-2.5
Book Line
▲ Edge: +4.5 points (Washington)
Spread Distribution
AI Model
+42+28+140-14-28-42
Distribution centered around WASH -7.0 expected margin.
Margin of Victory (WASH)
PSU By 1-6 points
12.9%
PSU By 7-13 points
9.6%
WASH By 1-6 points
16.5%
WASH By 7-13 points
19.3%
AI Model Projected Score
Penn State
22.2
PENN STATE
Book Implied: 22
Washington
29.2
WASHINGTON
Book Implied: 24.50
Simulated Score
Penn State
21
PENN STATE
Book Implied: 22
Washington
24
WASHINGTON
Book Implied: 24.50
Projections Grades
Moneyline (ML)
Agreement
AI
Washington
Loss
66% Win Prob
B
Sim
Washington
Loss
61% Win Prob
C
Point Spread (ATS)
Agreement
AI
Washington (-2.5)
Loss
Proj Spread: -7.0
B
Sim
Washington (-2.5)
Loss
Proj Spread: -3.0
D
Over/Under (Total)
Divergence
AI
o46.5
Win
Proj Total: 51.4
B
Sim
u46.5
Loss
Proj Total: 45.0
D
Head-to-Head History
Date
Game
Score
Nov 7, 2026
PSU @ WASH
28 - 25
Nov 9, 2024
WASH @ PSU
6 - 35
Dec 30, 2017
WASH @ PSU
28 - 35
Key Model Drivers
Turnovers (L5)
+32.1% more
Washington: 1.4
vs
Penn State: 1.1
Rushing Yards (L5)
+46.0% more
Penn State: 155.2
vs
Washington: 83.9
Total Yards (L5)
+9.0% more
Penn State: 385.6
vs
Washington: 350.7
Post-Mortem Analysis
Metric
Projected
Actual
Score Game
PSU Score
22.2
28
WASH Score
29.2
25
Team Stats Splits (Home / Away)
First Downs
19.8 / 20.7
15.0 / 21.0
Rushing Yards
83.9 / 155.2
134.0 / 174.0
Third Down Efficiency
0.4 / 0.3
0.33 / 0.47
Time of Possession
0.5 / 0.6
0.48 / 0.52
Total Yards
350.7 / 385.6
306.0 / 414.0
Turnovers
1.4 / 1.1
1.0 / 0.0
Public Market Splits
Moneyline
Open: +102 / -122
→
+114 / -135
↑
Spread (ATS)
Open: +2.5 / -2.5
→
+2.5 / -2.5
Total (O/U)
Open: 44.5
→
46.5
↑
Situational Trends
📊 Win-Loss
PSU
6-4-0
(60.0%)
Margin: 11.4
ATS +/-: +0.2
WASH
6-4-0
(60.0%)
Margin: 4.7
ATS +/-: -4.9
🎯 ATS (Spread)
PSU
Advantage
6-4-0
(60.0%)
Margin: 11.4
ATS +/-: +0.2
WASH
4-6-0
(40.0%)
Margin: 4.7
ATS +/-: -4.9
⚖️ Over/Under
PSU
5-5-0
O: 50.0% / U: 50.0%
Total +/-: +0.6
WASH
5-5-0
O: 50.0% / U: 50.0%
Total +/-: -3.0
Season to Date Model Accuracy
AI Model
SIM Engine
WASH
PSU
WASH
PSU
ML
70%
7-3
70%
7-3
60%
6-4
60%
6-4
ATS
80%
8-2
40%
4-6
40%
4-6
20%
2-8
TTL
70%
7-3
80%
8-2
40%
4-6
50%
5-5
Contextual Game News
UConn's Arizona Loss Exposes Critical Flaw Ahead of Duke Showdown
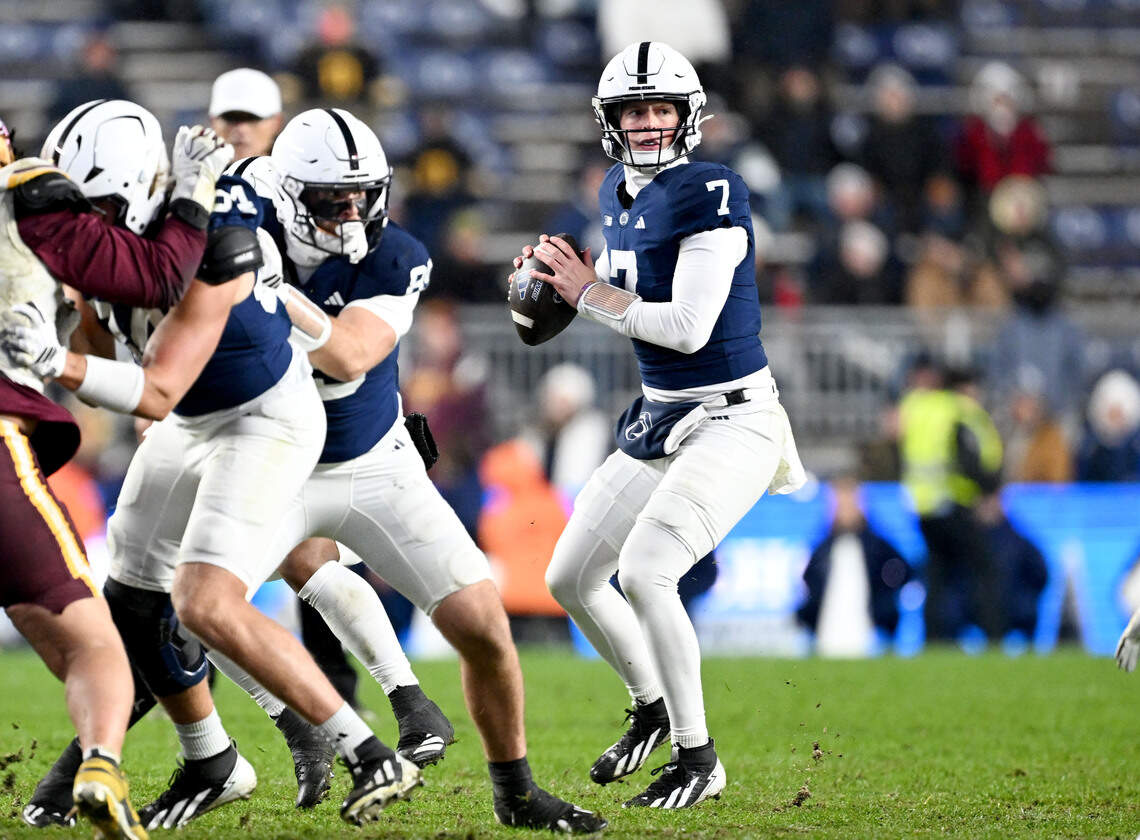
Penn State Eyes Backup QB Alex Manske as Senior Day Clash with R…

Penn State vs. Rutgers: Game Time, TV Channel, Streaming, and Od…

Penn State Eyes Strong Finish: Five Storylines Ahead of Rutgers …
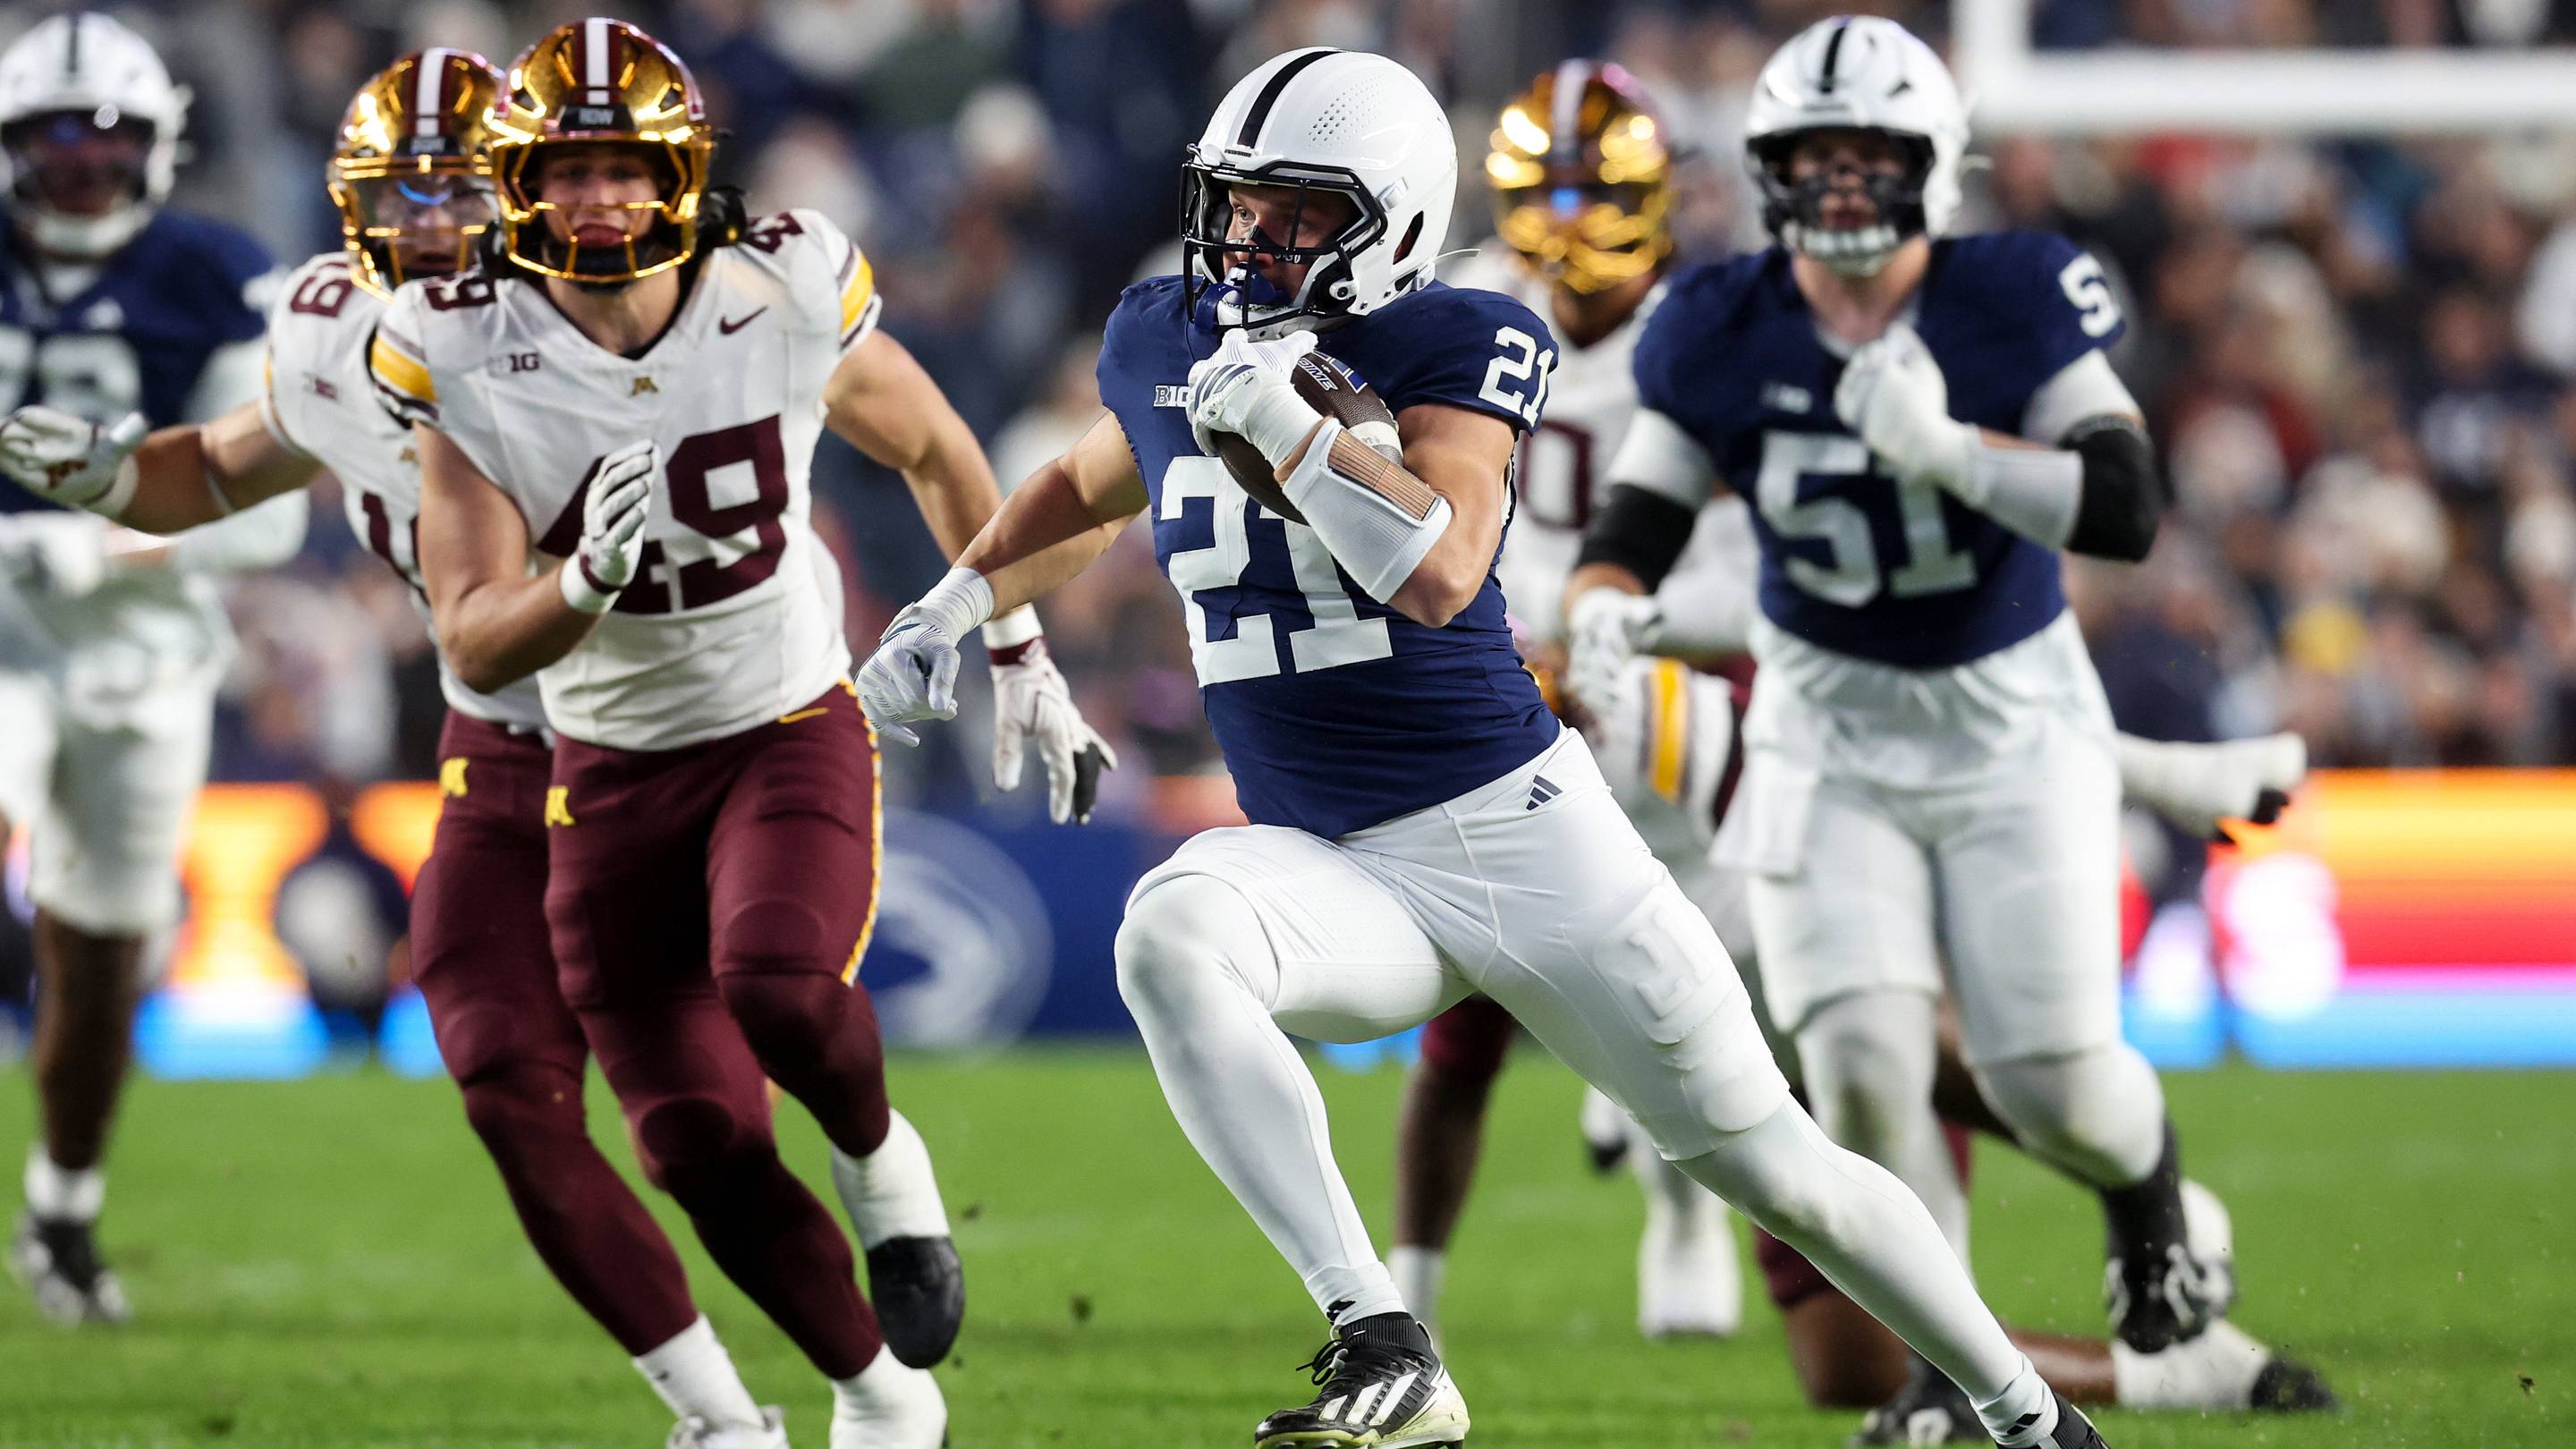
Carson Hansen Shines with Career-Best Showing Before Injury Ends…