


UCLA
UCLAUCLA
9-0 | Road
34

MINNESOTA
MINNESOTAMINN
5-4 | Home
20
Key Game

KEY GAME
Chase Barry
#45 | Punter@

KEY GAME
Luke Drzewiecki
#-- | Place kicker| Player | |
|---|---|
| Chase Barry | None-None |
| Luke Drzewiecki | None-None |
None-None
W-L
None-None
AI Model Win Probability
UCLA
53%
MINNESOTA
47%
▲ Edge: +7.30% (MINN)
UCLA
63%
Book Odds: -171
MINNESOTA
40%
Book Odds: +153
AI Model Projected Total
AI Projection
51.5
Projected
Book Total
38.5
Over / Under Line
▲
Edge: +13.0 (Over)
Over 38.5
77%
Under 38.5
23%
AI Model Spread Expectation
AI Spread Proj
+1.5
MINNESOTA
Book Spread
+3.5
Book Line
▲ Edge: +2.0 points (Minnesota)
Spread Distribution
AI Model
-42-28-140+14+28+42
Distribution centered around MINN +1.5 expected margin.
Margin of Victory (MINN)
UCLA By 1-6 points
16.8%
UCLA By 7-13 points
16.5%
MINN By 1-6 points
15.9%
MINN By 7-13 points
14.2%
AI Model Projected Score
UCLA
26.5
UCLA
Book Implied: 21
Minnesota
25
MINNESOTA
Book Implied: 17.50
Simulated Score
UCLA
21
UCLA
Book Implied: 21
Minnesota
17
MINNESOTA
Book Implied: 17.50
Projections Grades
Moneyline (ML)
Agreement
AI
UCLA
Win
53% Win Prob
D
Sim
UCLA
Win
66% Win Prob
B
Point Spread (ATS)
Divergence
AI
Minnesota (+3.5)
Loss
Proj Spread: +1.5
C
Sim
UCLA (-3.5)
Win
Proj Spread: -4.0
D
Over/Under (Total)
Divergence
AI
o38.5
Win
Proj Total: 51.5
A
Sim
u38.5
Loss
Proj Total: 38.0
D
Head-to-Head History
Date
Game
Score
Nov 7, 2026
UCLA @ MINN
34 - 20
Oct 12, 2024
MINN @ UCLA
21 - 17
Key Model Drivers
Rushing Yards (L5)
+50.5% more
UCLA: 177.2
vs
Minnesota: 87.7
First Downs (L5)
+34.5% more
UCLA: 19.2
vs
Minnesota: 12.6
Total Yards (L5)
+33.9% more
UCLA: 380.6
vs
Minnesota: 251.8
Third Down Efficiency (L5)
+16.0% more
UCLA: 0.4
vs
Minnesota: 0.3
Post-Mortem Analysis
Metric
Projected
Actual
Score Game
UCLA Score
26.5
34
MINN Score
25.0
20
Team Stats Splits (Home / Away)
First Downs
12.6 / 19.2
14.0 / 15.0
Rushing Yards
87.7 / 177.2
91.0 / 163.0
Third Down Efficiency
0.3 / 0.4
0.27 / 0.46
Time of Possession
0.5 / 0.6
0.55 / 0.45
Total Yards
251.8 / 380.6
296.0 / 466.0
Turnovers
1.2 / 1.3
1.0 / 2.0
Public Market Splits
Moneyline
Open: -238 / +195
→
-171 / +153
↑
Spread (ATS)
Open: -6.5 / +6.5
→
-3.5 / +3.5
↑
Total (O/U)
Open: 42.5
→
38.5
↓
Situational Trends
📊 Win-Loss
UCLA
Advantage
10-0-0
(100.0%)
Margin: 18.3
ATS +/-: +10.6
MINN
5-5-0
(50.0%)
Margin: -0.4
ATS +/-: -0.8
🎯 ATS (Spread)
UCLA
Advantage
9-1-0
(90.0%)
Margin: 18.3
ATS +/-: +10.6
MINN
6-4-0
(60.0%)
Margin: -0.4
ATS +/-: -0.8
⚖️ Over/Under
UCLA
4-6-0
O: 40.0% / U: 60.0%
Total +/-: -2.6
MINN
5-5-0
O: 50.0% / U: 50.0%
Total +/-: +2.4
Season to Date Model Accuracy
AI Model
SIM Engine
MINN
UCLA
MINN
UCLA
ML
50%
5-5
70%
7-3
90%
9-1
70%
7-3
ATS
30%
3-7
44%
4-5-1
60%
6-4
22%
2-7-1
TTL
60%
6-4
30%
3-7
30%
3-7
30%
3-7
Contextual Game News

Luke Dehnicke's Unconventional Path Leads Tight End to Northwest…

Penn State Eyes Strong Finish: Five Storylines Ahead of Rutgers …

CFP Expansion to 24 Teams Sparks Backlash as Week 11 Shakes Up P…
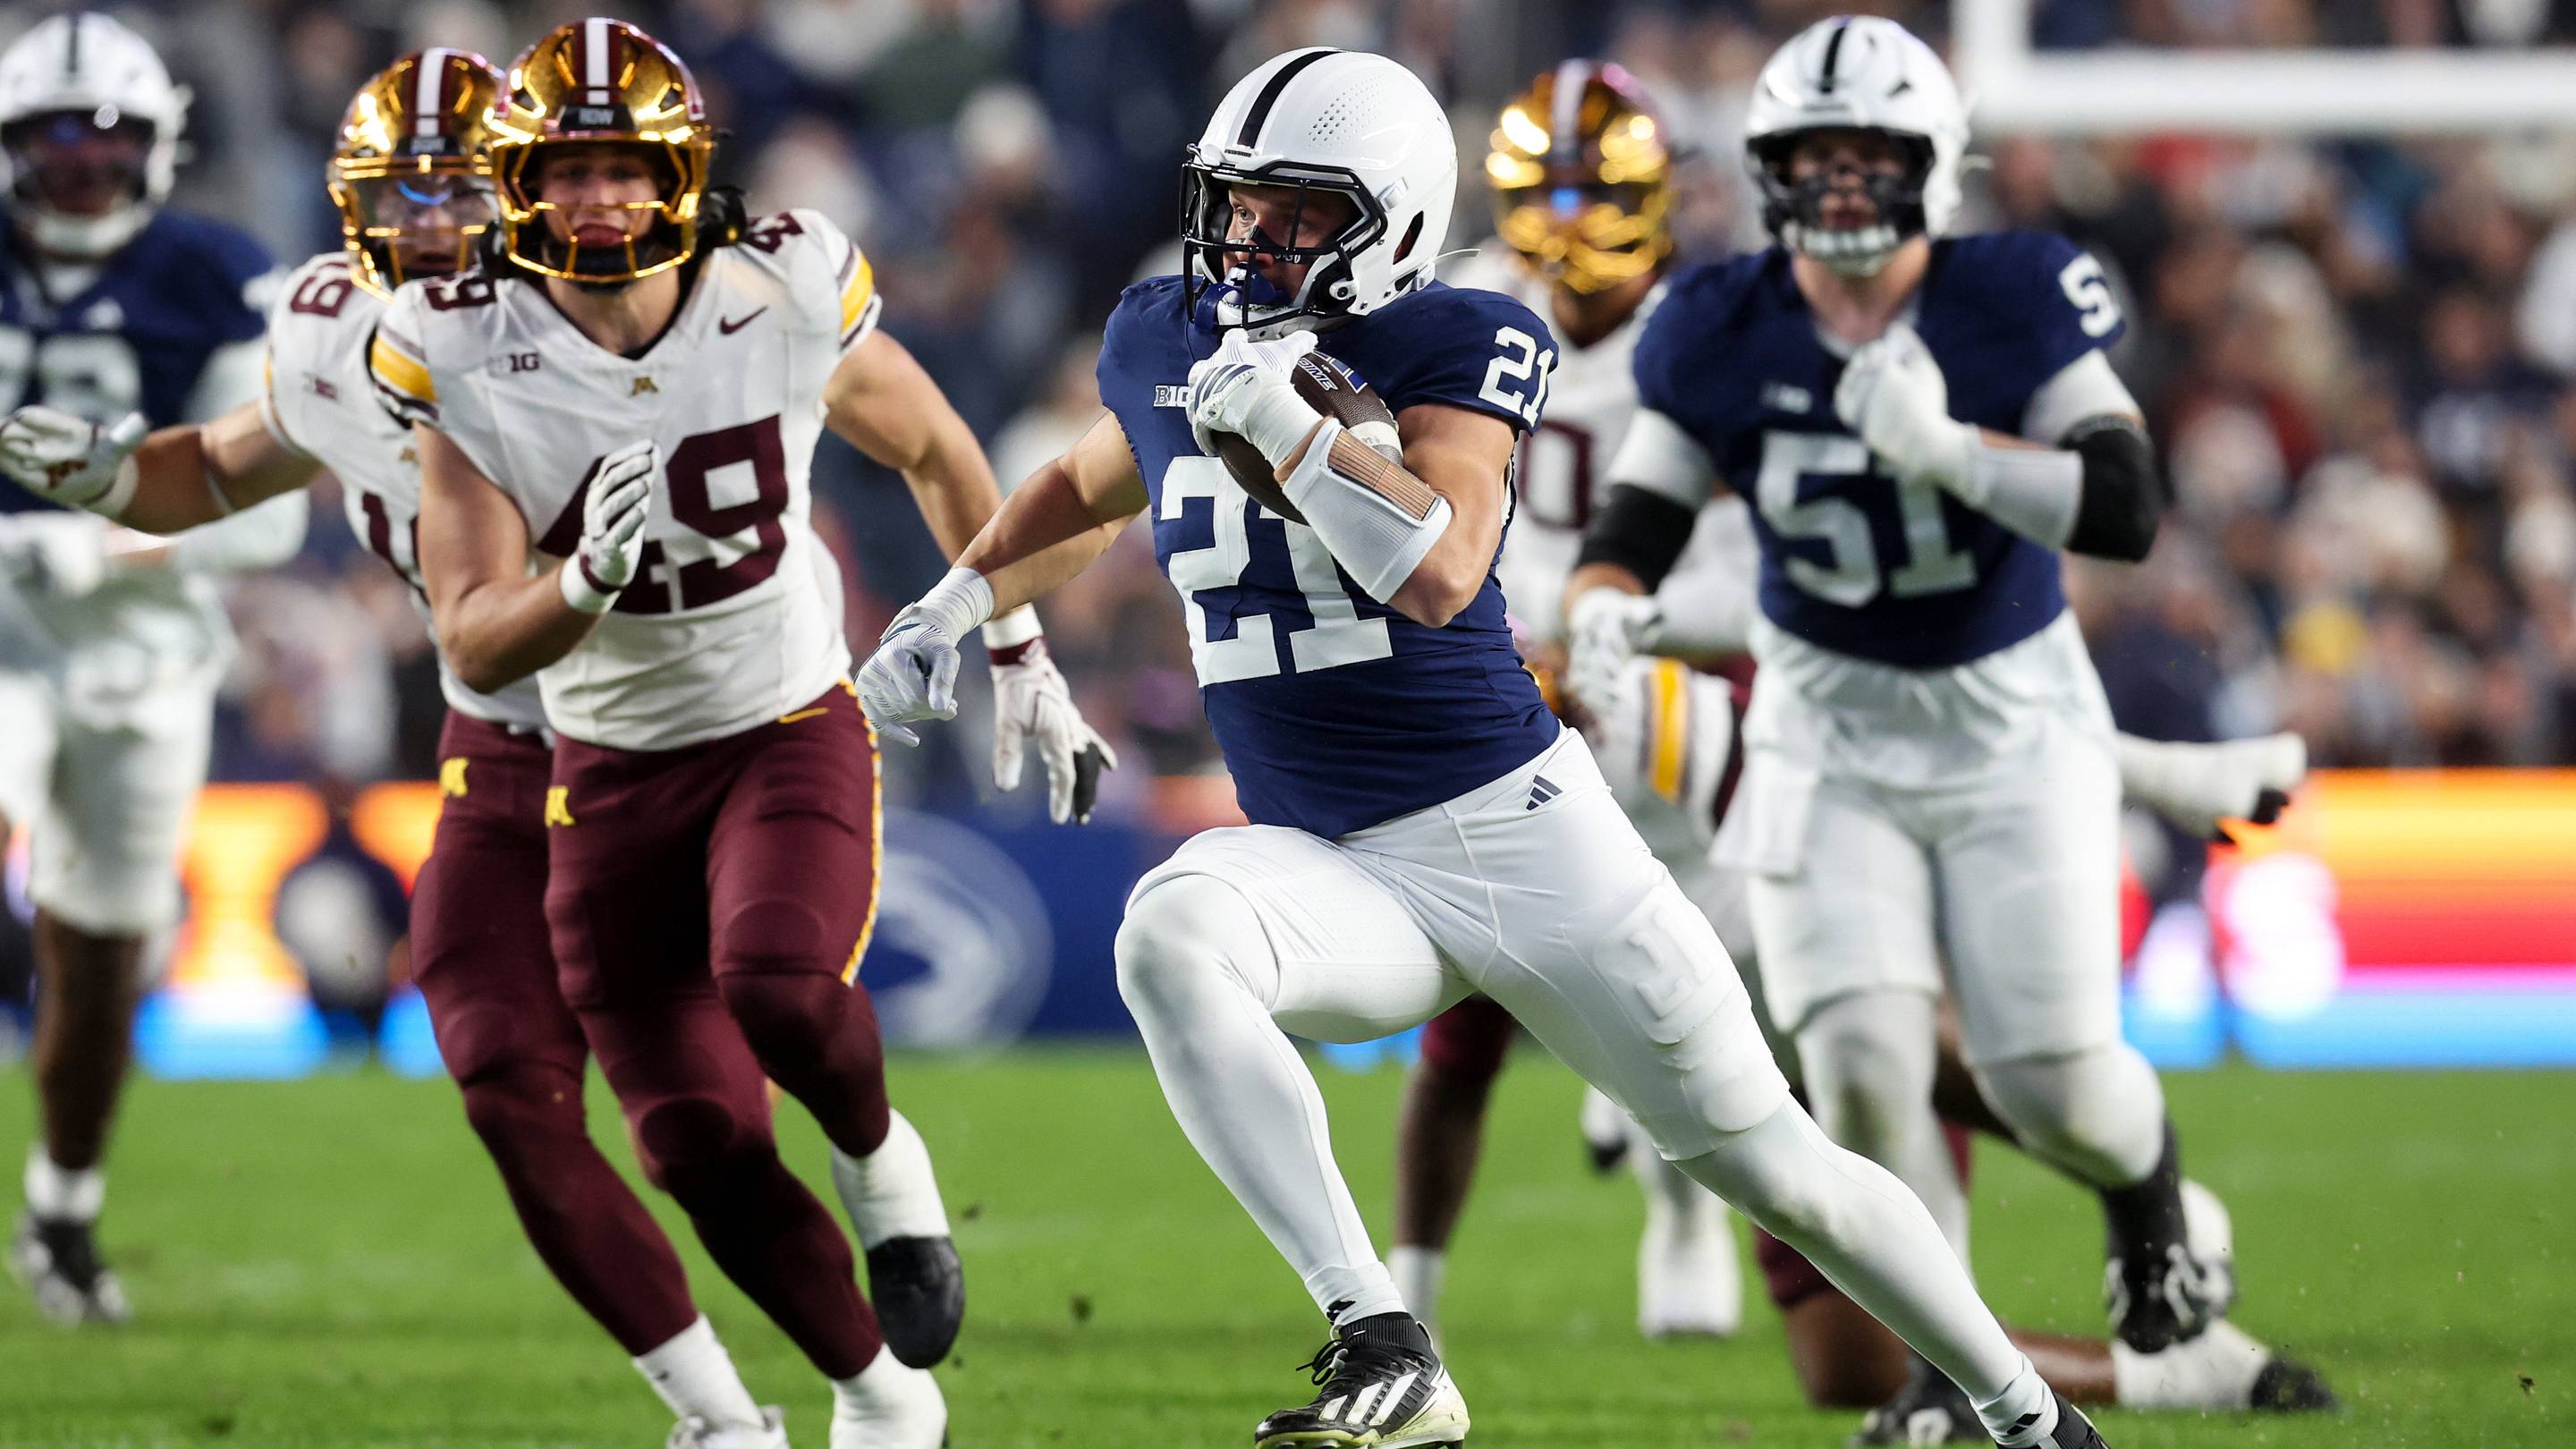
Carson Hansen Shines with Career-Best Showing Before Injury Ends…

UCLA's QB Woes Deepen: Ty Dieffenbach Injured, Madden Iamaleava …