



DETROIT
PISTONSDET
3-0 | Road
106


PHILADELPHIA
76ERSPHI
3-1 | Home
93
Key Game
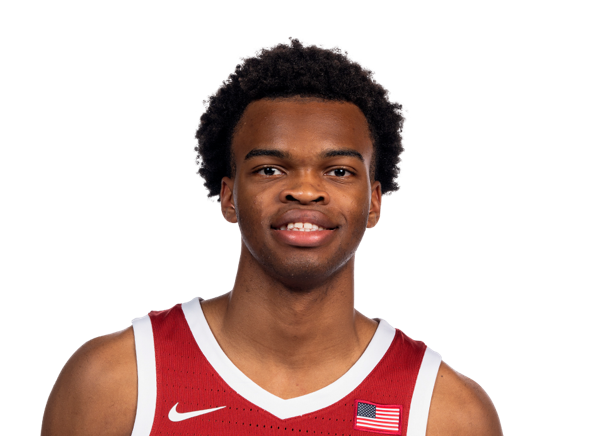
KEY GAME
Ebuka Okorie
#23 | Guard@
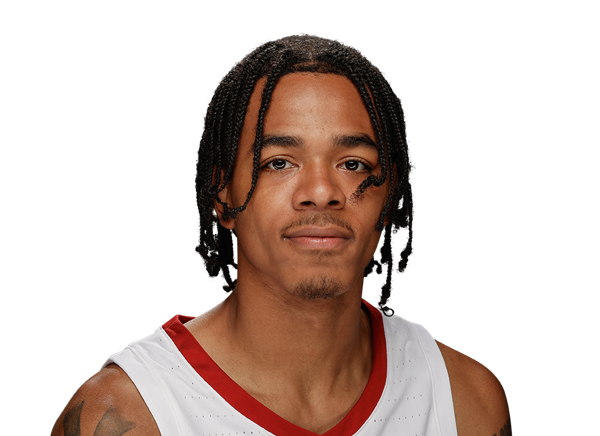
KEY GAME
Labaron Philon Jr.
#00 | Guard| Player | |
|---|---|
| Ebuka Okorie | None-None |
| Labaron Philon Jr. | None-None |
None-None
W-L
None-None
AI Model Win Probability
PISTONS
64%
76ERS
36%
▲ Edge: +9.80% (DET)
PISTONS
55%
Book Odds: -120
76ERS
48%
Book Odds: +110
AI Model Projected Total
AI Projection
216.4
Projected
Book Total
228.5
Over / Under Line
▼
Edge: +12.1 (Under)
Over 228.5
27%
Under 228.5
73%
AI Model Spread Expectation
AI Spread Proj
-8.0
DETROIT
Book Spread
-1.5
Book Line
▲ Edge: +6.5 points (Detroit)
Spread Distribution
AI Model
-30-20-100+10+20+30
Distribution centered around DET -8.0 expected margin.
Margin of Victory (DET)
DET By 1-7 points
25.3%
DET By 8-14 points
26.2%
PHI By 1-7 points
13.7%
PHI By 8-14 points
4.8%
AI Model Projected Score
Detroit
112.2
DETROIT
Book Implied: 115
Philadelphia
104.2
PHILADELPHIA
Book Implied: 113.50
Simulated Score
Detroit
107
DETROIT
Book Implied: 115
Philadelphia
104
PHILADELPHIA
Book Implied: 113.50
Projections Grades
Moneyline (ML)
Agreement
AI
Pistons
Win
64% Win Prob
B
Sim
Pistons
Win
59% Win Prob
C
Point Spread (ATS)
Agreement
AI
Pistons (-1.5)
Win
Proj Spread: -8.0
A
Sim
Pistons (-1.5)
Win
Proj Spread: -3.0
C
Over/Under (Total)
Agreement
👑 Top Selection
AI
u228.5
Win
Proj Total: 216.4
A
Sim
u228.5
Win
Proj Total: 211.0
A
Head-to-Head History
Date
Game
Score
Nov 4, 2026
PHI @ DET
112 - 106
Oct 25, 2026
DET @ PHI
106 - 93
Apr 4, 2026
DET @ PHI
116 - 93
Mar 12, 2026
PHI @ DET
109 - 131
Nov 14, 2025
PHI @ DET
105 - 114
Key Model Drivers
Blocks (L5)
+34.7% more
Detroit: 6.0
vs
Philadelphia: 3.9
Turnovers (L5)
+26.7% more
Detroit: 17.6
vs
Philadelphia: 12.9
Turnovers (L5)
+21.0% more
Detroit: 14.9
vs
Philadelphia: 11.8
Rebounding (L5)
+14.6% more
Detroit: 46.8
vs
Philadelphia: 40.0
Post-Mortem Analysis
Metric
Projected
Actual
Score Game
DET Score
112.2
106
PHI Score
104.2
93
Team Stats Splits (Home / Away)
3pt Field Goal %
33.0 / 40.6
26.0 / 41.0
Assists
24.7 / 27.8
22.0 / 25.0
Blocks
3.9 / 6.0
8.0 / 11.0
Field Goal %
43.8 / 47.2
40.0 / 44.0
Free Throw %
78.9 / 80.3
61.0 / 64.0
Rebounding
40.0 / 46.8
37.0 / 54.0
Steals
9.8 / 8.1
10.0 / 4.0
Turnovers
12.9 / 17.6
11.0 / 17.0
Public Market Splits
Moneyline
Open: +110 / -130
→
-120 / +110
↓
Spread (ATS)
Open: +2.5 / -2.5
→
-1.5 / +1.5
↓
Total (O/U)
Open: 226.5
→
228.5
↑
Situational Trends
📊 Win-Loss
DET
8-3-0
(72.7%)
Margin: 7.7
ATS +/-: +3.3
PHI
Advantage
10-3-0
(76.9%)
Margin: 1.8
ATS +/-: -1.4
🎯 ATS (Spread)
DET
Advantage
7-4-0
(63.6%)
Margin: 7.7
ATS +/-: +3.3
PHI
7-6-0
(53.8%)
Margin: 1.8
ATS +/-: -1.4
⚖️ Over/Under
DET
6-5-0
O: 54.6% / U: 45.5%
Total +/-: +2.7
PHI
5-8-0
O: 38.5% / U: 61.5%
Total +/-: -8.3
Season to Date Model Accuracy
AI Model
SIM Engine
PHI
DET
PHI
DET
ML
62%
8-5
82%
9-2
62%
8-5
82%
9-2
ATS
38%
5-8
73%
8-3
46%
6-7
82%
9-2
TTL
69%
9-4
45%
5-6
54%
7-6
73%
8-3
Contextual Game News

Pistons' Revamped Bench Fuels Hot Start and Playoff Hopes

Cade Cunningham's 52-Point, 11-Assist Masterpiece Without Turnov…
Eastern Conference Power Rankings: Hornets Plunge, Hawks Surge a…
Phillies Escape Moneyball Basement Thanks to All-Star Arms

Paul George Steals the Show as Celtics Dominate 76ers in Tatum-B…