



TORONTO
RAPTORSTOR
2-1 | Road
94


MINNESOTA
TIMBERWOLVESMIN
3-0 | Home
117
Key Game

KEY GAME
Alijah Martin
#55 | Guard@
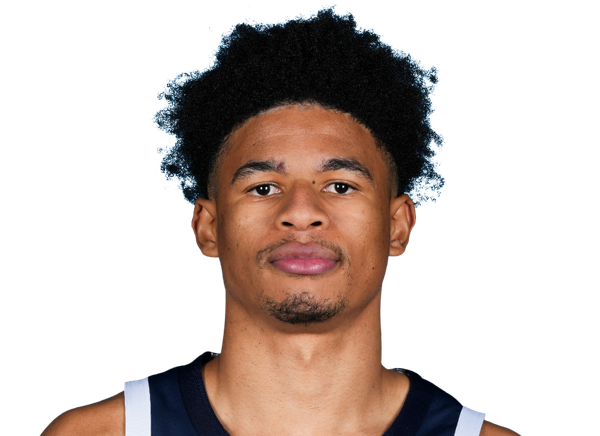
KEY GAME
Zyon Pullin
#15 | Guard| Player | |
|---|---|
| Alijah Martin | None-None |
| Zyon Pullin | None-None |
None-None
W-L
None-None
AI Model Win Probability
RAPTORS
51%
TIMBERWOLVES
49%
▲ Edge: +9.50% (TOR)
RAPTORS
42%
Book Odds: +140
TIMBERWOLVES
60%
Book Odds: -150
AI Model Projected Total
AI Projection
223.5
Projected
Book Total
228.5
Over / Under Line
▼
Edge: +5.0 (Under)
Over 228.5
39%
Under 228.5
61%
AI Model Spread Expectation
AI Spread Proj
-1.5
TORONTO
Book Spread
+3.5
Book Line
▲ Edge: +5.0 points (Toronto)
Spread Distribution
AI Model
-30-20-100+10+20+30
Distribution centered around TOR -1.5 expected margin.
Margin of Victory (TOR)
TOR By 1-7 points
26.6%
TOR By 8-14 points
17.7%
MIN By 1-7 points
23.7%
MIN By 8-14 points
12.9%
AI Model Projected Score
Toronto
112.5
TORONTO
Book Implied: 112.50
Minnesota
111
MINNESOTA
Book Implied: 116
Simulated Score
Toronto
107
TORONTO
Book Implied: 112.50
Minnesota
108
MINNESOTA
Book Implied: 116
Projections Grades
Moneyline (ML)
Divergence
AI
Raptors
Loss
51% Win Prob
D
Sim
Timberwolves
Win
53% Win Prob
D
Point Spread (ATS)
Agreement
AI
Raptors (+3.5)
Loss
Proj Spread: -1.5
C
Sim
Raptors (+3.5)
Loss
Proj Spread: +1.0
D
Over/Under (Total)
Agreement
👑 Top Selection
AI
u228.5
Win
Proj Total: 223.5
B
Sim
u228.5
Win
Proj Total: 215.0
A
Head-to-Head History
Date
Game
Score
Oct 25, 2026
TOR @ MIN
94 - 117
Mar 5, 2026
TOR @ MIN
107 - 115
Feb 4, 2026
MIN @ TOR
128 - 126
Nov 21, 2024
MIN @ TOR
105 - 110
Oct 26, 2024
TOR @ MIN
101 - 112
Key Model Drivers
Blocks (L5)
+47.4% more
Toronto: 6.0
vs
Minnesota: 3.1
Steals (L5)
+30.7% more
Toronto: 11.9
vs
Minnesota: 8.2
Turnovers (L5)
+11.4% more
Toronto: 14.6
vs
Minnesota: 13.0
Free Throw % (L5)
+9.0%
Toronto: 77.1%
vs
Minnesota: 68.1%
Post-Mortem Analysis
Metric
Projected
Actual
Score Game
TOR Score
112.5
94
MIN Score
111.0
117
Team Stats Splits (Home / Away)
3pt Field Goal %
36.7 / 29.1
48.0 / 26.0
Assists
25.1 / 27.0
26.0 / 20.0
Blocks
3.1 / 6.0
7.0 / 6.0
Field Goal %
42.8 / 44.9
56.0 / 38.0
Free Throw %
68.1 / 77.1
64.0 / 67.0
Rebounding
49.9 / 46.6
49.0 / 34.0
Steals
8.2 / 11.9
10.0 / 15.0
Turnovers
13.0 / 14.6
24.0 / 17.0
Public Market Splits
Moneyline
Open: +110 / -130
→
+140 / -150
↑
Spread (ATS)
Open: +2.5 / -2.5
→
+3.5 / -3.5
↑
Total (O/U)
Open: 231.5
→
228.5
↓
Situational Trends
📊 Win-Loss
TOR
5-7-0
(41.7%)
Margin: 1.4
ATS +/-: +0.2
MIN
Advantage
9-3-0
(75.0%)
Margin: 13.4
ATS +/-: +11.8
🎯 ATS (Spread)
TOR
5-7-0
(41.7%)
Margin: 1.4
ATS +/-: +0.2
MIN
Advantage
11-1-0
(91.7%)
Margin: 13.4
ATS +/-: +11.8
⚖️ Over/Under
TOR
6-6-0
O: 50.0% / U: 50.0%
Total +/-: +0.3
MIN
6-6-0
O: 50.0% / U: 50.0%
Total +/-: -3.9
Season to Date Model Accuracy
AI Model
SIM Engine
MIN
TOR
MIN
TOR
ML
58%
7-5
75%
9-3
75%
9-3
67%
8-4
ATS
67%
8-4
42%
5-7
42%
5-7
25%
3-9
TTL
42%
5-7
50%
6-6
33%
4-8
25%
3-9
Contextual Game News

Timberwolves Demolish Mavericks as LaMelo Ball Shines in Season-…

Cade Cunningham's 52-Point, 11-Assist Masterpiece Without Turnov…
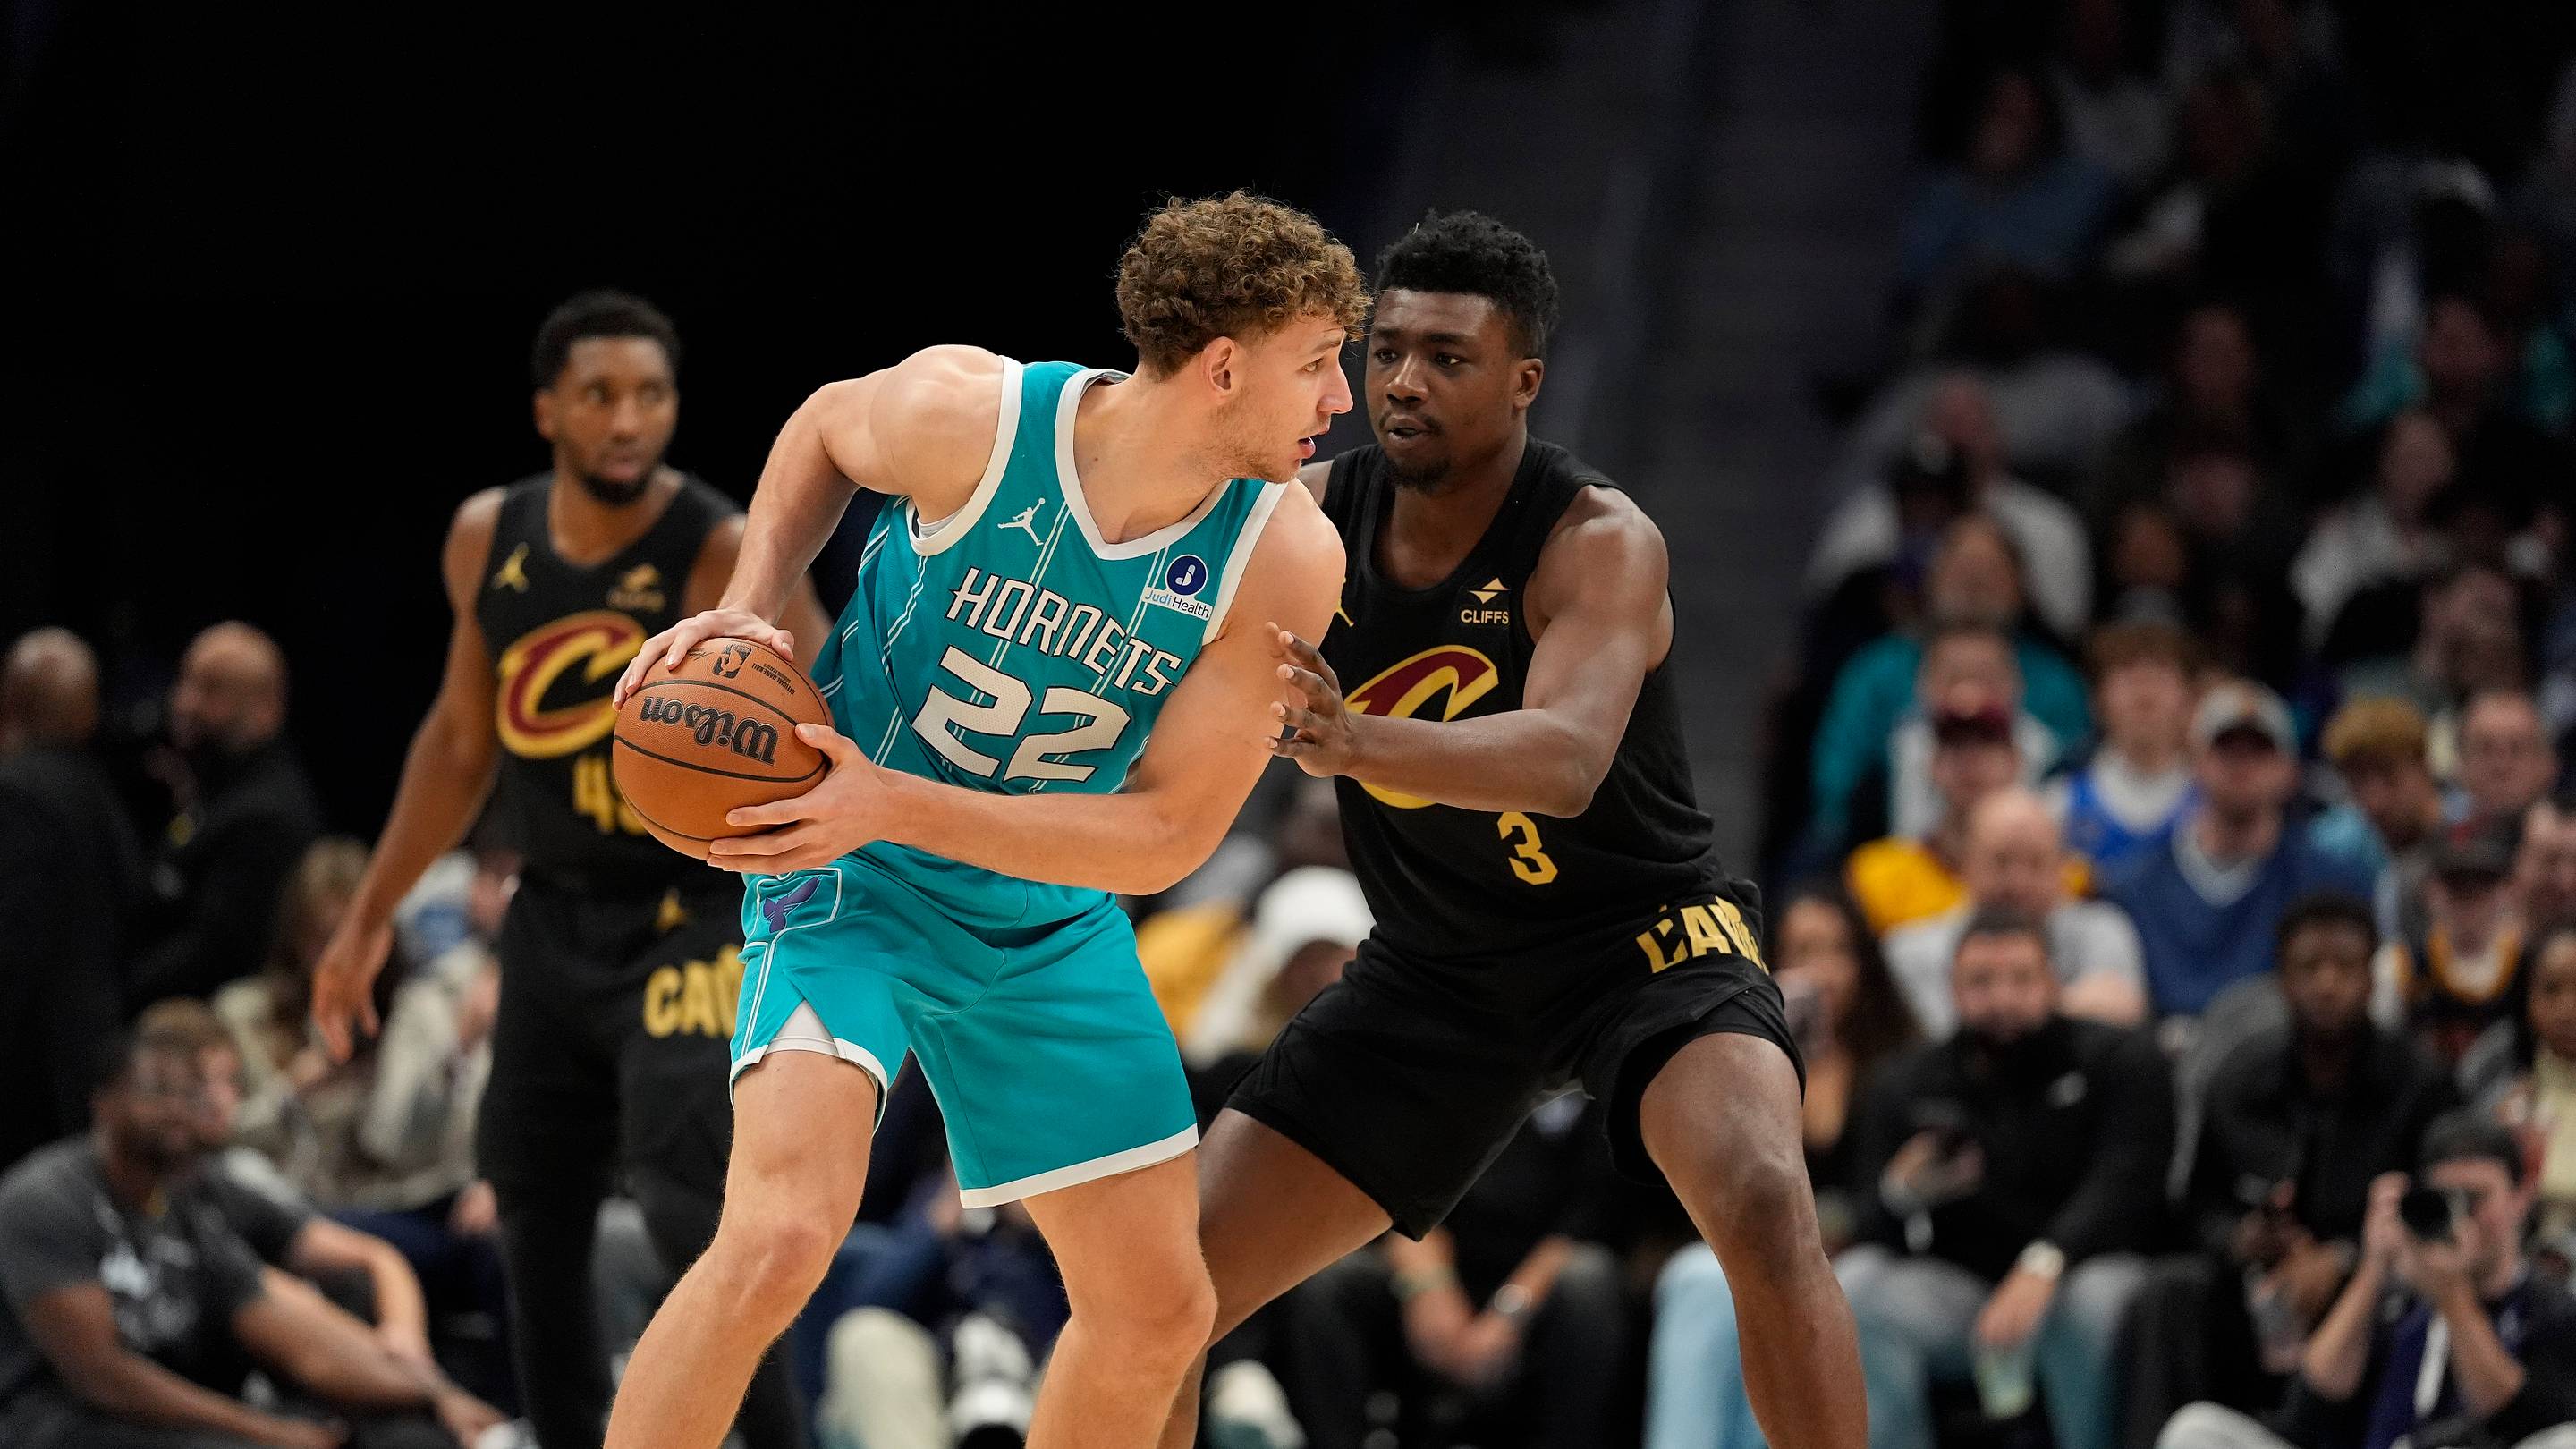
Hornets' Four-Game Road Swing: What Defines Success?
Stephen Curry Sidelined with Torn Oblique, Warriors Face Extende…

Warriors Brace for Extended Absence as Curry Diagnosed with Obli…