



ORLANDO
MAGICORL
1-2 | Road
111

NEW YORK
KNICKSNY
0-3 | Home
102
Key Game
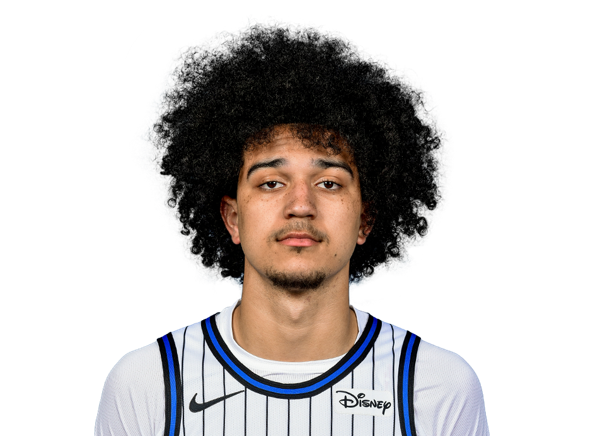
KEY GAME
Anthony Black
#0 | Guard@
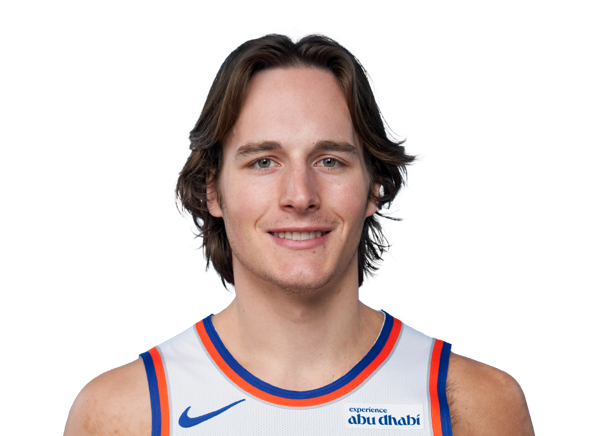
KEY GAME
Tyler Kolek
#13 | Guard| Player | |
|---|---|
| Anthony Black | None-None |
| Tyler Kolek | None-None |
None-None
W-L
None-None
AI Model Win Probability
MAGIC
21%
KNICKS
79%
▲ Edge: +11.60% (NY)
MAGIC
34%
Book Odds: +195
KNICKS
68%
Book Odds: -210
AI Model Projected Total
AI Projection
213.0
Projected
Book Total
224.5
Over / Under Line
▼
Edge: +11.5 (Under)
Over 224.5
26%
Under 224.5
74%
AI Model Spread Expectation
AI Spread Proj
-11.0
NEW YORK
Book Spread
-6.5
Book Line
▲ Edge: +4.5 points (New York)
Spread Distribution
AI Model
+30+20+100-10-20-30
Distribution centered around NY -11.0 expected margin.
Margin of Victory (NY)
ORL By 1-7 points
9.3%
ORL By 8-14 points
2.7%
NY By 1-7 points
21.6%
NY By 8-14 points
27.4%
AI Model Projected Score
Orlando
101
ORLANDO
Book Implied: 109
New York
112
NEW YORK
Book Implied: 115.50
Simulated Score
Orlando
102
ORLANDO
Book Implied: 109
New York
107
NEW YORK
Book Implied: 115.50
Projections Grades
Moneyline (ML)
Agreement
👑 Top Selection
AI
Knicks
Loss
79% Win Prob
A
Sim
Knicks
Loss
64% Win Prob
B
Point Spread (ATS)
Divergence
AI
Knicks (-6.5)
Loss
Proj Spread: -11.0
B
Sim
Magic (+6.5)
Win
Proj Spread: +5.0
C
Over/Under (Total)
Agreement
👑 Top Selection
AI
u224.5
Win
Proj Total: 213.0
A
Sim
u224.5
Win
Proj Total: 209.0
A
Head-to-Head History
Date
Game
Score
Oct 25, 2026
ORL @ NY
111 - 102
Dec 13, 2025
NY @ ORL
132 - 120
Dec 7, 2025
ORL @ NY
100 - 106
Nov 22, 2025
NY @ ORL
121 - 133
Nov 12, 2025
ORL @ NY
124 - 107
Key Model Drivers
Rebounding (L5)
+16.2% more
New York: 46.6
vs
Orlando: 40.1
3pt Field Goal % (L5)
+8.8%
New York: 37.3%
vs
Orlando: 28.6%
Free Throw % (L5)
+4.3%
New York: 72.5%
vs
Orlando: 68.2%
Turnovers (L5)
+35.8% more
Orlando: 16.5
vs
New York: 10.6
Post-Mortem Analysis
Metric
Projected
Actual
Score Game
ORL Score
101.0
111
NY Score
112.0
102
Team Stats Splits (Home / Away)
3pt Field Goal %
37.3 / 28.6
24.0 / 43.0
Assists
22.8 / 23.0
26.0 / 29.0
Blocks
4.4 / 4.6
4.0 / 6.0
Field Goal %
42.1 / 43.1
41.0 / 43.0
Free Throw %
72.5 / 68.2
71.0 / 81.0
Rebounding
46.6 / 40.1
45.0 / 49.0
Steals
6.7 / 8.8
8.0 / 6.0
Turnovers
15.5 / 16.2
16.0 / 16.0
Public Market Splits
Moneyline
Open: +285 / -347
→
+195 / -210
↓
Spread (ATS)
Open: +8.5 / -8.5
→
+6.5 / -6.5
↓
Total (O/U)
Open: 225
→
224.5
↓
Situational Trends
📊 Win-Loss
ORL
4-7-0
(36.4%)
Margin: -5.5
ATS +/-: -3.9
NY
Advantage
6-5-0
(54.6%)
Margin: 6.8
ATS +/-: 0.0
🎯 ATS (Spread)
ORL
Advantage
5-6-0
(45.5%)
Margin: -5.5
ATS +/-: -3.9
NY
4-7-0
(36.4%)
Margin: 6.8
ATS +/-: 0.0
⚖️ Over/Under
ORL
5-6-0
O: 45.5% / U: 54.6%
Total +/-: -2.1
NY
3-8-0
O: 27.3% / U: 72.7%
Total +/-: -11.2
Season to Date Model Accuracy
AI Model
SIM Engine
NY
ORL
NY
ORL
ML
55%
6-5
55%
6-5
64%
7-4
64%
7-4
ATS
27%
3-8
45%
5-6
64%
7-4
64%
7-4
TTL
55%
6-5
45%
5-6
64%
7-4
64%
7-4
Contextual Game News
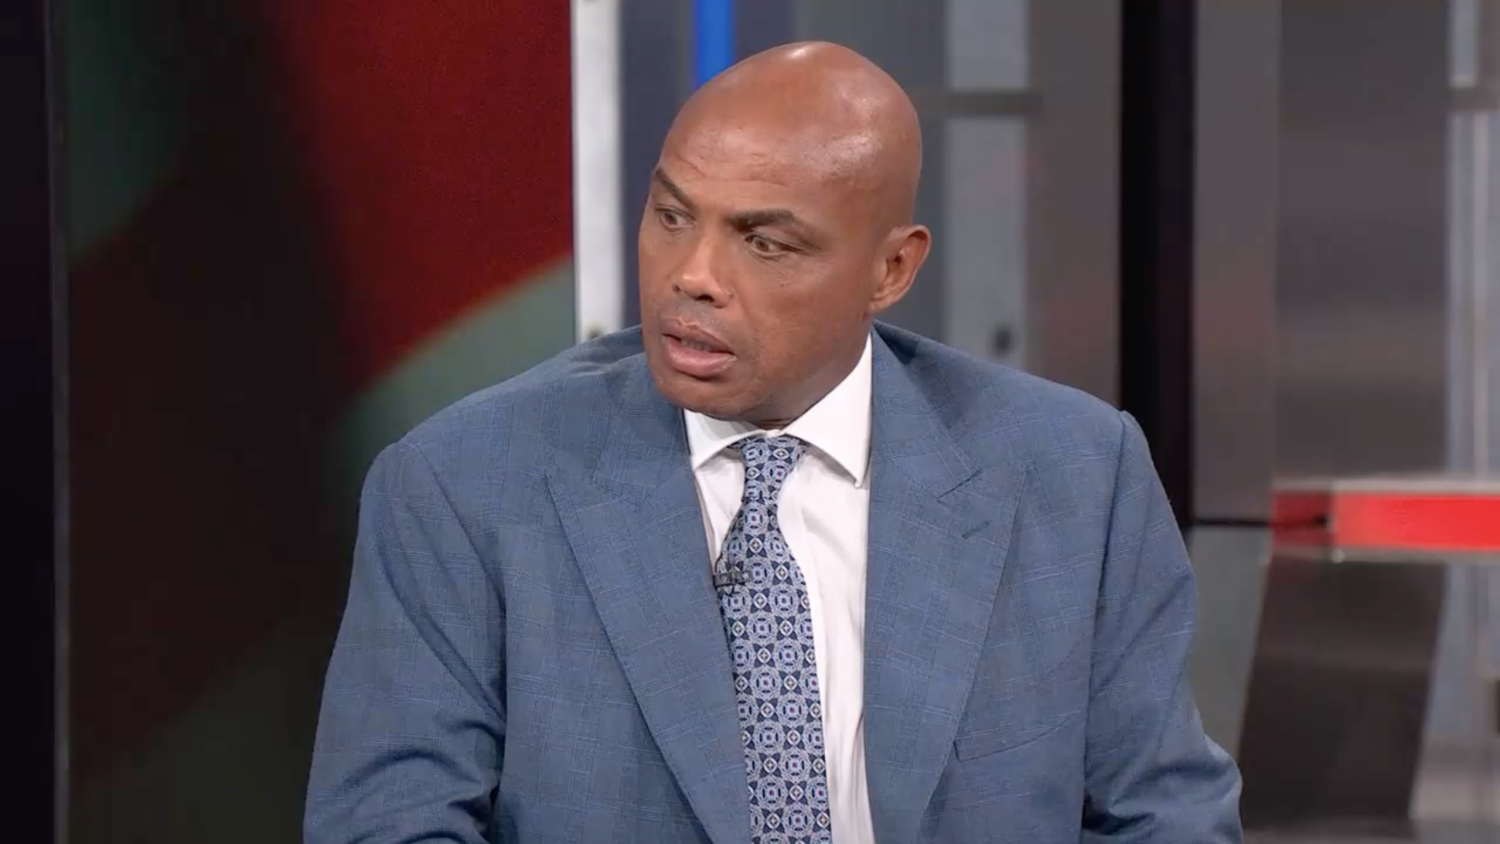
Charles Barkley Left Speechless as Kenny Smith's Ringing Phone D…

Zion Williamson Calls Pelicans' Historic Defensive Collapse 'Una…

Mike Brown Reveals Why Mikal Bridges Rode the Bench in Fourth Qu…

James Harden Acknowledges Slower Start in 18th NBA Season After …
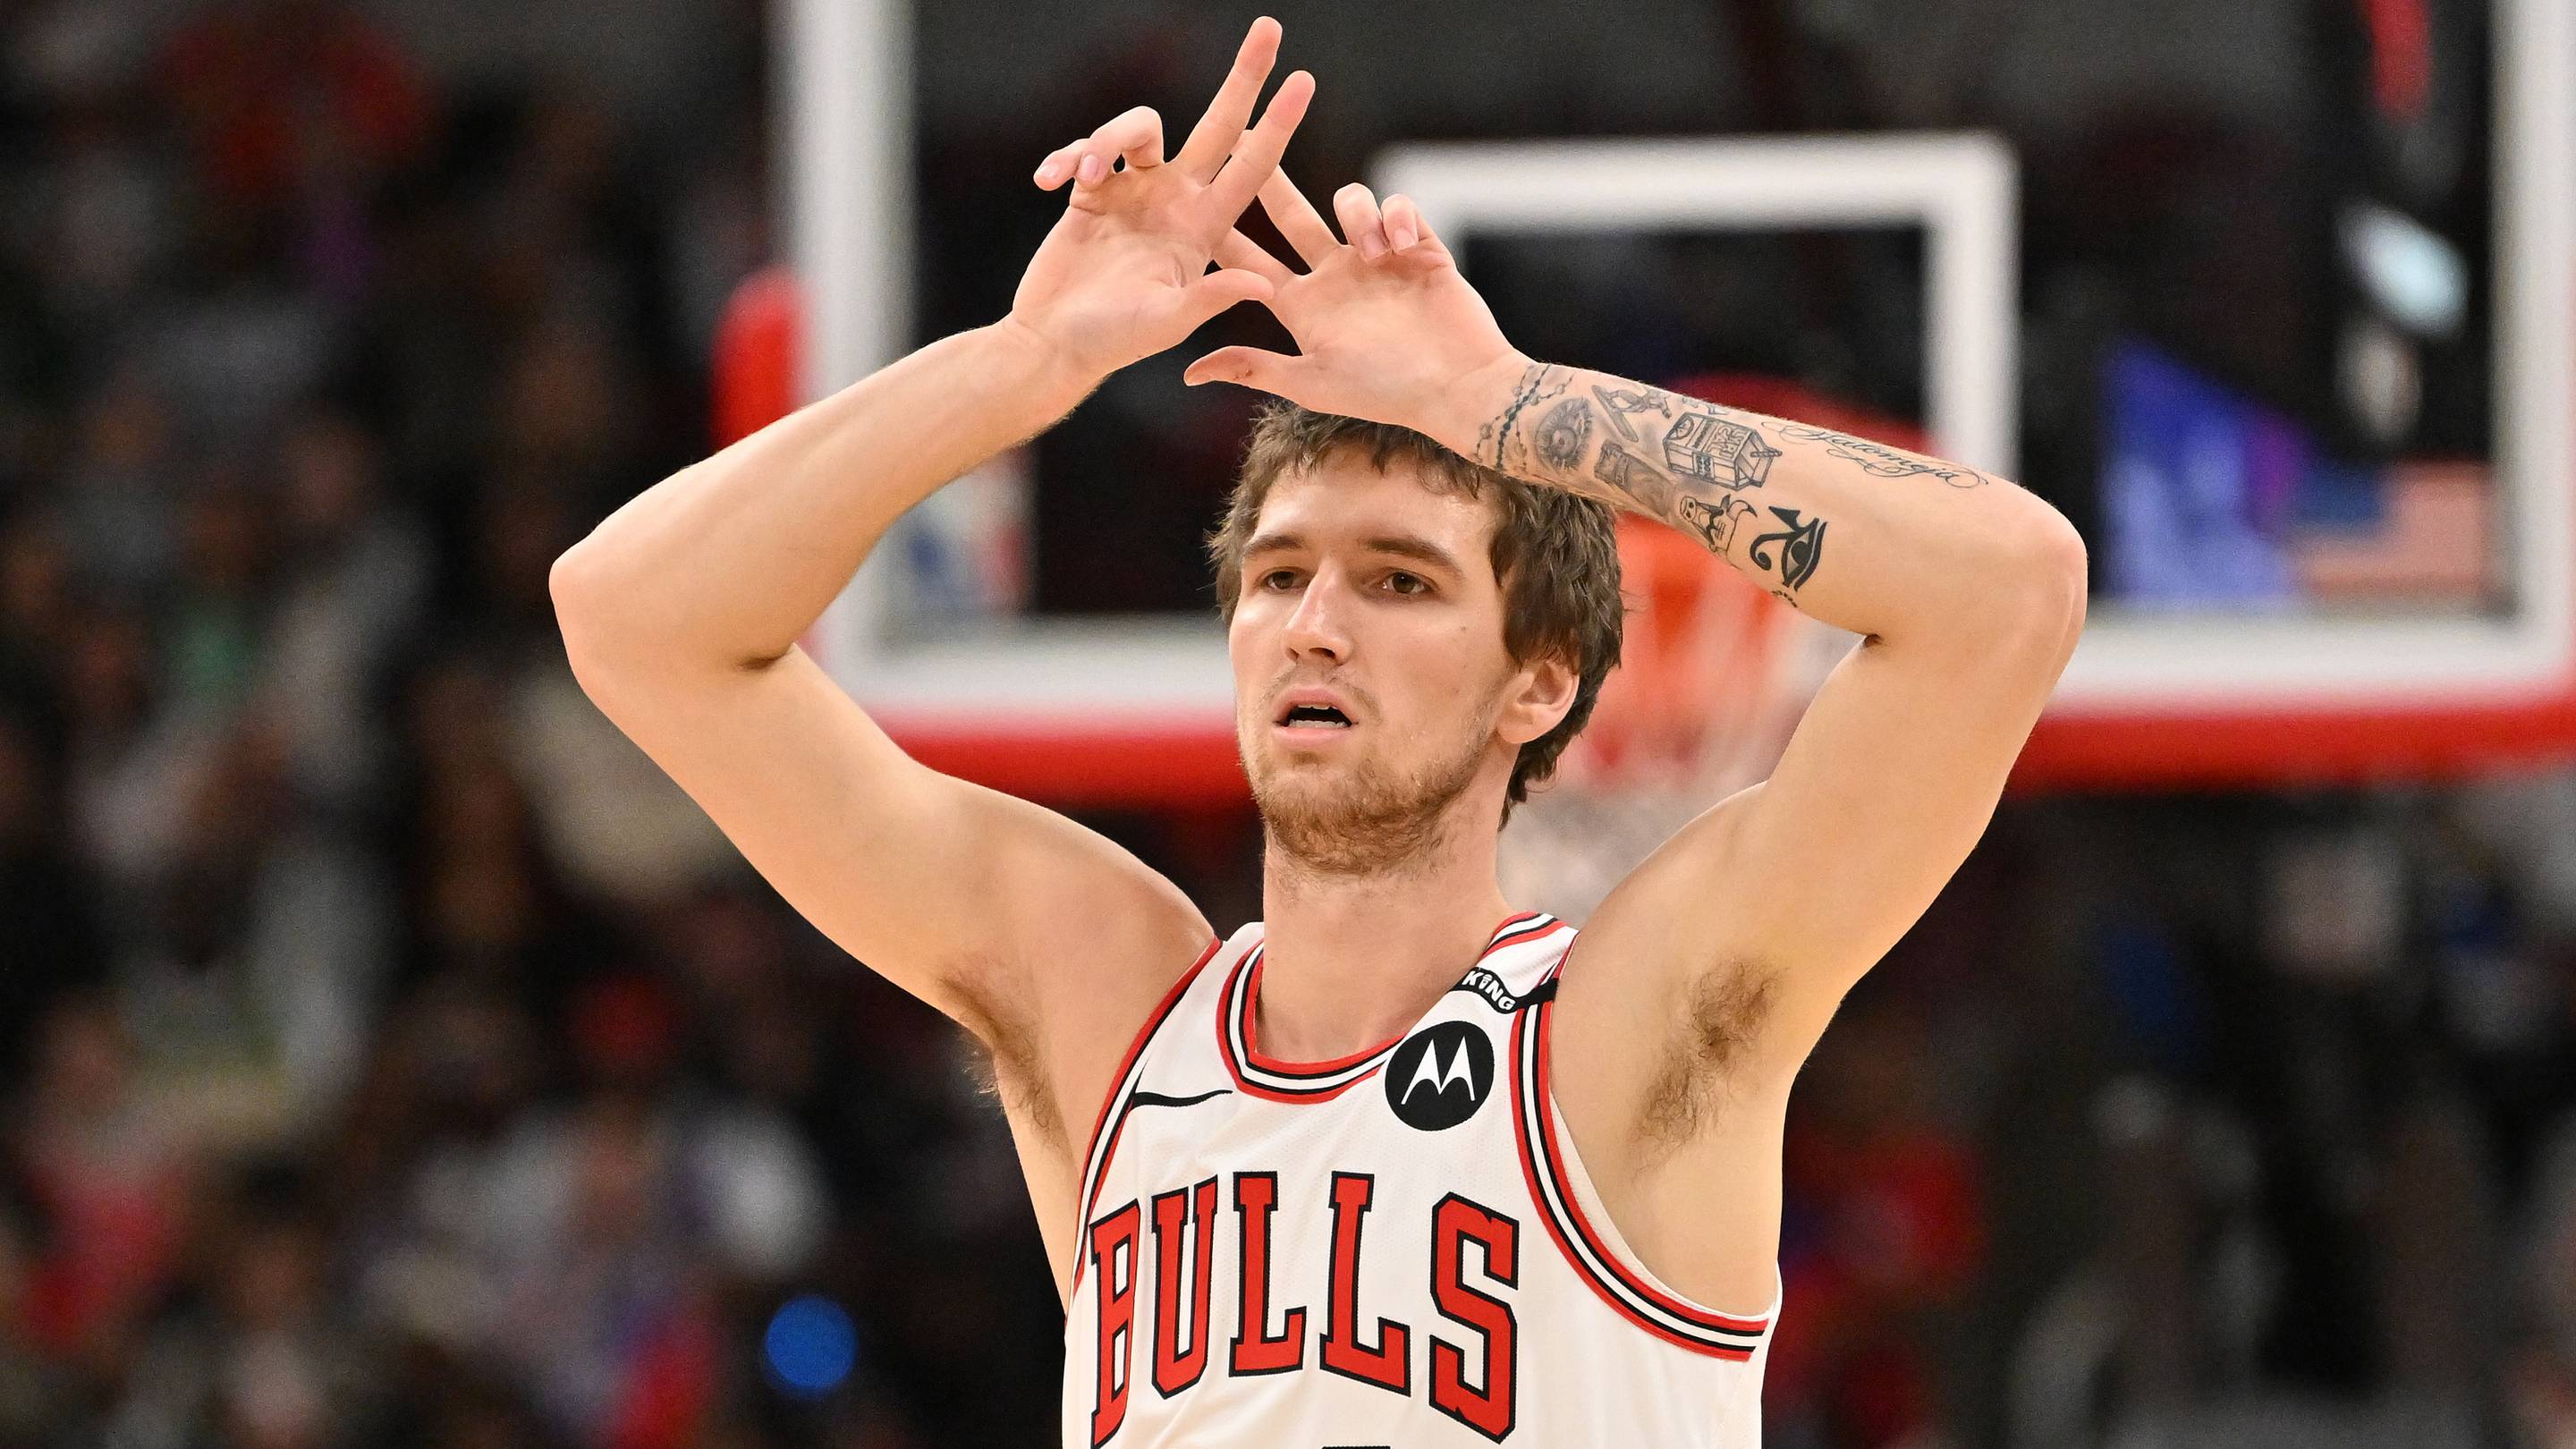
Bulls vs. Spurs: Wembanyama's Dominance Looms Over Chicago's Str…