



SAN JOSE
SHARKSSJ
6-5-1 | Road
4


BOSTON
BRUINSBOS
9-2-1 | Home
6
Goaltending

GOALTENDER
Alex Nedeljkovic
#33 | Goaltender@

GOALTENDER
Jeremy Swayman
#1 | Goaltender| Player | W-L-OTL | GAA | SV% | SO |
|---|---|---|---|---|
| Alex Nedeljkovic | None-None | 5.12 | 0.853 | -- |
| Jeremy Swayman | None-None | 4.00 | 0.852 | -- |
None-None
W-L-OTL
None-None
5.12
GAA
Ldr 4.00
0.853 Ldr
Save %
0.852
--
SO
--
AI Model Win Probability
SHARKS
27%
BRUINS
73%
▲ Edge: +8.60% (BOS)
SHARKS
38%
Book Odds: +166
BRUINS
65%
Book Odds: -185
AI Model Projected Total
AI Projection
6.0
Projected
Book Total
6.5
Over / Under Line
▼
Edge: +0.5 (Under)
Over 6.5
42%
Under 6.5
58%
AI Model Spread Expectation
AI Spread Proj
-1.6
BOSTON
Book Spread
-1.5
Book Line
▲ Edge: +0.1 points (Boston)
Spread Distribution
AI Model
+6+4+20-2-4-6
Distribution centered around BOS -1.6 expected margin.
Margin of Victory (BOS)
SJ By 1 goal
8.6%
SJ By 2-3 goals
5.5%
BOS By 1 goal
18.9%
BOS By 2-3 goals
34.9%
AI Model Projected Score
San Jose
2.2
SAN JOSE
Book Implied: 2.50
Boston
3.8
BOSTON
Book Implied: 4
Simulated Score
San Jose
2
SAN JOSE
Book Implied: 2.50
Boston
3
BOSTON
Book Implied: 4
Projections Grades
Moneyline (ML)
Agreement
👑 Top Selection
AI
Bruins
Win
73% Win Prob
A
Sim
Bruins
Win
69% Win Prob
A
Puck Line (ATS)
Divergence
AI
Bruins (-1.5)
Win
Proj Goals: -1.6
D
Sim
Sharks (+1.5)
Loss
Proj Goals: +1.0
B
Over/Under (Total)
Agreement
AI
u6.5
Loss
Proj Total: 6.0
C
Sim
u6.5
Loss
Proj Total: 5.0
A
Head-to-Head History
Date
Game
Score
Oct 24, 2026
SJ @ BOS
4 - 6
Oct 13, 2026
BOS @ SJ
6 - 3
Mar 12, 2026
SJ @ BOS
4 - 2
Nov 23, 2025
BOS @ SJ
1 - 3
Mar 22, 2025
BOS @ SJ
1 - 3
Key Model Drivers
Faceoff % (L5)
+6.0%
Boston: 53.9%
vs
San Jose: 47.9%
Hits (L5)
+22.4% more
San Jose: 23.3
vs
Boston: 18.1
Takeaways (L5)
+21.1% more
San Jose: 4.4
vs
Boston: 3.5
Power Play % (L5)
+17.1%
San Jose: 37.8%
vs
Boston: 20.7%
Post-Mortem Analysis
Metric
Projected
Actual
Score Game
SJ Score
2.2
4
BOS Score
3.8
6
Team Stats Splits (Home / Away)
Blocked Shots
16.6 / 15.9
10.0 / 9.0
Faceoff %
53.9 / 47.9
60.6 / 39.4
Hits
18.1 / 23.3
14.0 / 21.0
Power Play %
20.7 / 37.8
20.0 / 33.3
Shots on Goal
26.2 / 29.8
35.0 / 27.0
Takeaways
3.5 / 4.4
5.0 / 3.0
Public Market Splits
Moneyline
Open: +154 / -185
→
+166 / -185
Spread (ATS)
Open: +1.5 / -1.5
→
+1.5 / -1.5
Total (O/U)
Open: 6.5
→
6.5
Season to Date Model Accuracy
AI Model
SIM Engine
BOS
SJ
BOS
SJ
ML
78%
14-4
60%
12-8
44%
8-10
45%
9-11
ATS
61%
11-7
45%
9-11
56%
10-8
45%
9-11
TTL
50%
9-9
45%
9-11
50%
9-9
55%
11-9
Contextual Game News
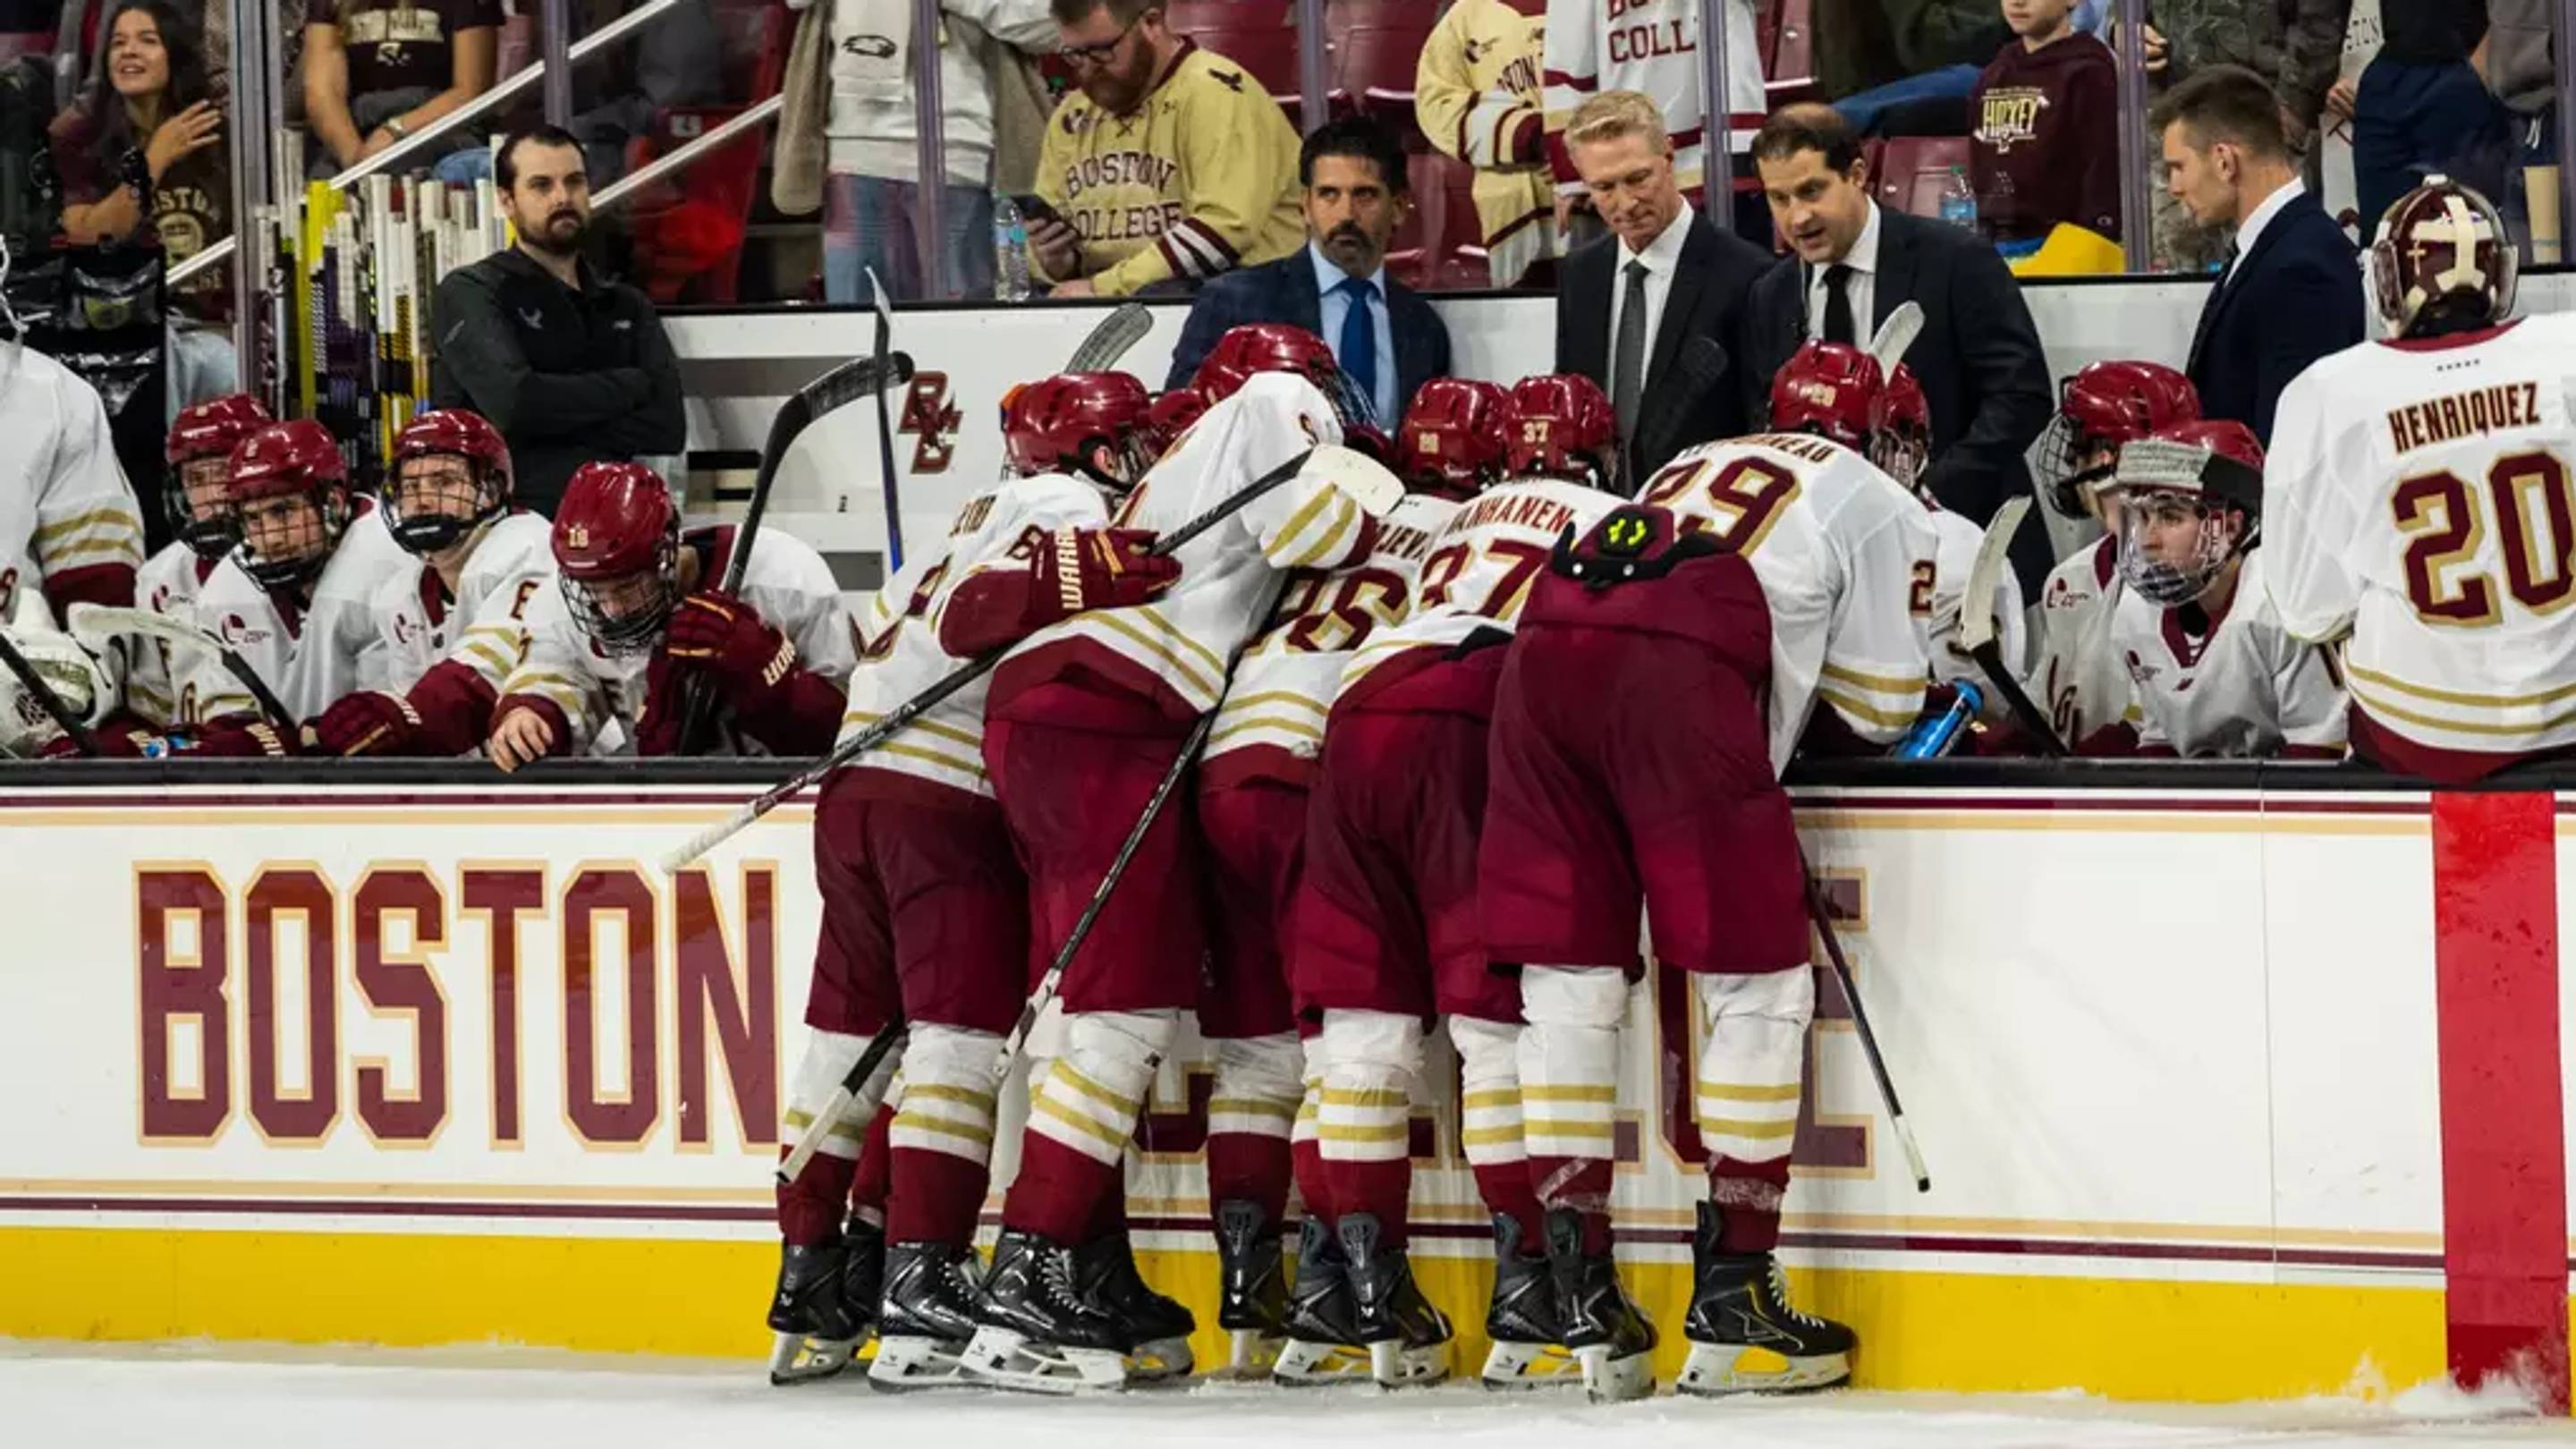
Greg Brown's Job Security Under Fire as Boston College Hockey St…

Kaprizov's Four-Point Night Powers Wild Past Sharks; Ducks, Sabr…
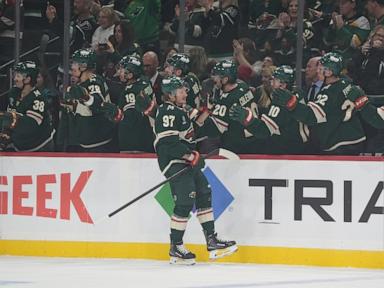
Kaprizov's Four-Point Night Powers Wild Past Sharks, 4-1
Penguins Look to Snap Skid Against Red-Hot Bruins

Randy Hahn: The Voice That Defines the San Jose Sharks for 35 Ye…