



DALLAS
MAVERICKSDAL
1-1 | Road
121


INDIANA
PACERSIND
1-1 | Home
105
Key Game
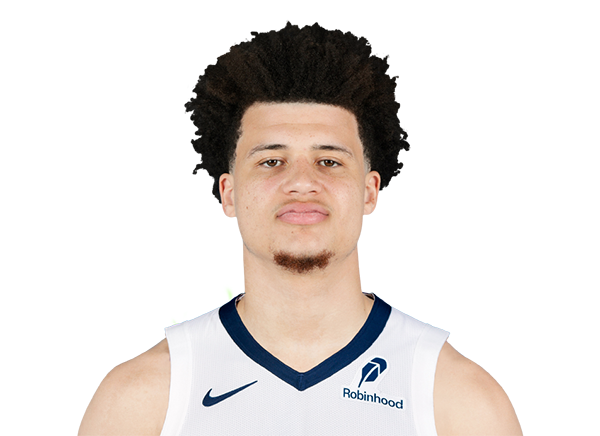
KEY GAME
Walter Clayton Jr.
#1 | Guard@

KEY GAME
Quenton Jackson
#29 | Guard| Player | |
|---|---|
| Walter Clayton Jr. | None-None |
| Quenton Jackson | None-None |
None-None
W-L
None-None
AI Model Win Probability
MAVERICKS
40%
PACERS
60%
▲ Edge: +7.70% (DAL)
MAVERICKS
32%
Book Odds: +210
PACERS
70%
Book Odds: -235
AI Model Projected Total
AI Projection
237.5
Projected
Book Total
241.5
Over / Under Line
▼
Edge: +4.0 (Under)
Over 241.5
45%
Under 241.5
55%
AI Model Spread Expectation
AI Spread Proj
+2.5
DALLAS
Book Spread
+7.5
Book Line
▲ Edge: +5.0 points (Dallas)
Spread Distribution
AI Model
+30+20+100-10-20-30
Distribution centered around DAL +2.5 expected margin.
Margin of Victory (DAL)
DAL By 1-7 points
22.3%
DAL By 8-14 points
11.4%
IND By 1-7 points
27.1%
IND By 8-14 points
19.3%
AI Model Projected Score
Dallas
117.5
DALLAS
Book Implied: 117
Indiana
120
INDIANA
Book Implied: 124.50
Simulated Score
Dallas
105
DALLAS
Book Implied: 117
Indiana
115
INDIANA
Book Implied: 124.50
Projections Grades
Moneyline (ML)
Agreement
AI
Pacers
Loss
60% Win Prob
C
Sim
Pacers
Loss
76% Win Prob
A
Point Spread (ATS)
Divergence
AI
Mavericks (+7.5)
Win
Proj Spread: +2.5
B
Sim
Pacers (-7.5)
Loss
Proj Spread: -10.0
C
Over/Under (Total)
Agreement
AI
u241.5
Win
Proj Total: 237.5
C
Sim
u241.5
Win
Proj Total: 220.0
A
Head-to-Head History
Date
Game
Score
Nov 9, 2026
IND @ DAL
122 - 125
Oct 23, 2026
DAL @ IND
121 - 105
Feb 22, 2026
DAL @ IND
134 - 130
Oct 29, 2025
IND @ DAL
105 - 107
Mar 19, 2025
DAL @ IND
131 - 135
Key Model Drivers
Turnovers (L5)
+36.8% more
Indiana: 16.1
vs
Dallas: 11.8
Assists (L5)
+19.8% more
Indiana: 30.5
vs
Dallas: 25.4
Post-Mortem Analysis
Metric
Projected
Actual
Score Game
DAL Score
117.5
121
IND Score
120.0
105
Team Stats Splits (Home / Away)
3pt Field Goal %
34.1 / 35.0
22.0 / 41.0
Assists
30.5 / 25.4
27.0 / 28.0
Blocks
4.7 / 4.9
6.0 / 11.0
Field Goal %
47.7 / 48.2
44.0 / 50.0
Free Throw %
77.0 / 77.7
71.0 / 83.0
Rebounding
43.2 / 42.2
42.0 / 46.0
Steals
9.3 / 9.5
6.0 / 10.0
Turnovers
14.9 / 15.3
21.0 / 15.0
Public Market Splits
Moneyline
Open: +170 / -205
→
+210 / -235
↑
Spread (ATS)
Open: +5.5 / -5.5
→
+7.5 / -7.5
↑
Total (O/U)
Open: 234.5
→
241.5
↑
Situational Trends
📊 Win-Loss
DAL
Advantage
7-4-0
(63.6%)
Margin: 4.6
ATS +/-: +8.0
IND
3-8-0
(27.3%)
Margin: -3.8
ATS +/-: -1.7
🎯 ATS (Spread)
DAL
Advantage
7-4-0
(63.6%)
Margin: 4.6
ATS +/-: +8.0
IND
6-5-0
(54.6%)
Margin: -3.8
ATS +/-: -1.7
⚖️ Over/Under
DAL
3-8-0
O: 27.3% / U: 72.7%
Total +/-: -4.9
IND
4-7-0
O: 36.4% / U: 63.6%
Total +/-: -6.6
Season to Date Model Accuracy
AI Model
SIM Engine
IND
DAL
IND
DAL
ML
73%
8-3
55%
6-5
55%
6-5
55%
6-5
ATS
55%
6-5
45%
5-6
55%
6-5
55%
6-5
TTL
36%
4-7
73%
8-3
64%
7-4
64%
7-4
Contextual Game News

Gary Trent Jr. Probe Could Spell Severe Penalties for Bucks, Ins…
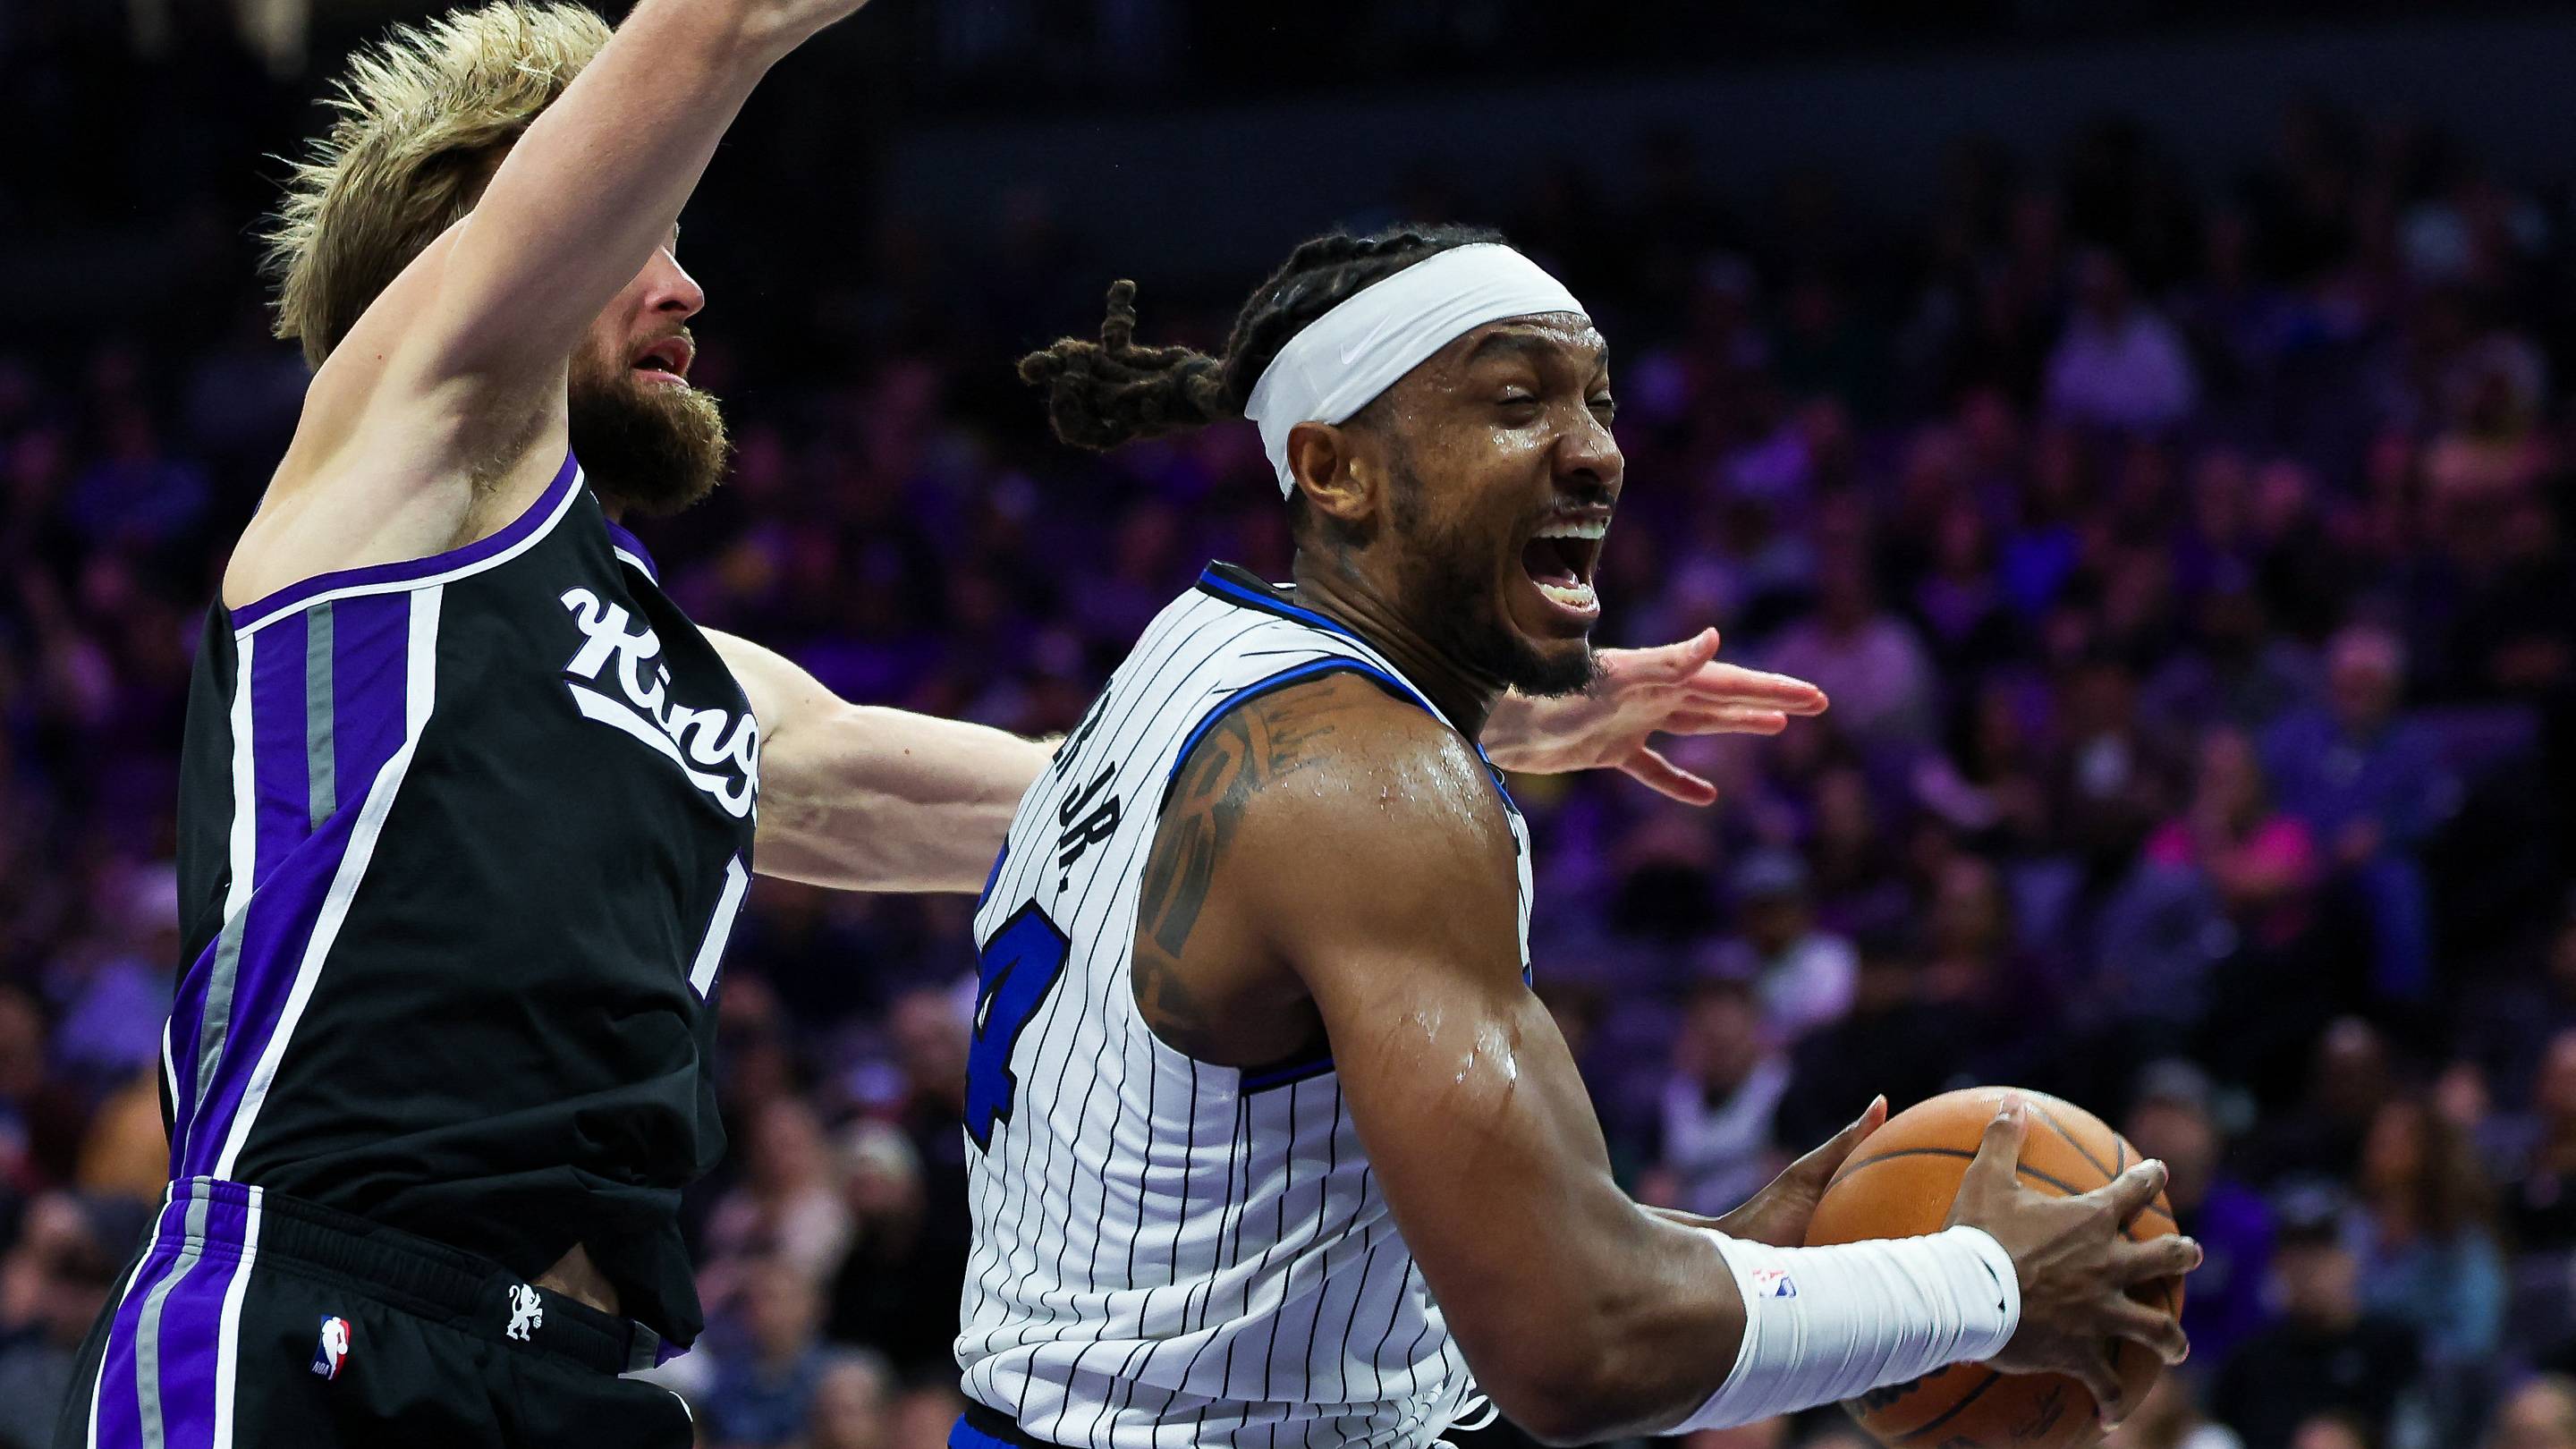
Franz Wagner's 31 Points Propel Short-Handed Magic Past Kings, 1…

NBA's Last Two-Minute Report Backs Officials on Contested Collis…

Sixers Shock NBA with 9-2 Start: Inside the Chemistry Behind Phi…

Phillies' Payroll Problems: The Three Most Burdensome Contracts …