



INDIANA
PACERSIND
1-0 | Road
123


NEW ORLEANS
PELICANSNO
0-1 | Home
120
Key Game
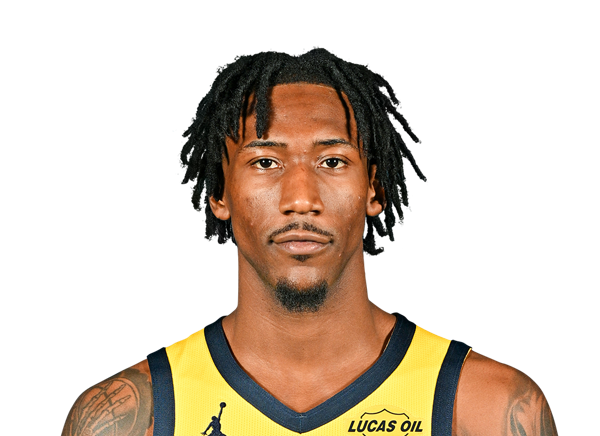
KEY GAME
Quenton Jackson
#29 | Guard@
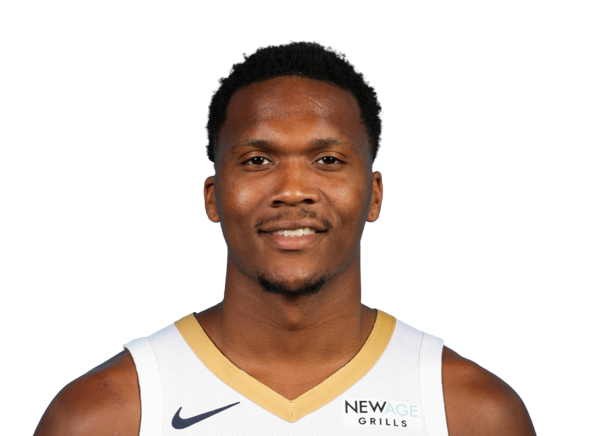
KEY GAME
Bennedict Mathurin
#24 | Guard| Player | |
|---|---|
| Quenton Jackson | None-None |
| Bennedict Mathurin | None-None |
None-None
W-L
None-None
AI Model Win Probability
PACERS
52%
PELICANS
48%
▲ Edge: +3.80% (NO)
PACERS
57%
Book Odds: -135
PELICANS
44%
Book Odds: +125
AI Model Projected Total
AI Projection
237.5
Projected
Book Total
238.5
Over / Under Line
▼
Edge: +1.0 (Under)
Over 238.5
48%
Under 238.5
52%
AI Model Spread Expectation
AI Spread Proj
+0.5
NEW ORLEANS
Book Spread
+2.5
Book Line
▲ Edge: +2.0 points (New Orleans)
Spread Distribution
AI Model
-30-20-100+10+20+30
Distribution centered around NO +0.5 expected margin.
Margin of Victory (NO)
IND By 1-7 points
25.8%
IND By 8-14 points
16.1%
NO By 1-7 points
24.8%
NO By 8-14 points
14.5%
AI Model Projected Score
Indiana
119
INDIANA
Book Implied: 120.50
New Orleans
118.5
NEW ORLEANS
Book Implied: 118
Simulated Score
Indiana
123
INDIANA
Book Implied: 120.50
New Orleans
119
NEW ORLEANS
Book Implied: 118
Projections Grades
Moneyline (ML)
Agreement
AI
Pacers
Win
52% Win Prob
D
Sim
Pacers
Win
61% Win Prob
C
Point Spread (ATS)
Divergence
AI
Pelicans (+2.5)
Loss
Proj Spread: +0.5
C
Sim
Pacers (-2.5)
Win
Proj Spread: -4.0
D
Over/Under (Total)
Divergence
AI
u238.5
Loss
Proj Total: 237.5
D
Sim
o238.5
Win
Proj Total: 242.0
C
Head-to-Head History
Date
Game
Score
Oct 21, 2026
IND @ NO
123 - 120
Jan 16, 2026
NO @ IND
119 - 127
Dec 20, 2025
IND @ NO
109 - 128
Dec 15, 2024
NO @ IND
104 - 119
Nov 25, 2024
NO @ IND
110 - 114
Key Model Drivers
Assists (L5)
+26.9% more
Indiana: 31.2
vs
New Orleans: 22.8
Turnovers (L5)
+22.9% more
Indiana: 16.1
vs
New Orleans: 12.5
Turnovers (L5)
+20.0% more
Indiana: 15.8
vs
New Orleans: 12.7
3pt Field Goal % (L5)
+5.4%
Indiana: 36.1%
vs
New Orleans: 30.7%
Post-Mortem Analysis
Metric
Projected
Actual
Score Game
IND Score
119.0
123
NO Score
118.5
120
Team Stats Splits (Home / Away)
3pt Field Goal %
30.7 / 36.1
33.0 / 30.0
Assists
22.8 / 31.2
23.0 / 29.0
Blocks
5.3 / 5.1
6.0 / 4.0
Field Goal %
46.0 / 45.6
43.0 / 52.0
Free Throw %
79.3 / 81.0
92.0 / 69.0
Rebounding
46.7 / 43.3
49.0 / 43.0
Steals
9.1 / 9.4
11.0 / 9.0
Turnovers
12.7 / 15.8
15.0 / 13.0
Public Market Splits
Moneyline
Open: -155 / +130
→
-135 / +125
↑
Spread (ATS)
Open: -4.5 / +4.5
→
-2.5 / +2.5
↑
Total (O/U)
Open: 243.5
→
238.5
↓
Situational Trends
📊 Win-Loss
IND
2-6-0
(25.0%)
Margin: -3.9
ATS +/-: -3.3
NO
Advantage
3-4-0
(42.9%)
Margin: 1.7
ATS +/-: +5.1
🎯 ATS (Spread)
IND
4-4-0
(50.0%)
Margin: -3.9
ATS +/-: -3.3
NO
Advantage
5-2-0
(71.4%)
Margin: 1.7
ATS +/-: +5.1
⚖️ Over/Under
IND
3-5-0
O: 37.5% / U: 62.5%
Total +/-: -7.6
NO
4-3-0
O: 57.1% / U: 42.9%
Total +/-: +4.4
Season to Date Model Accuracy
AI Model
SIM Engine
NO
IND
NO
IND
ML
57%
4-3
75%
6-2
71%
5-2
50%
4-4
ATS
29%
2-5
62%
5-3
71%
5-2
62%
5-3
TTL
57%
4-3
38%
3-5
43%
3-4
75%
6-2
Contextual Game News

NBA Insider Kevin O'Connor Leaves Lakers Out of Top 8 Title Cont…
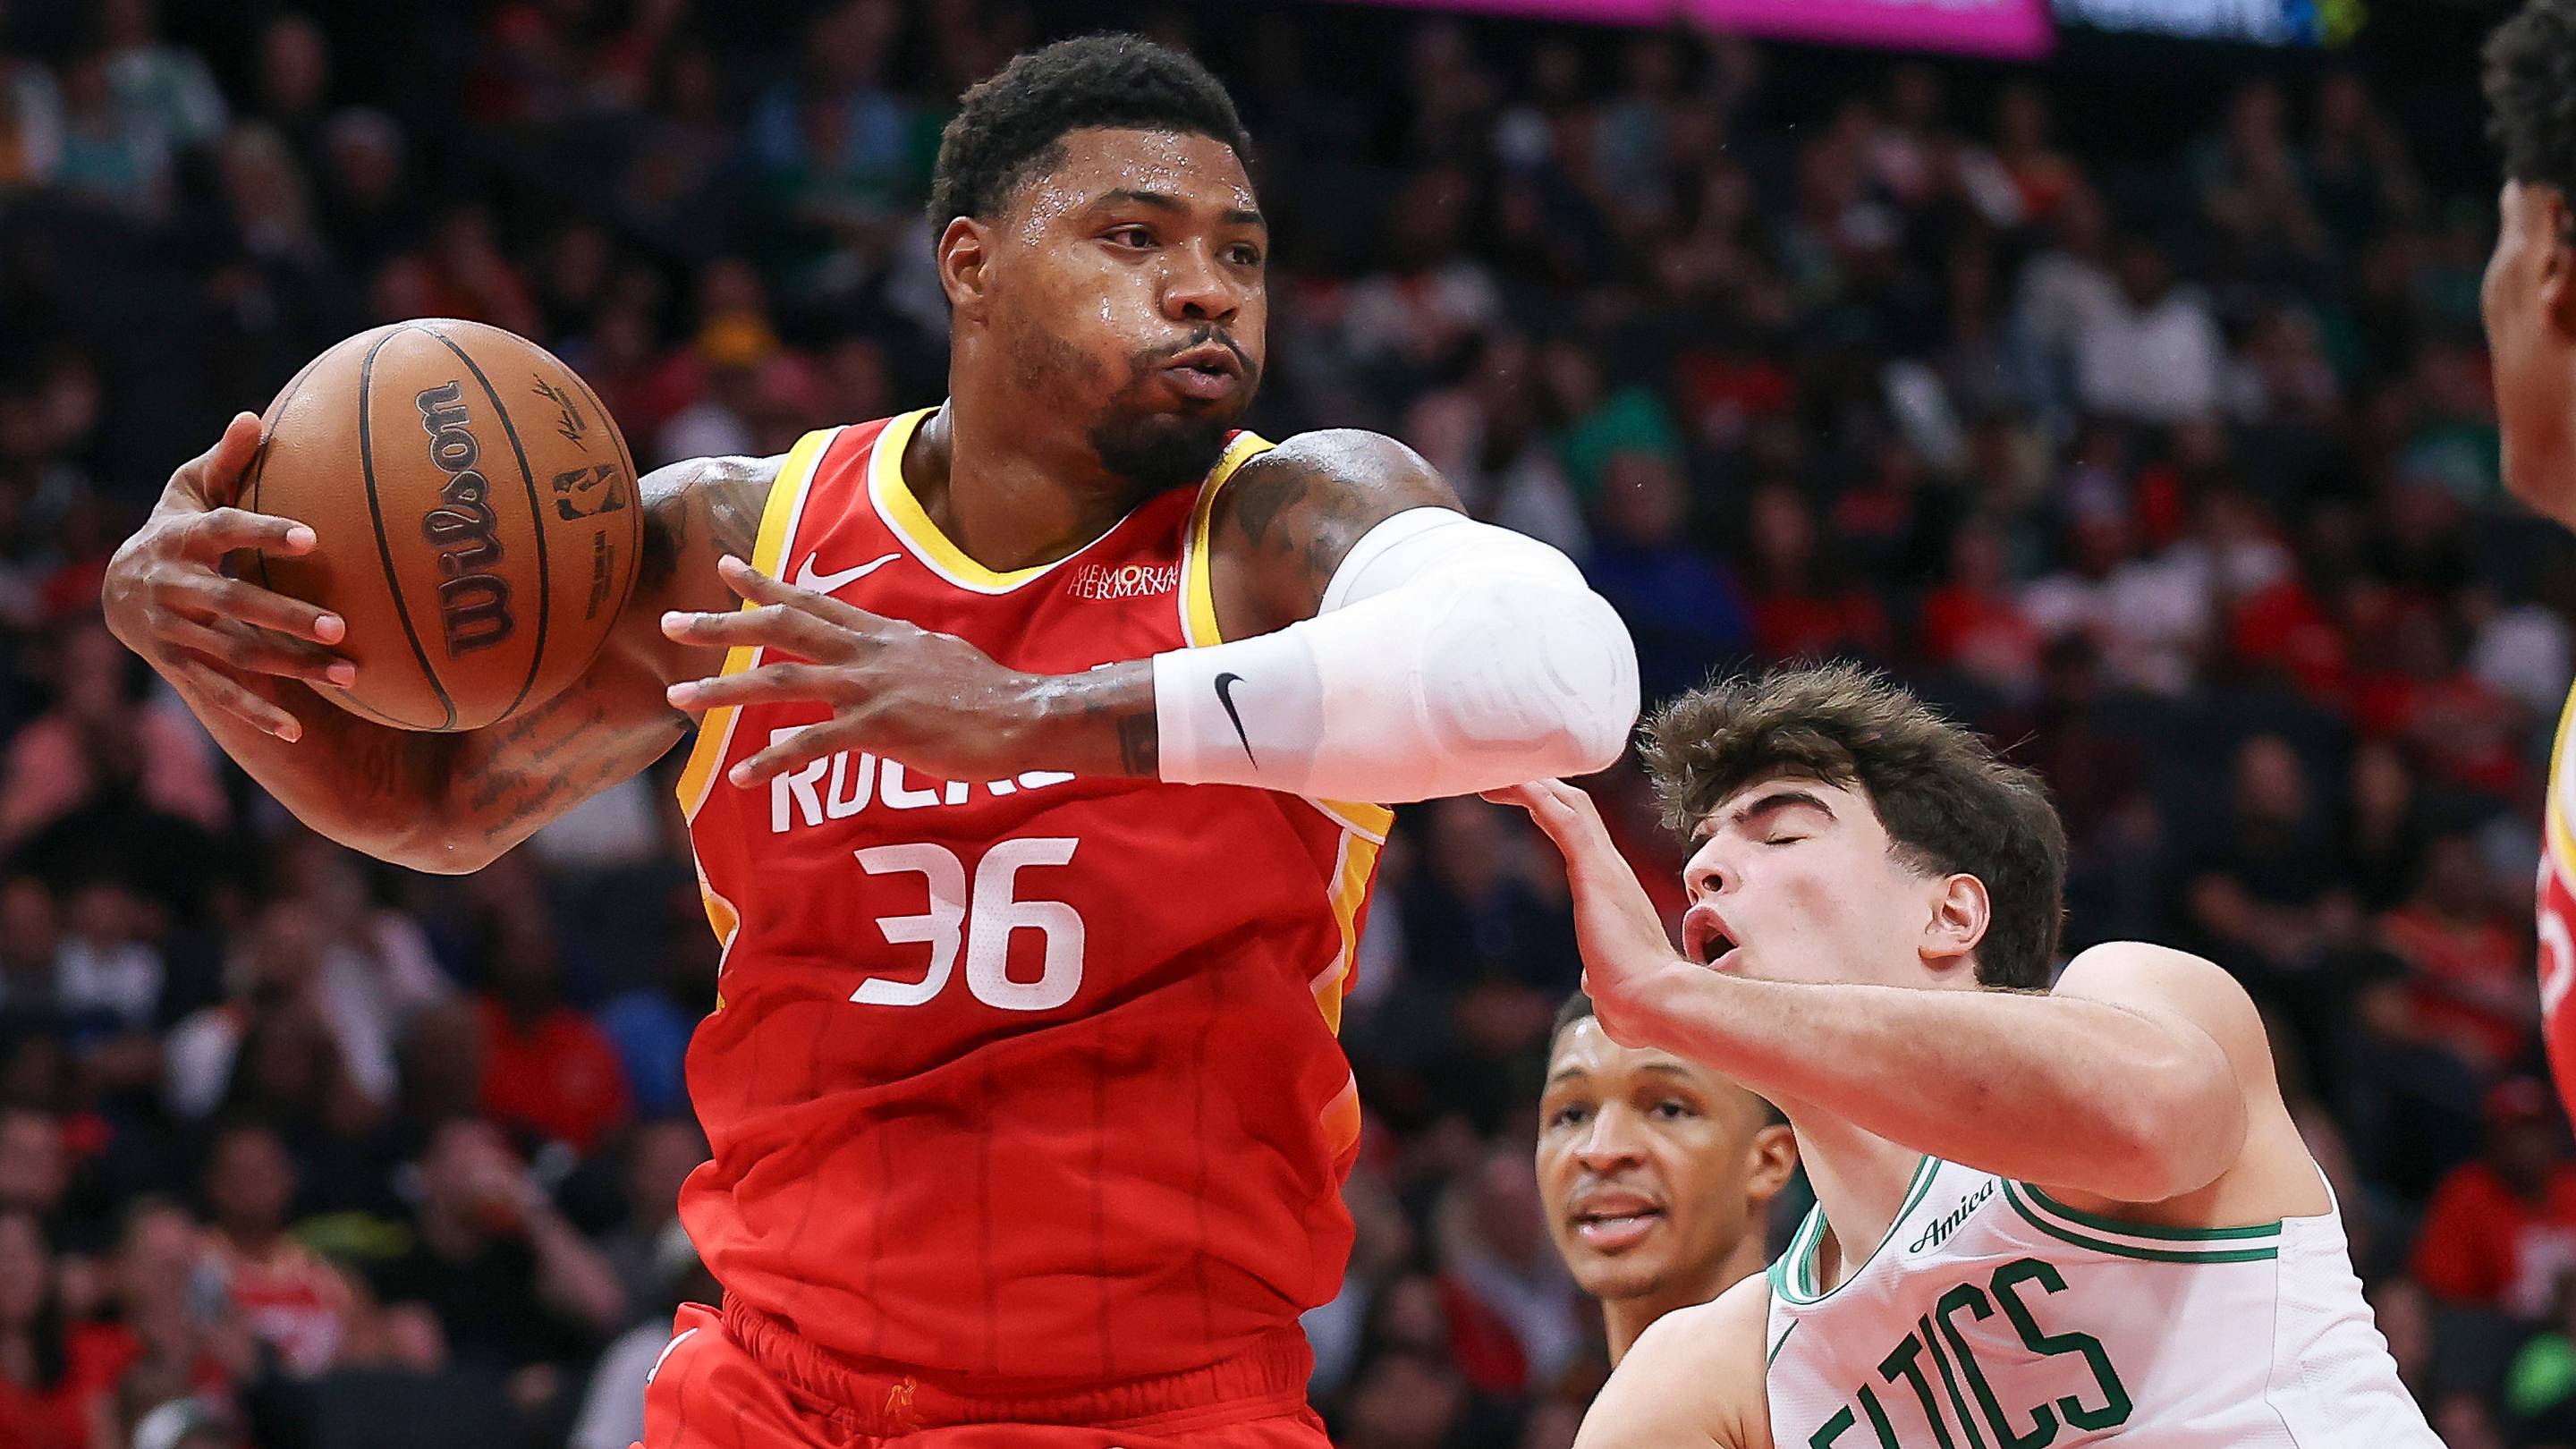
Celtics' 109-93 Loss to Rockets: Unseen Factors Behind Boston's …
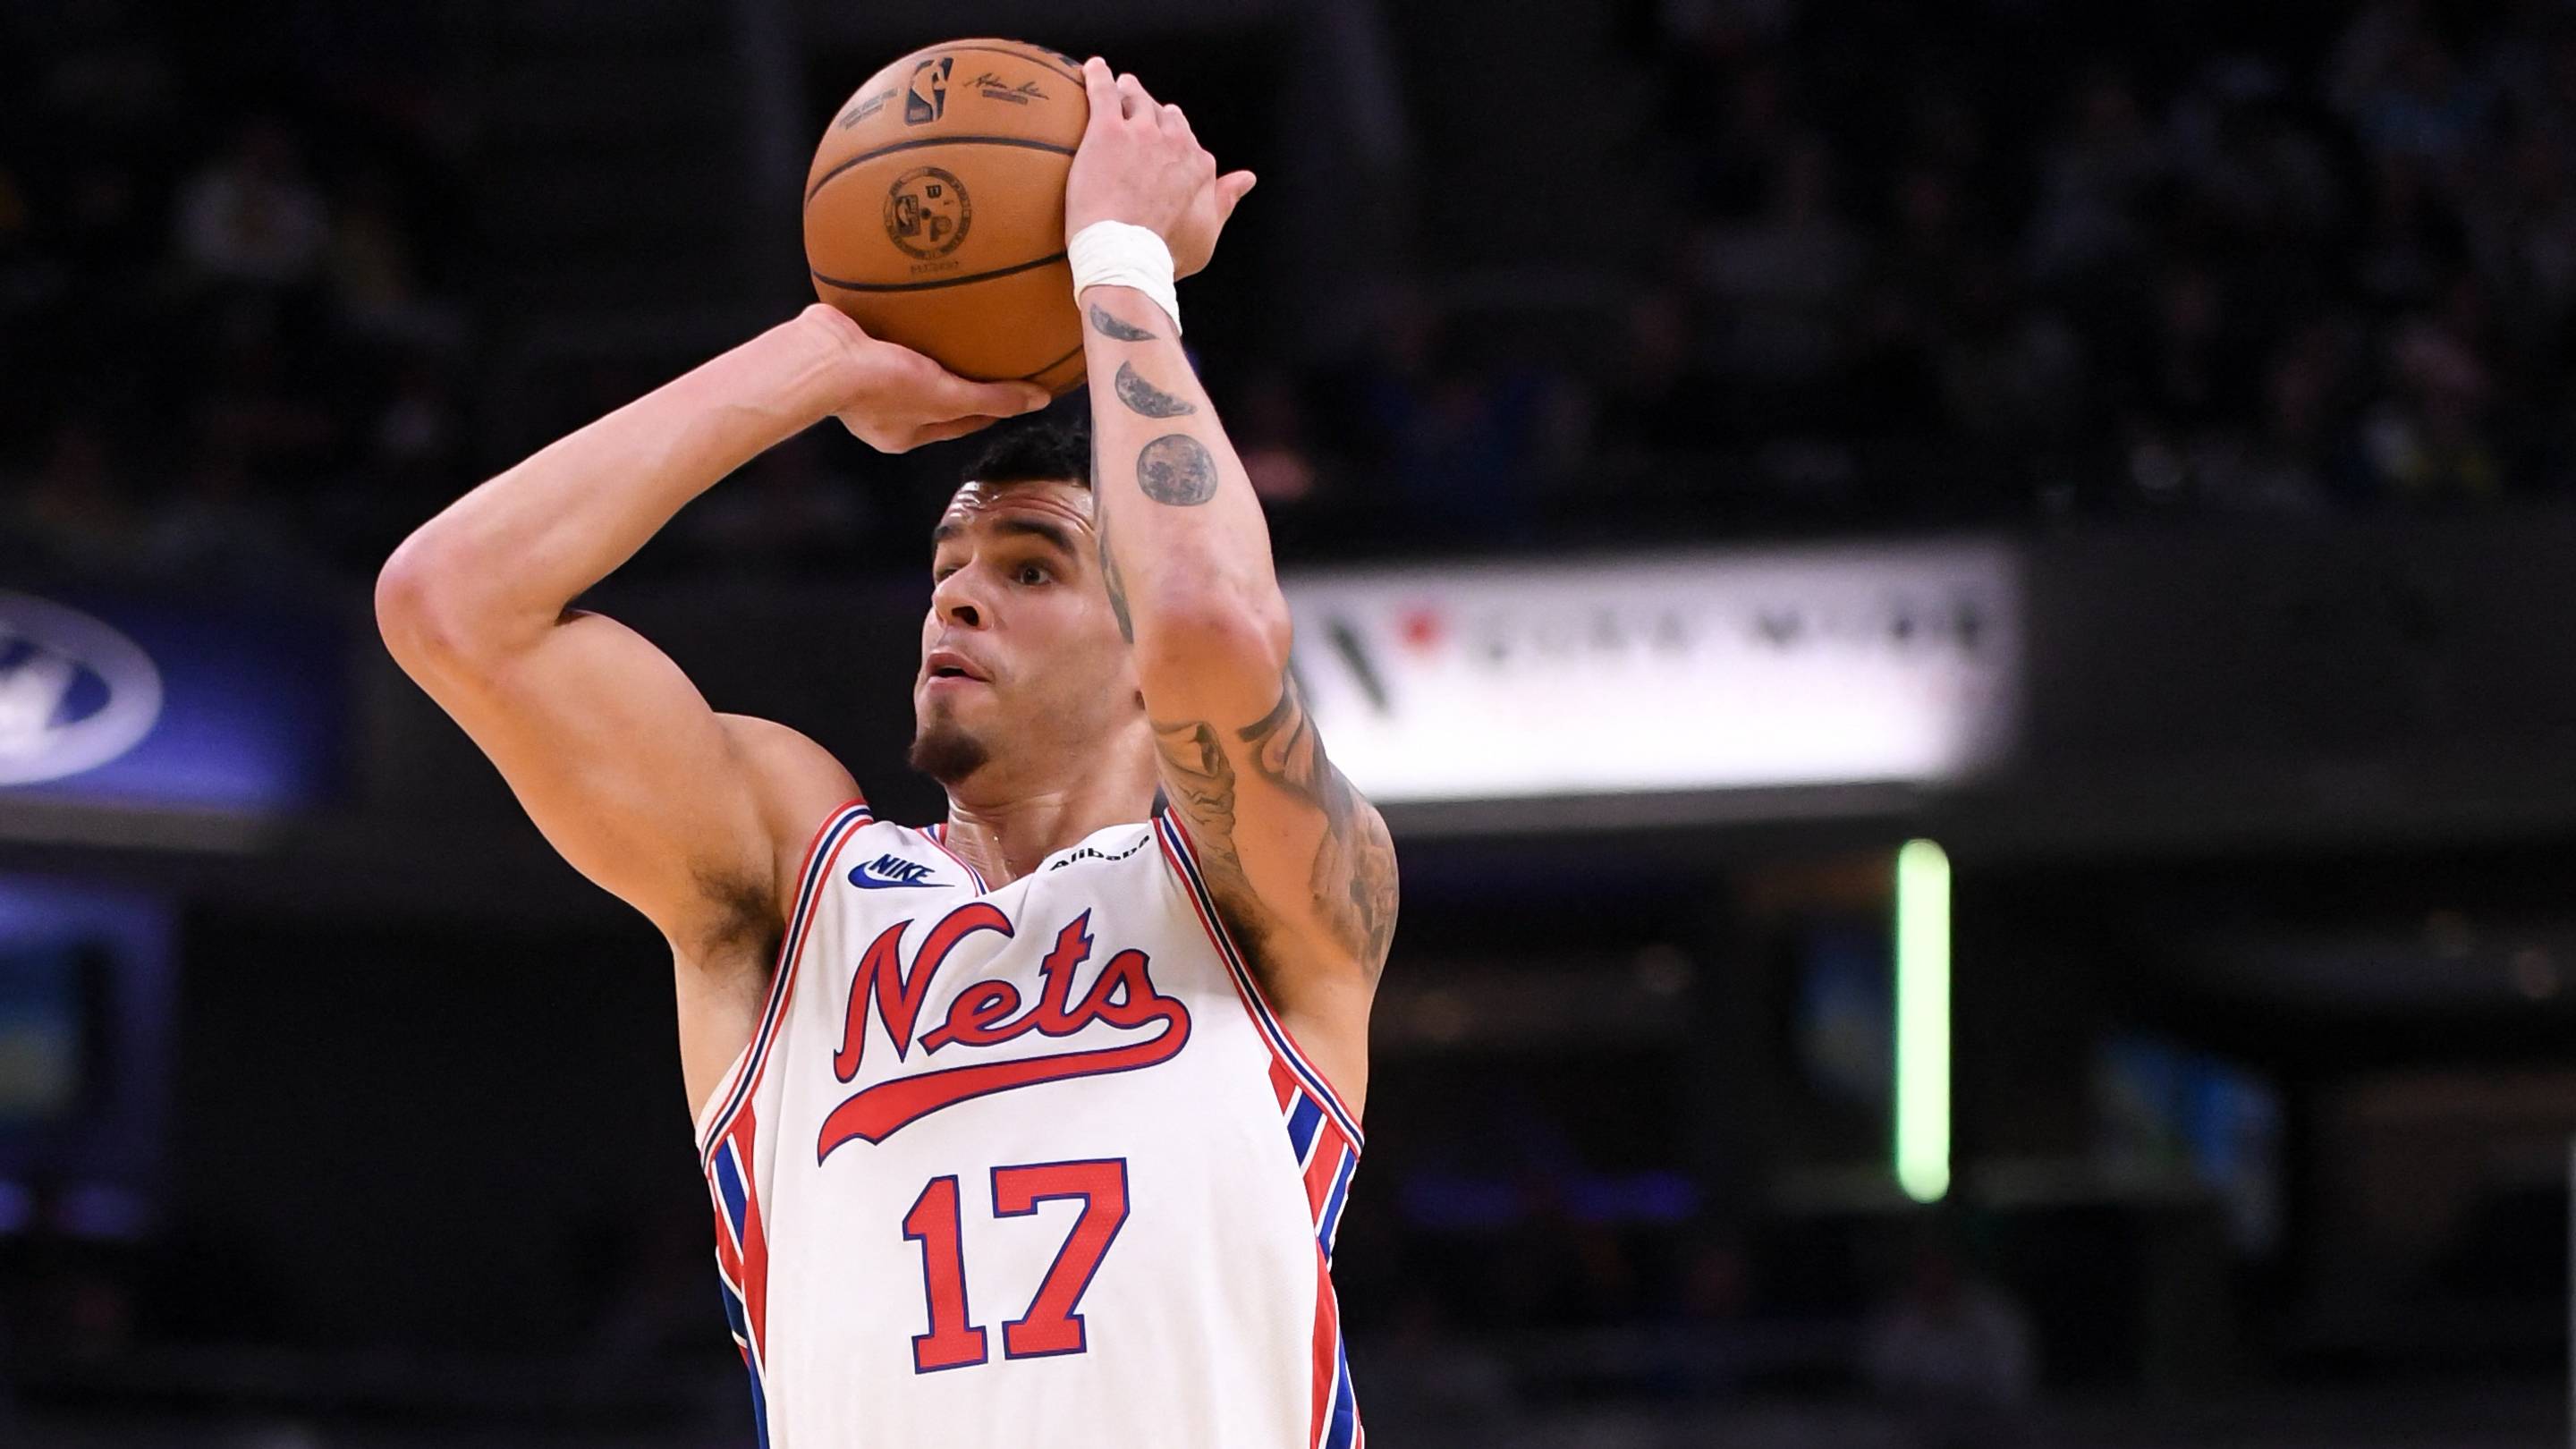
Nets Show Fight Early, Look to Build on First Win and Climb East

Braden Smith Thrust into Starting Role as Depleted Pacers Face H…
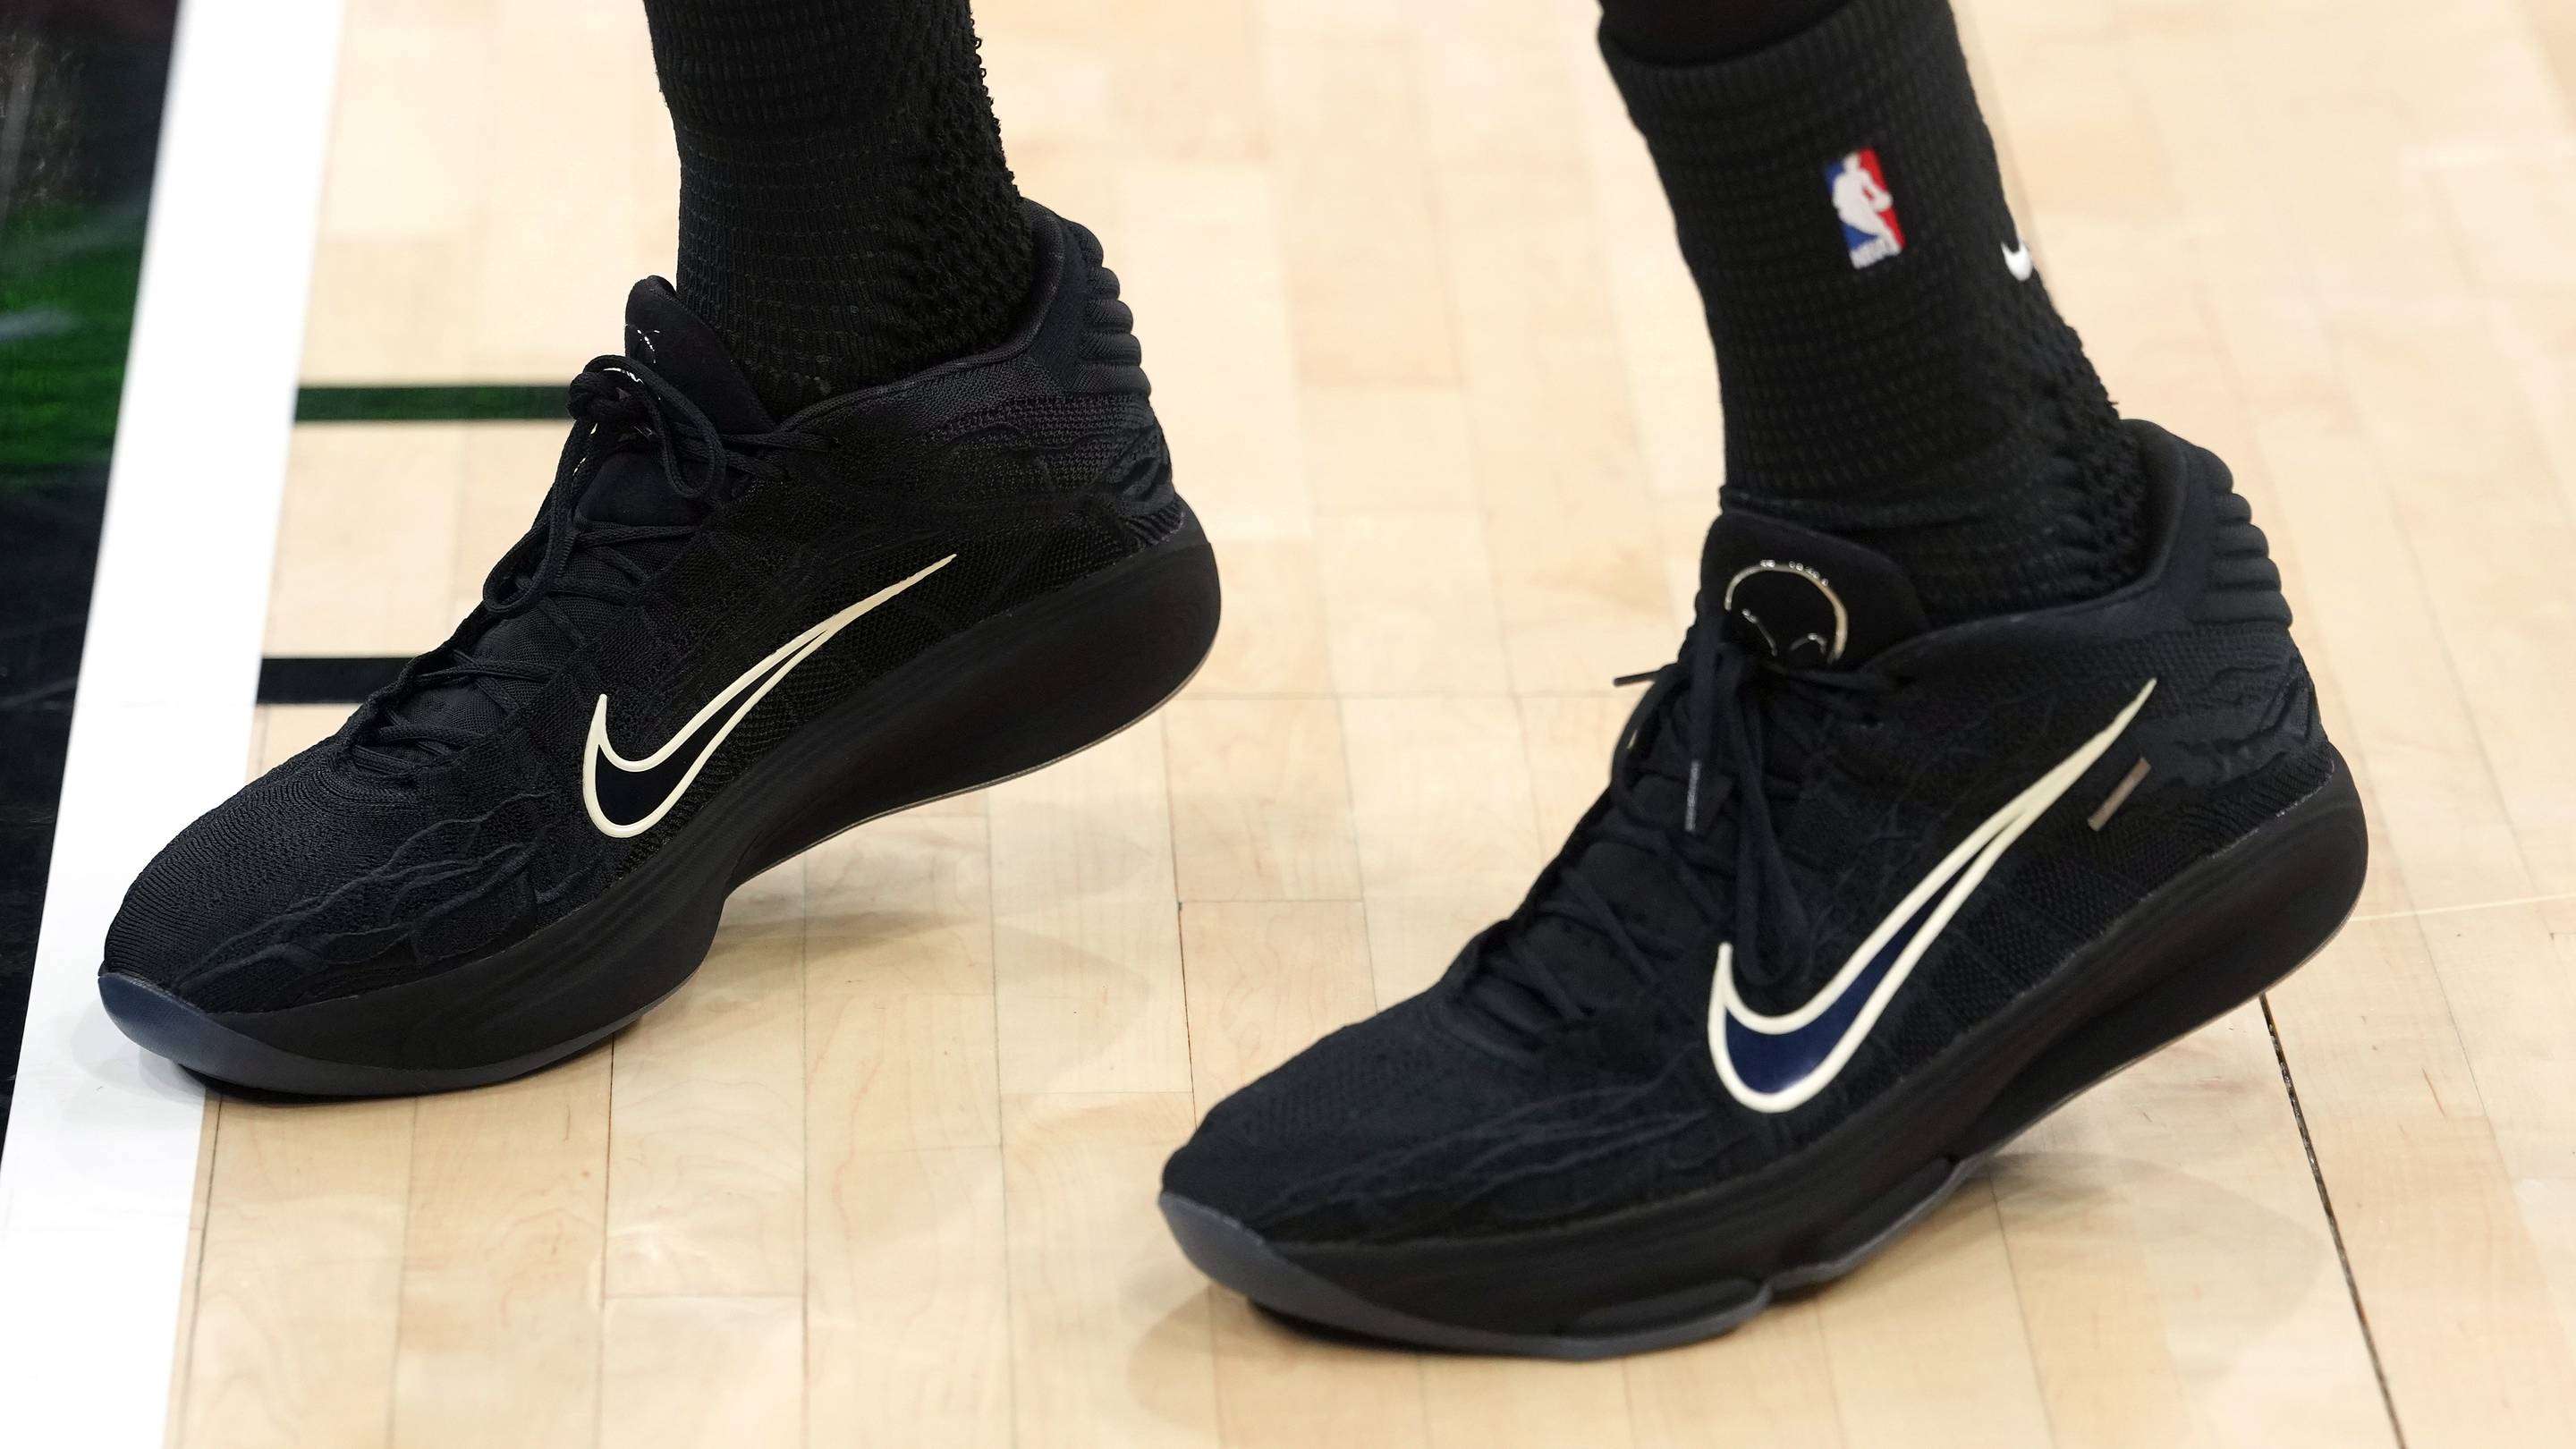
Victor Wembanyama Calls Out Modern Shoes for Disrespecting Natur…