



CLEVELAND
GUARDIANSCLE
85-77 | Road
3


TAMPA BAY
RAYSTB
98-64 | Home
7
Probable Pitchers

STARTING PITCHER
Shawn Armstrong
#43 | Relief Pitcher@

STARTING PITCHER
Freddy Peralta
#51 | Starting Pitcher| Player | W-L | ERA | WHIP | IP | K |
|---|---|---|---|---|---|
| Shawn Armstrong | 0-0 | 0.00 | 0.26 | 7.2 | 6 |
| Freddy Peralta | 1-0 | 0.79 | 0.97 | 11.1 | 9 |
0-0
W-L
1-0
0.00 Ldr
ERA
0.79
0.26 Ldr
WHIP
0.97
7.2
IP (Innings Pitched)
Ldr 11.1
6
K (Strikeouts)
Ldr 9
AI Model Win Probability
GUARDIANS
34%
RAYS
66%
▲ Edge: +6.40% (TB)
GUARDIANS
42%
Book Odds: +136
RAYS
60%
Book Odds: -148
AI Model Projected Total
AI Projection
8.4
Projected
Book Total
7.0
Over / Under Line
▲
Edge: +1.4 (Over)
Over 7.0
65%
Under 7.0
35%
AI Model Spread Expectation
AI Spread Proj
-2.0
TAMPA BAY
Book Spread
-1.5
Book Line
▲ Edge: +0.5 points (Tampa Bay)
Spread Distribution
AI Model
+12+8+40-4-8-12
Distribution centered around TB -2.0 expected margin.
Margin of Victory (TB)
CLE By 1-2 runs
13.6%
CLE By 3-4 runs
7.8%
TB By 1-2 runs
19.6%
TB By 3-4 runs
18.4%
AI Model Projected Score
Cleveland
3.2
CLEVELAND
Book Implied: 2.80
Tampa Bay
5.2
TAMPA BAY
Book Implied: 4.20
Simulated Score
Cleveland
3
CLEVELAND
Book Implied: 2.80
Tampa Bay
4
TAMPA BAY
Book Implied: 4.20
Projections Grades
Moneyline (ML)
Agreement
AI
Rays
Win
66% Win Prob
B
Sim
Rays
Win
59% Win Prob
C
Run Line (ATS)
Divergence
AI
Rays (-1.5)
Win
Proj Runs: -2.0
D
Sim
Guardians (+1.5)
Loss
Proj Runs: +1.0
C
Over/Under (Total)
Divergence
AI
o7.0
Win
Proj Total: 8.4
A
Sim
u7.0
Loss
Proj Total: 7.0
D
Head-to-Head History
Date
Game
Score
Oct 19, 2026
CLE @ TB
3 - 7
Oct 18, 2026
TB @ CLE
3 - 1
Oct 17, 2026
TB @ CLE
7 - 3
Oct 15, 2026
TB @ CLE
2 - 3
Oct 13, 2026
CLE @ TB
1 - 3
Season Statistics Comparison
Cleveland
CLE
vs
Tampa Bay
TB
162
Games Played
162
4.19
Runs / Game
▲
4.54
.239
Avg (AVG)
▲
.258
.316
On-Base (OBP)
▲
.326
.380
Slugging (SLG)
▲
.402
.696
OPS
▲
.728
162
Home Runs
▲
169
Key Model Drivers
Hits (L5)
+31.8% more
Tampa Bay: 9.0
vs
Cleveland: 6.9
Total Bases (L5)
+31.1% more
Tampa Bay: 12.4
vs
Cleveland: 9.5
Strikeouts (L5)
+19.9% more
Tampa Bay: 8.7
vs
Cleveland: 7.2
Runs per Game (Season)
+8.4% more
Tampa Bay: 4.5
vs
Cleveland: 4.2
Post-Mortem Analysis
Metric
Projected
Actual
Score Game
CLE Score
3.2
3
TB Score
5.2
7
Team Stats Splits (Home / Away)
Errors
0.1 / 0.6
0.0 / 0.0
Hits
9.0 / 6.9
7.0 / 7.0
Home Runs
0.4 / 0.6
2.0 / 0.0
Strikeouts
8.7 / 7.2
3.0 / 4.0
Total Bases
12.4 / 9.5
14.0 / 9.0
Walks
2.1 / 2.6
6.0 / 5.0
Public Market Splits
Moneyline
Open: +113 / -137
→
+136 / -148
↑
Spread (ATS)
Open: +1.5 / -1.5
→
+1.5 / -1.5
Total (O/U)
Open: 6.5
→
7
↑
Situational Trends
📊 Win-Loss
CLE
90-83-0
(52.0%)
Margin: 0.1
ATS +/-:
TB
Advantage
106-70-0
(60.2%)
Margin: 0.5
ATS +/-:
🎯 ATS (Spread)
CLE
(49.7%)
Margin: 0.1
ATS +/-:
TB
Advantage
(54.0%)
Margin: 0.5
ATS +/-:
⚖️ Over/Under
CLE
84-88-1
O: 48.8% / U: 51.2%
Total +/-: +0.5
TB
81-89-6
O: 47.7% / U: 52.3%
Total +/-: +0.6
Season to Date Model Accuracy
AI Model
SIM Engine
TB
CLE
TB
CLE
ML
60%
37-25
59%
34-24
48%
30-32
40%
23-35
ATS
48%
30-32
52%
30-28
52%
32-30
52%
30-28
TTL
44%
26-33-3
59%
33-23-2
46%
27-32-3
34%
19-37-2
Contextual Game News

St. Joseph Football Stuns New Canaan with 21-14 Victory, Ending …

SNY Layoffs: Jerry Blevins 'Heartbroken' as SportsNite and Baseb…
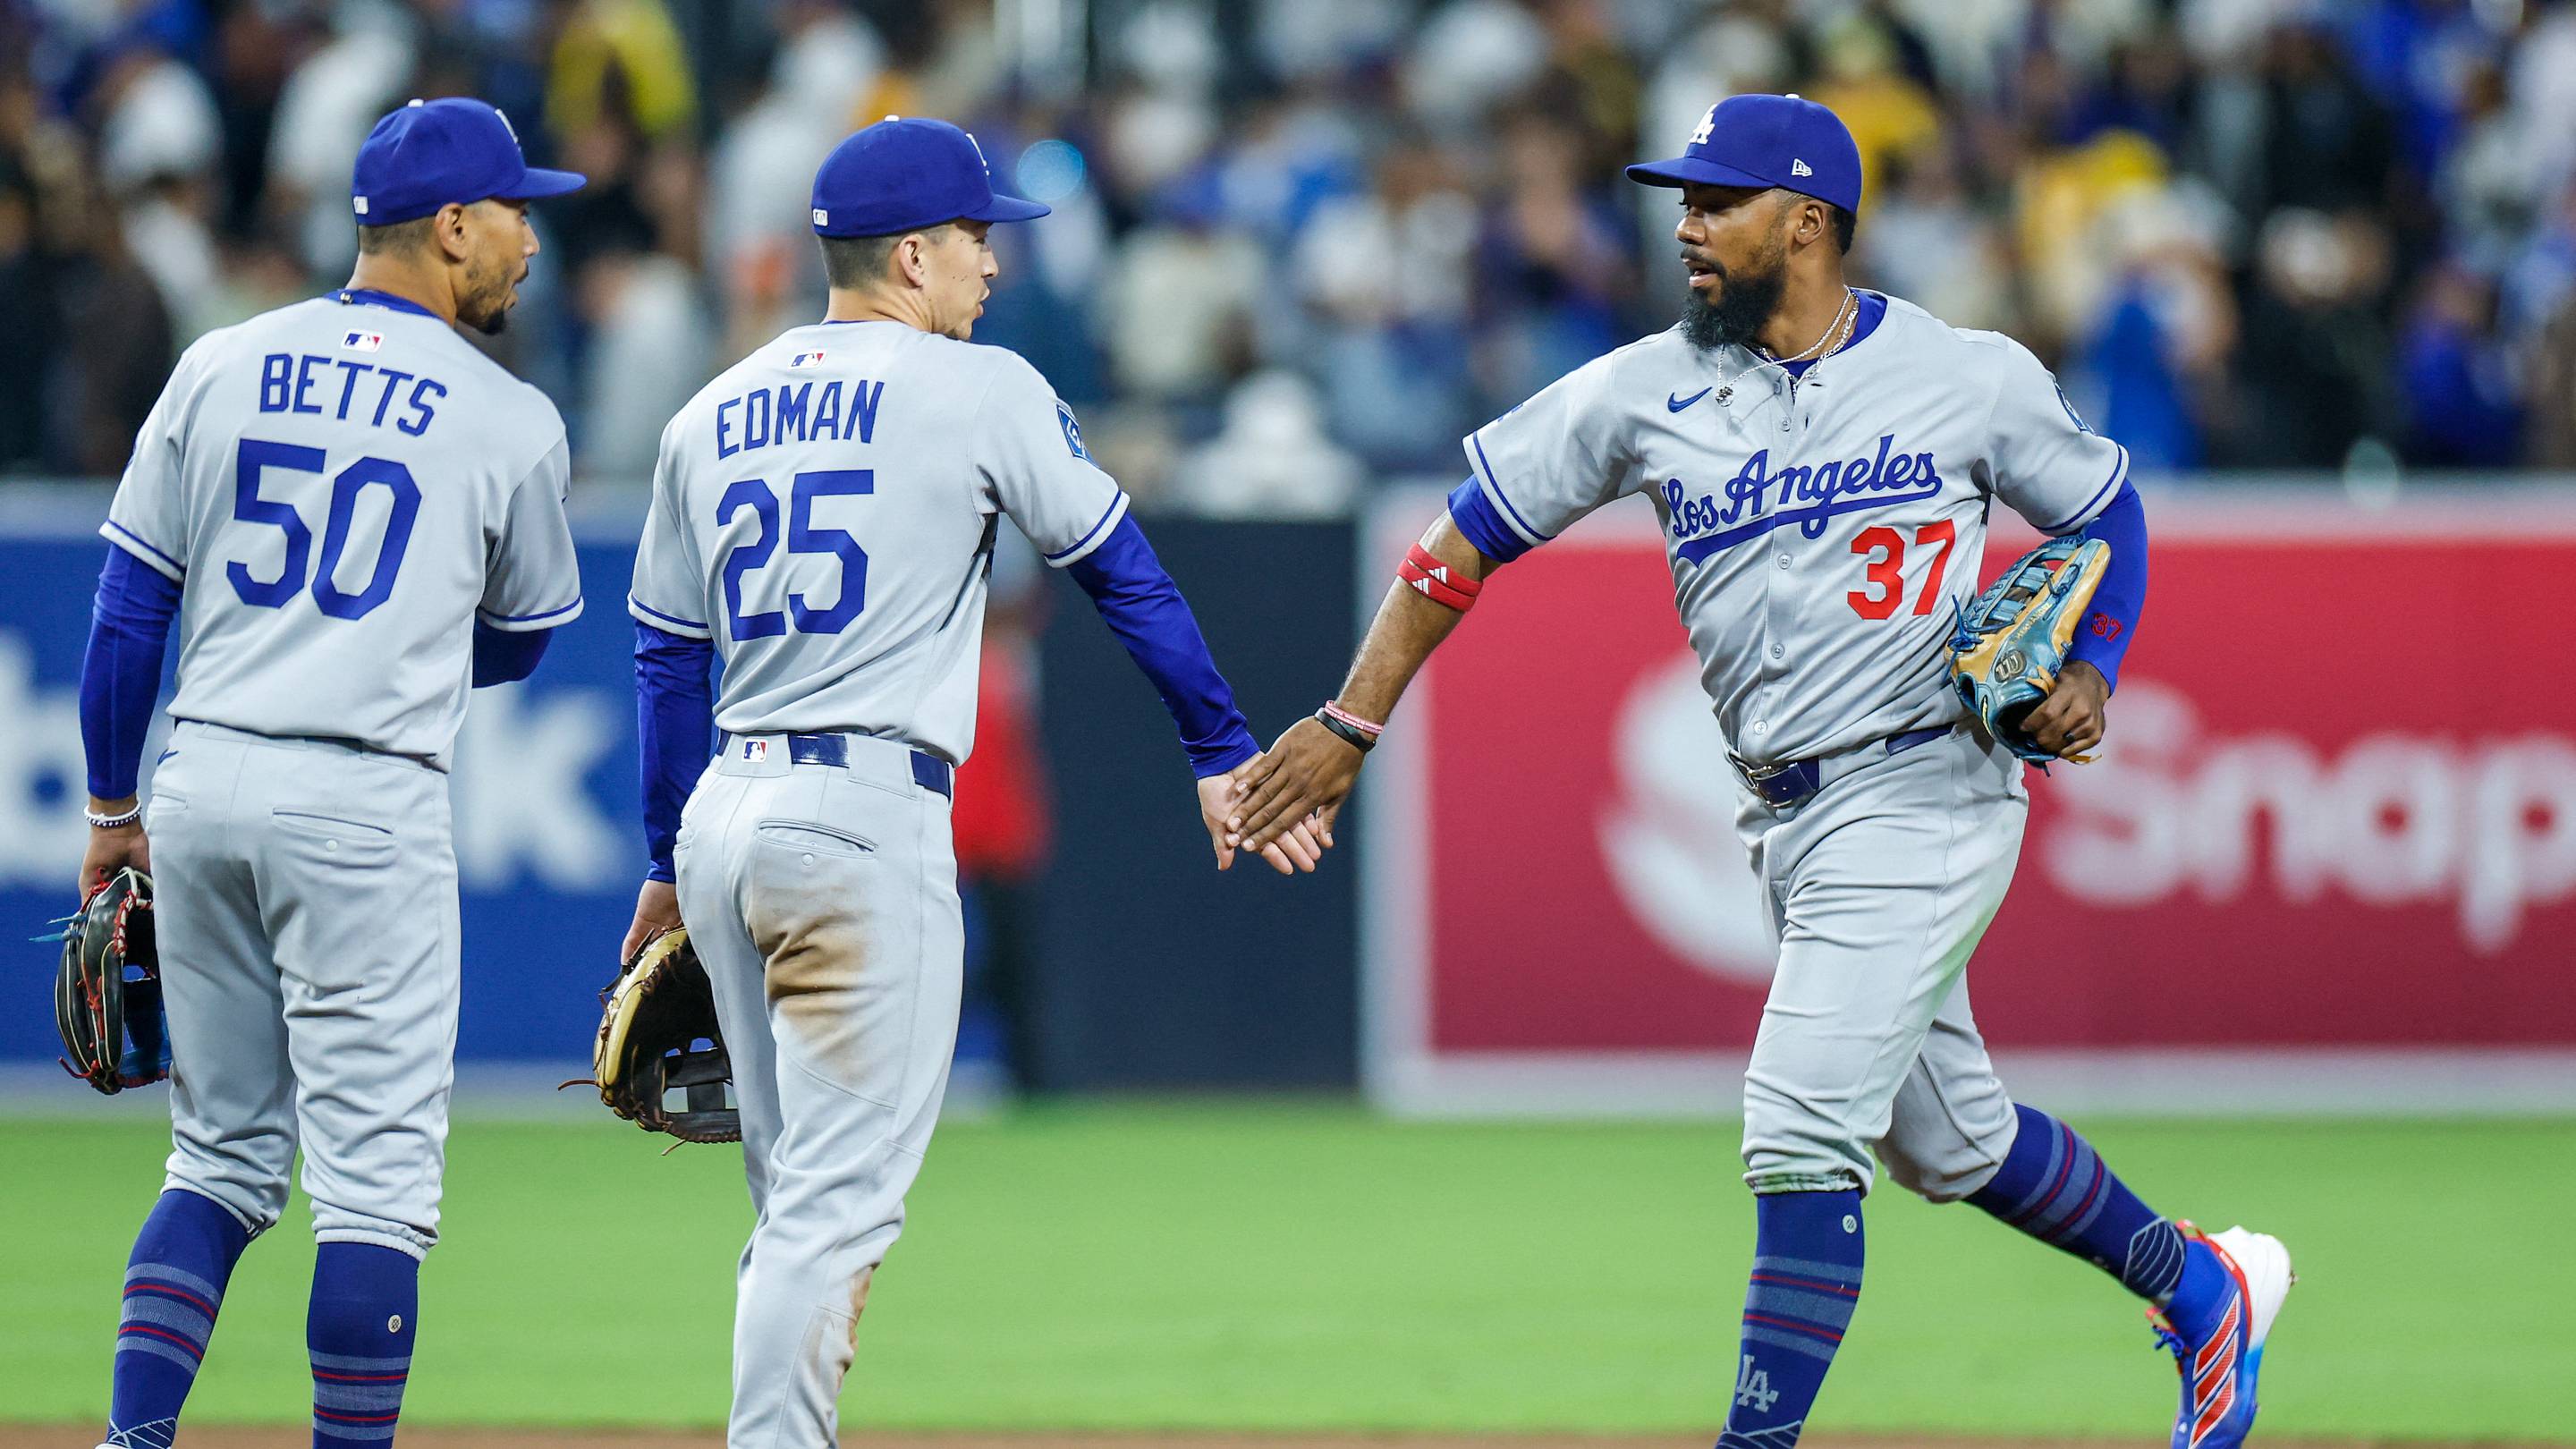
Dodgers' Second Base Conundrum: Who Will Step Up in 2027?

Baseball's Looming Lockout: Why a Salary Cap Showdown Threatens …

Red Wings Host Golden Knights: Goalie Injury, Lineup Shakeup, an…