


NORTHERN ILLINOIS
N ILLINOISNIU
0-8 | Road
24

UNLV
UNLVUNLV
5-3 | Home
31
Key Game

KEY GAME
Jake Ference
#36 | Punter@

KEY GAME
Matt Choules
#26 | Punter| Player | |
|---|---|
| Jake Ference | None-None |
| Matt Choules | None-None |
None-None
W-L
None-None
AI Model Win Probability
N ILLINOIS
11%
UNLV
89%
▲ Edge: +2.70% (NIU)
N ILLINOIS
8%
Book Odds: +1100
UNLV
95%
Book Odds: -2083
AI Model Projected Total
AI Projection
52.0
Projected
Book Total
55.5
Over / Under Line
▼
Edge: +3.5 (Under)
Over 55.5
43%
Under 55.5
57%
AI Model Spread Expectation
AI Spread Proj
-22.0
UNLV
Book Spread
-21.5
Book Line
▲ Edge: +0.5 points (UNLV)
Spread Distribution
AI Model
+42+28+140-14-28-42
Distribution centered around UNLV -22.0 expected margin.
Margin of Victory (UNLV)
NIU By 1-6 points
3.3%
NIU By 7-13 points
1.5%
UNLV By 1-6 points
7.2%
UNLV By 7-13 points
13.8%
AI Model Projected Score
Northern Illinois
15
NORTHERN ILLINOIS
Book Implied: 17
UNLV
37
UNLV
Book Implied: 38.50
Simulated Score
Northern Illinois
18
NORTHERN ILLINOIS
Book Implied: 17
UNLV
30
UNLV
Book Implied: 38.50
Projections Grades
Moneyline (ML)
Agreement
👑 Top Selection
AI
UNLV
Win
89% Win Prob
A
Sim
UNLV
Win
88% Win Prob
A
Point Spread (ATS)
Divergence
AI
UNLV (-21.5)
Loss
Proj Spread: -22.0
D
Sim
N Illinois (+21.5)
Win
Proj Spread: +12.0
A
Over/Under (Total)
Agreement
AI
u55.5
Win
Proj Total: 52.0
C
Sim
u55.5
Win
Proj Total: 48.0
A
Head-to-Head History
Date
Game
Score
Oct 31, 2026
NIU @ UNLV
24 - 31
Sep 5, 2015
UNLV @ NIU
30 - 38
Sep 13, 2014
NIU @ UNLV
48 - 34
Key Model Drivers
Rushing Yards (L5)
+30.4% more
UNLV: 160.6
vs
Northern Illinois: 123.1
Third Down Efficiency (L5)
+24.0% more
UNLV: 0.5
vs
Northern Illinois: 0.3
First Downs (L5)
+15.2% more
UNLV: 19.7
vs
Northern Illinois: 17.1
Total Yards (L5)
+12.6% more
UNLV: 353.3
vs
Northern Illinois: 313.7
Post-Mortem Analysis
Metric
Projected
Actual
Score Game
NIU Score
15.0
24
UNLV Score
37.0
31
Team Stats Splits (Home / Away)
First Downs
19.7 / 17.1
22.0 / 24.0
Rushing Yards
160.6 / 123.1
204.0 / 240.0
Third Down Efficiency
0.5 / 0.3
0.45 / 0.53
Time of Possession
0.5 / 0.4
0.41 / 0.59
Total Yards
353.3 / 313.7
473.0 / 493.0
Turnovers
1.6 / 2.2
2.0 / 1.0
Public Market Splits
Moneyline
Open: +1400 / -3226
→
+1100 / -2083
↓
Spread (ATS)
Open: +24.5 / -24.5
→
+21.5 / -21.5
↓
Total (O/U)
Open: 52.5
→
55.5
↑
Situational Trends
📊 Win-Loss
NIU
0-10-0
(0.0%)
Margin: -20.3
ATS +/-: -6.9
UNLV
Advantage
6-4-0
(60.0%)
Margin: 0.8
ATS +/-: -1.7
🎯 ATS (Spread)
NIU
3-7-0
(30.0%)
Margin: -20.3
ATS +/-: -6.9
UNLV
Advantage
5-5-0
(50.0%)
Margin: 0.8
ATS +/-: -1.7
⚖️ Over/Under
NIU
4-6-0
O: 40.0% / U: 60.0%
Total +/-: +1.9
UNLV
3-7-0
O: 30.0% / U: 70.0%
Total +/-: -2.0
Season to Date Model Accuracy
AI Model
SIM Engine
UNLV
NIU
UNLV
NIU
ML
40%
4-6
90%
9-1
50%
5-5
90%
9-1
ATS
30%
3-7
50%
5-5
70%
7-3
60%
6-4
TTL
40%
4-6
60%
6-4
30%
3-7
50%
5-5
Contextual Game News

Ole Miss Star Running Back Kewan Lacy Out for Season with Should…

Ole Miss Fans Relish Lane Kiffin's LSU Struggles, Then Face Thei…
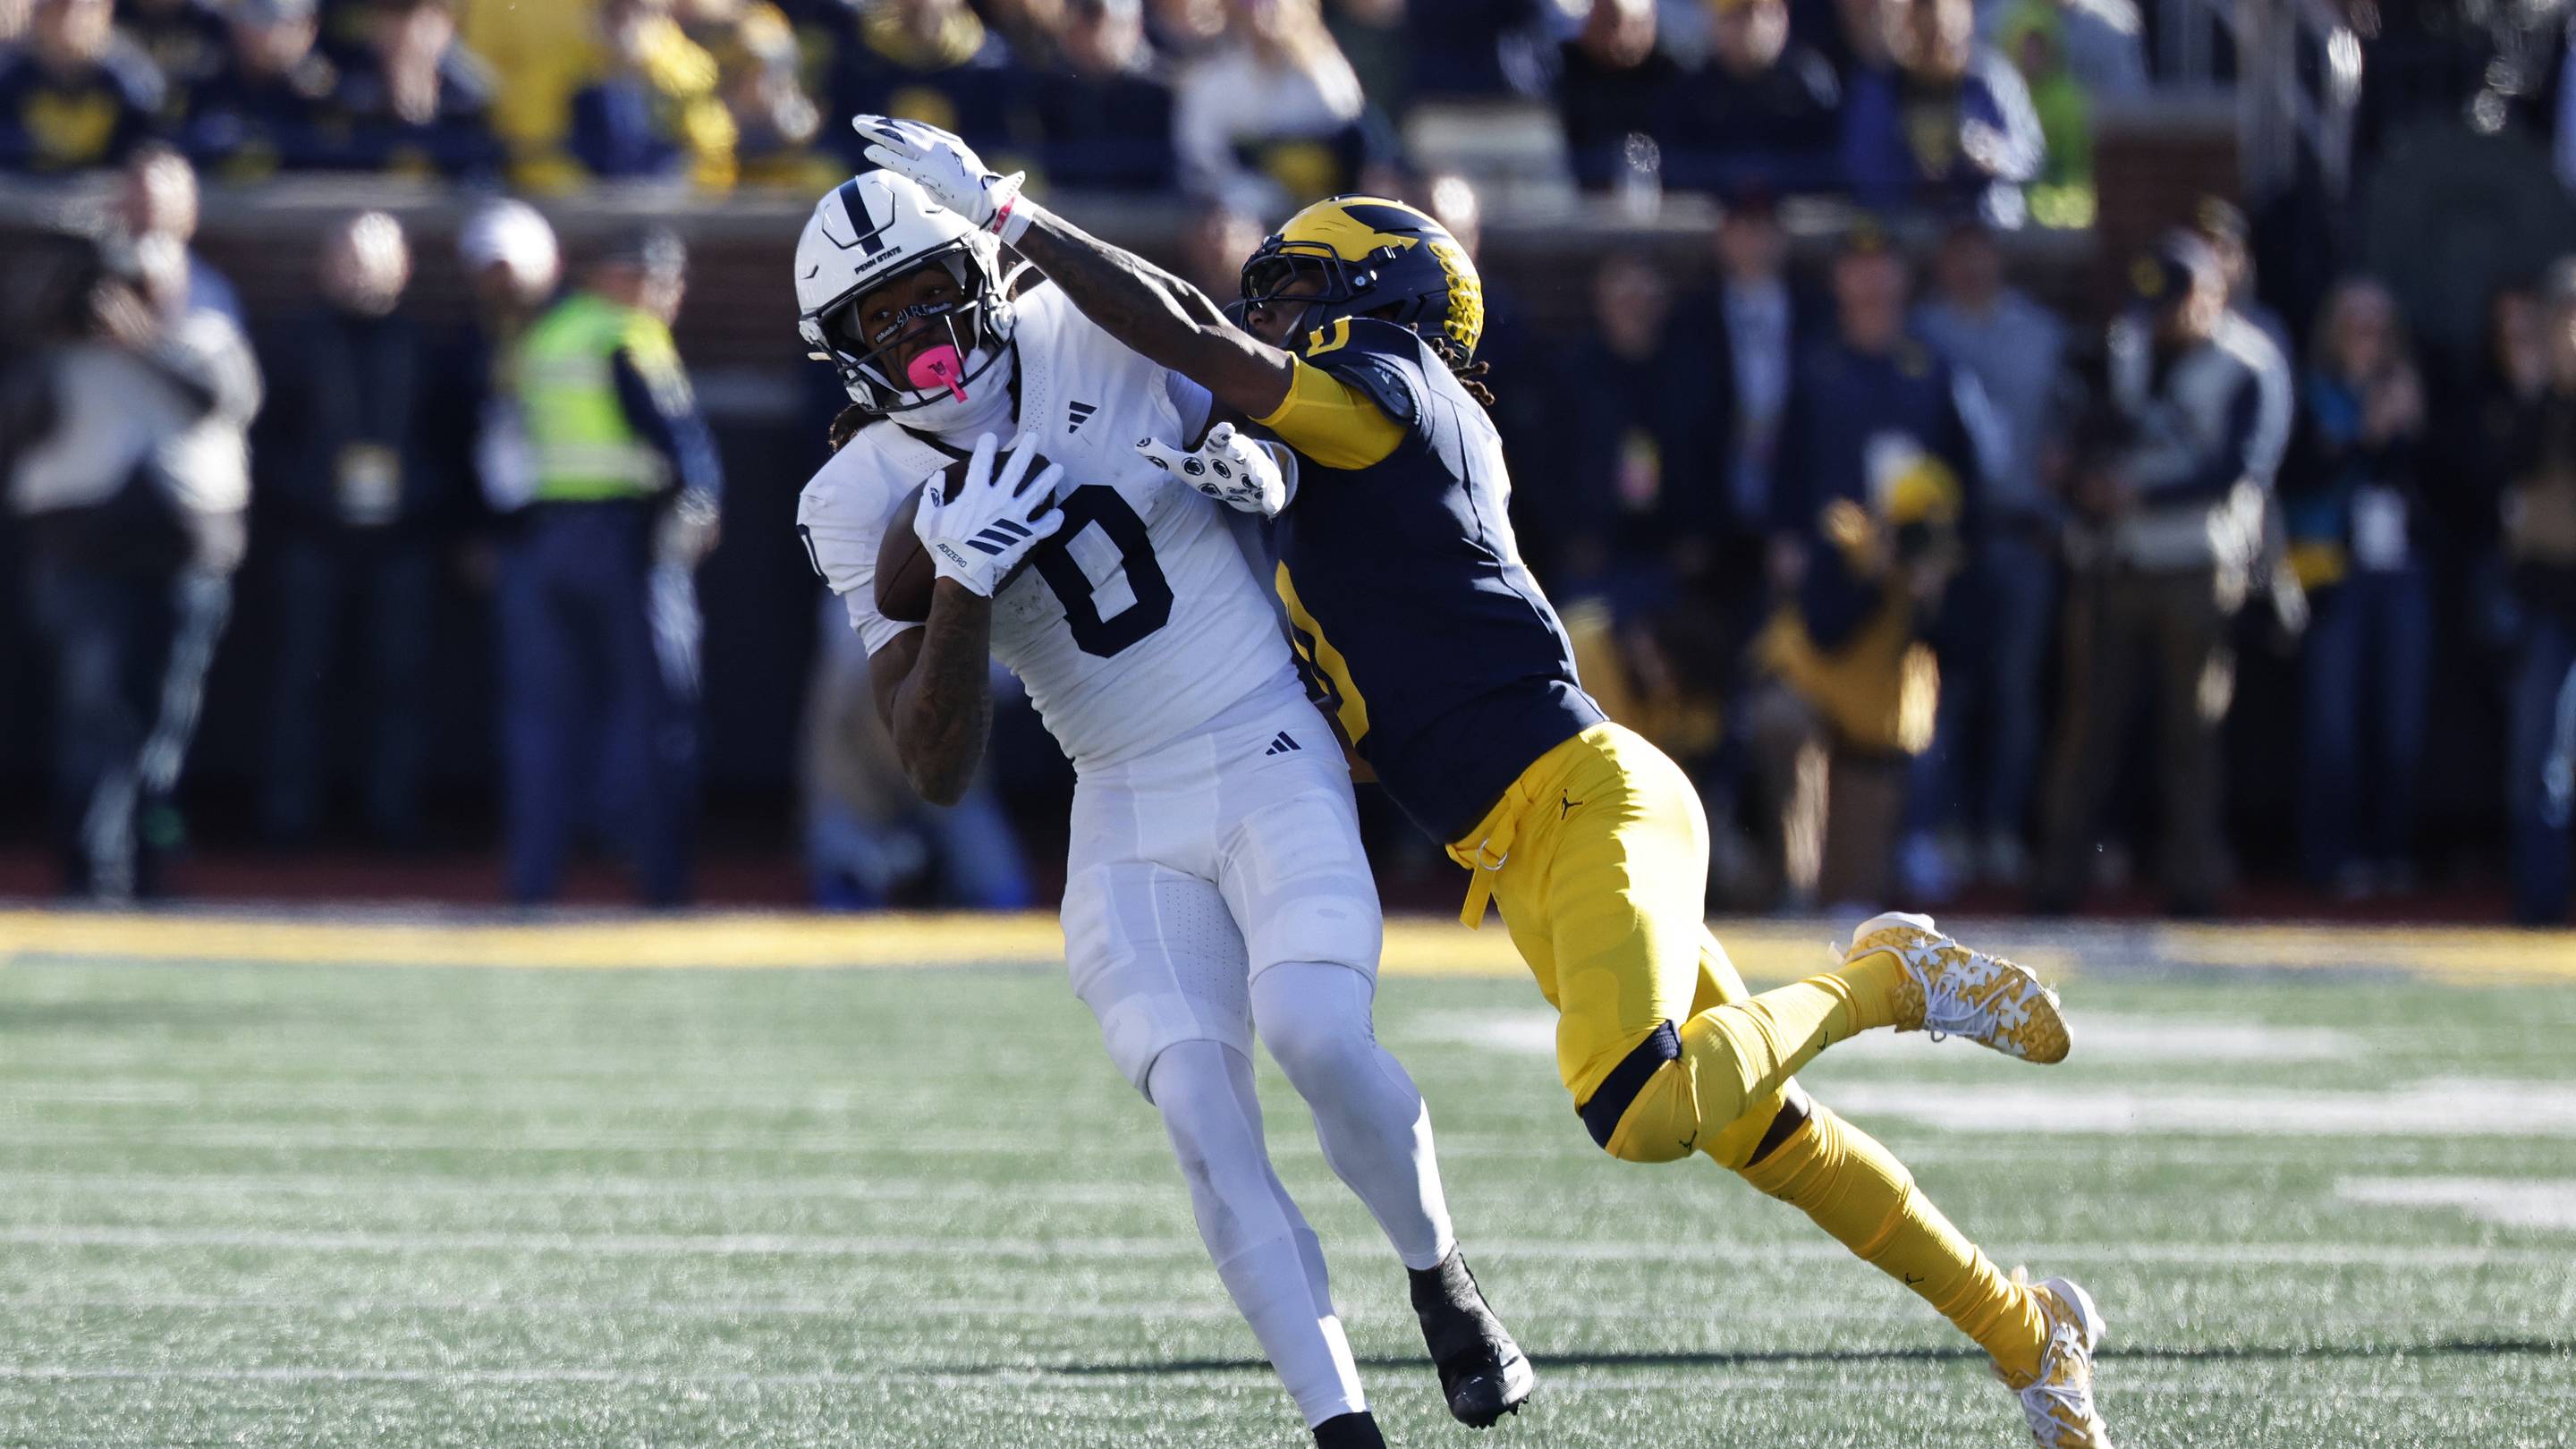
Penn State's Thin Receiver Corps Faces Tough Test at Washington
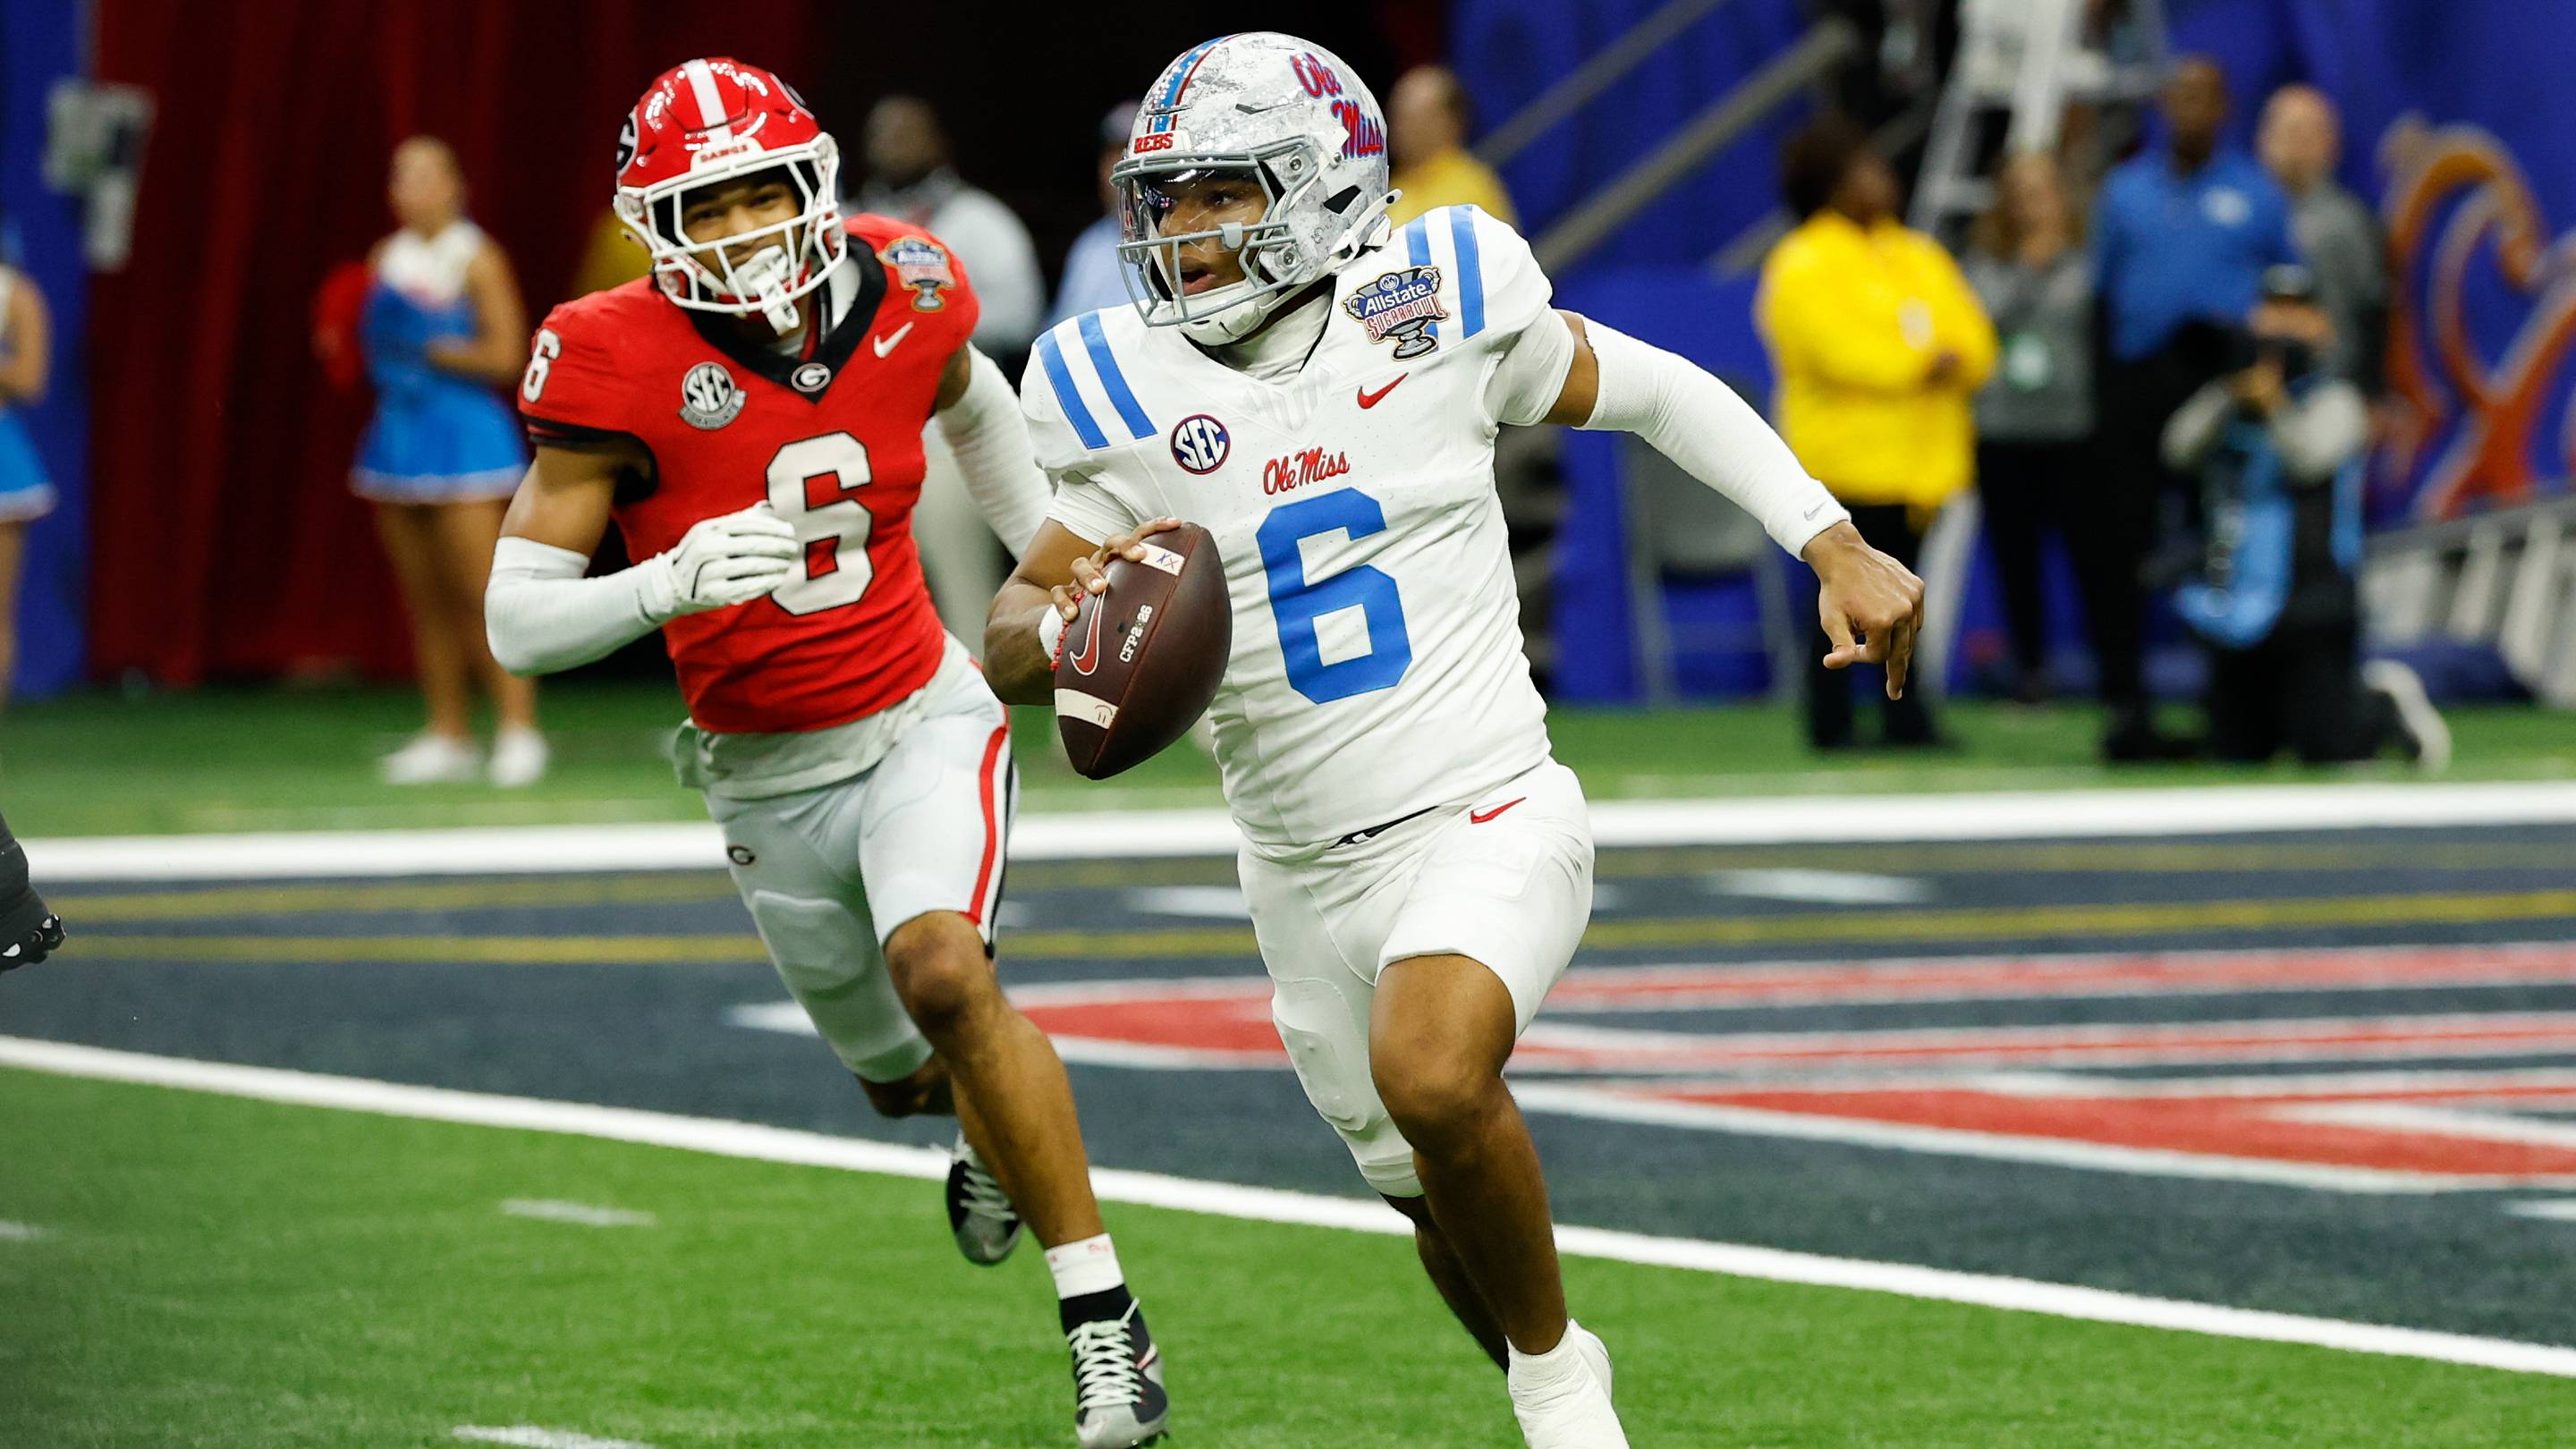
Ole Miss vs. Georgia: Staff Predictions and Score Projections fo…
Illinois Scouting Report: Key Stats and Storylines Ahead of Nebr…