



MILWAUKEE
BREWERSMIL
103-59 | Road
6


LOS ANGELES
DODGERSLAD
100-62 | Home
2
Probable Pitchers

STARTING PITCHER
Robert Gasser
#54 | Starting Pitcher@

STARTING PITCHER
Blake Snell
#7 | Starting Pitcher| Player | W-L | ERA | WHIP | IP | K |
|---|---|---|---|---|---|
| Robert Gasser | 0-0 | 2.25 | 1.00 | 4.0 | 3 |
| Blake Snell | 0-0 | 2.45 | 2.18 | 3.2 | 5 |
0-0
W-L
0-0
2.25 Ldr
ERA
2.45
1.00 Ldr
WHIP
2.18
4.0 Ldr
IP (Innings Pitched)
3.2
3
K (Strikeouts)
Ldr 5
AI Model Win Probability
BREWERS
44%
DODGERS
56%
▲ Edge: +5.20% (MIL)
BREWERS
39%
Book Odds: +156
DODGERS
64%
Book Odds: -175
AI Model Projected Total
AI Projection
8.4
Projected
Book Total
7.0
Over / Under Line
▲
Edge: +1.4 (Over)
Over 7.0
60%
Under 7.0
40%
AI Model Spread Expectation
AI Spread Proj
-2.0
LOS ANGELES
Book Spread
-1.5
Book Line
▲ Edge: +0.5 points (Los Angeles)
Spread Distribution
AI Model
+12+8+40-4-8-12
Distribution centered around LAD -2.0 expected margin.
Margin of Victory (LAD)
MIL By 1-2 runs
13.6%
MIL By 3-4 runs
7.8%
LAD By 1-2 runs
19.6%
LAD By 3-4 runs
18.4%
AI Model Projected Score
Milwaukee
3.2
MILWAUKEE
Book Implied: 2.80
Los Angeles
5.2
LOS ANGELES
Book Implied: 4.20
Simulated Score
Milwaukee
6
MILWAUKEE
Book Implied: 2.80
Los Angeles
5
LOS ANGELES
Book Implied: 4.20
Projections Grades
Moneyline (ML)
Divergence
AI
Dodgers
Loss
56% Win Prob
D
Sim
Brewers
Win
61% Win Prob
C
Run Line (ATS)
Divergence
AI
Dodgers (-1.5)
Loss
Proj Runs: -2.0
C
Sim
Brewers (+1.5)
Win
Proj Runs: -1.0
A
Over/Under (Total)
Agreement
👑 Top Selection
AI
o7.0
Win
Proj Total: 8.4
B
Sim
o7.0
Win
Proj Total: 11.0
A
Head-to-Head History
Date
Game
Score
Oct 15, 2026
MIL @ LAD
6 - 4
Oct 14, 2026
MIL @ LAD
6 - 2
Oct 12, 2026
LAD @ MIL
4 - 7
Oct 11, 2026
LAD @ MIL
1 - 2
Aug 16, 2026
MIL @ LAD
6 - 2
Season Statistics Comparison
Milwaukee
MIL
vs
Los Angeles
LAD
162
Games Played
162
5.14
▲
Runs / Game
4.94
.258
▲
Avg (AVG)
.257
.341
▲
On-Base (OBP)
.338
.403
Slugging (SLG)
▲
.424
.743
OPS
▲
.762
154
Home Runs
▲
204
Key Model Drivers
Home Runs (Season)
+32.5% more
Los Angeles: 204.0
vs
Milwaukee: 154.0
Slugging Pct (Season)
+2.1%
Los Angeles: 42.4%
vs
Milwaukee: 40.3%
OPS (Season)
+1.9%
Los Angeles: 76.2%
vs
Milwaukee: 74.3%
Errors (L5)
+41.4% more
Milwaukee: 1.2
vs
Los Angeles: 0.7
Post-Mortem Analysis
Metric
Projected
Actual
Score Game
MIL Score
3.2
6
LAD Score
5.2
2
Team Stats Splits (Home / Away)
Errors
0.7 / 1.2
0.0 / 0.0
Hits
5.6 / 9.4
5.0 / 9.0
Home Runs
0.7 / 0.8
0.0 / 3.0
Strikeouts
8.4 / 9.1
8.0 / 12.0
Total Bases
8.3 / 13.0
6.0 / 18.0
Walks
3.3 / 4.8
4.0 / 2.0
Public Market Splits
Moneyline
Open: +137 / -166
→
+156 / -175
↑
Spread (ATS)
Open: +1.5 / -1.5
→
+1.5 / -1.5
Total (O/U)
Open: 7.5
→
7
↓
Situational Trends
📊 Win-Loss
MIL
Advantage
114-61-0
(65.1%)
Margin: 1.4
ATS +/-:
LAD
103-67-0
(60.6%)
Margin: 1.2
ATS +/-:
🎯 ATS (Spread)
MIL
Advantage
(53.7%)
Margin: 1.4
ATS +/-:
LAD
(42.4%)
Margin: 1.2
ATS +/-:
⚖️ Over/Under
MIL
78-92-5
O: 45.9% / U: 54.1%
Total +/-: +0.8
LAD
75-90-5
O: 45.5% / U: 54.6%
Total +/-: +0.1
Season to Date Model Accuracy
AI Model
SIM Engine
LAD
MIL
LAD
MIL
ML
54%
92-77
61%
104-67
48%
81-89
53%
90-81
ATS
58%
98-71
56%
95-76
44%
75-95
49%
83-88
TTL
49%
80-83-6
41%
67-96-8
45%
73-91-6
51%
83-80-8
Contextual Game News

Cody Bellinger Snags Second Career Gold Glove, Yankees Cheer the…

Dodgers Eyeing Elly De La Cruz: Trade Buzz Builds as Free Agency…
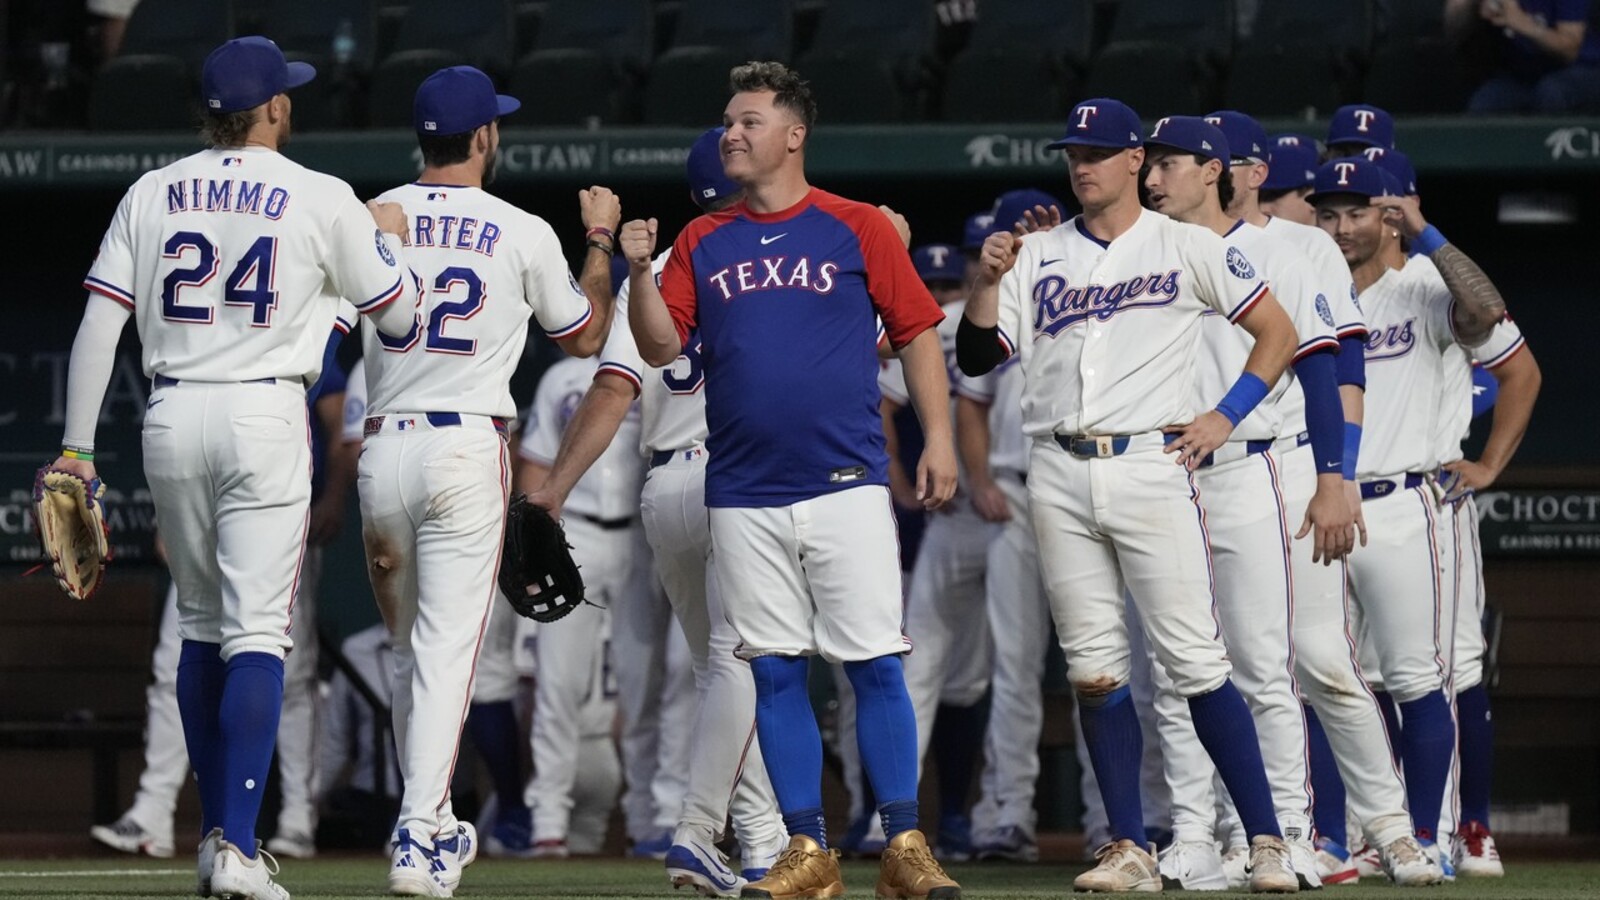
Rangers Cut Ties with Pederson, Higashioka, Junis as $30.5M in O…
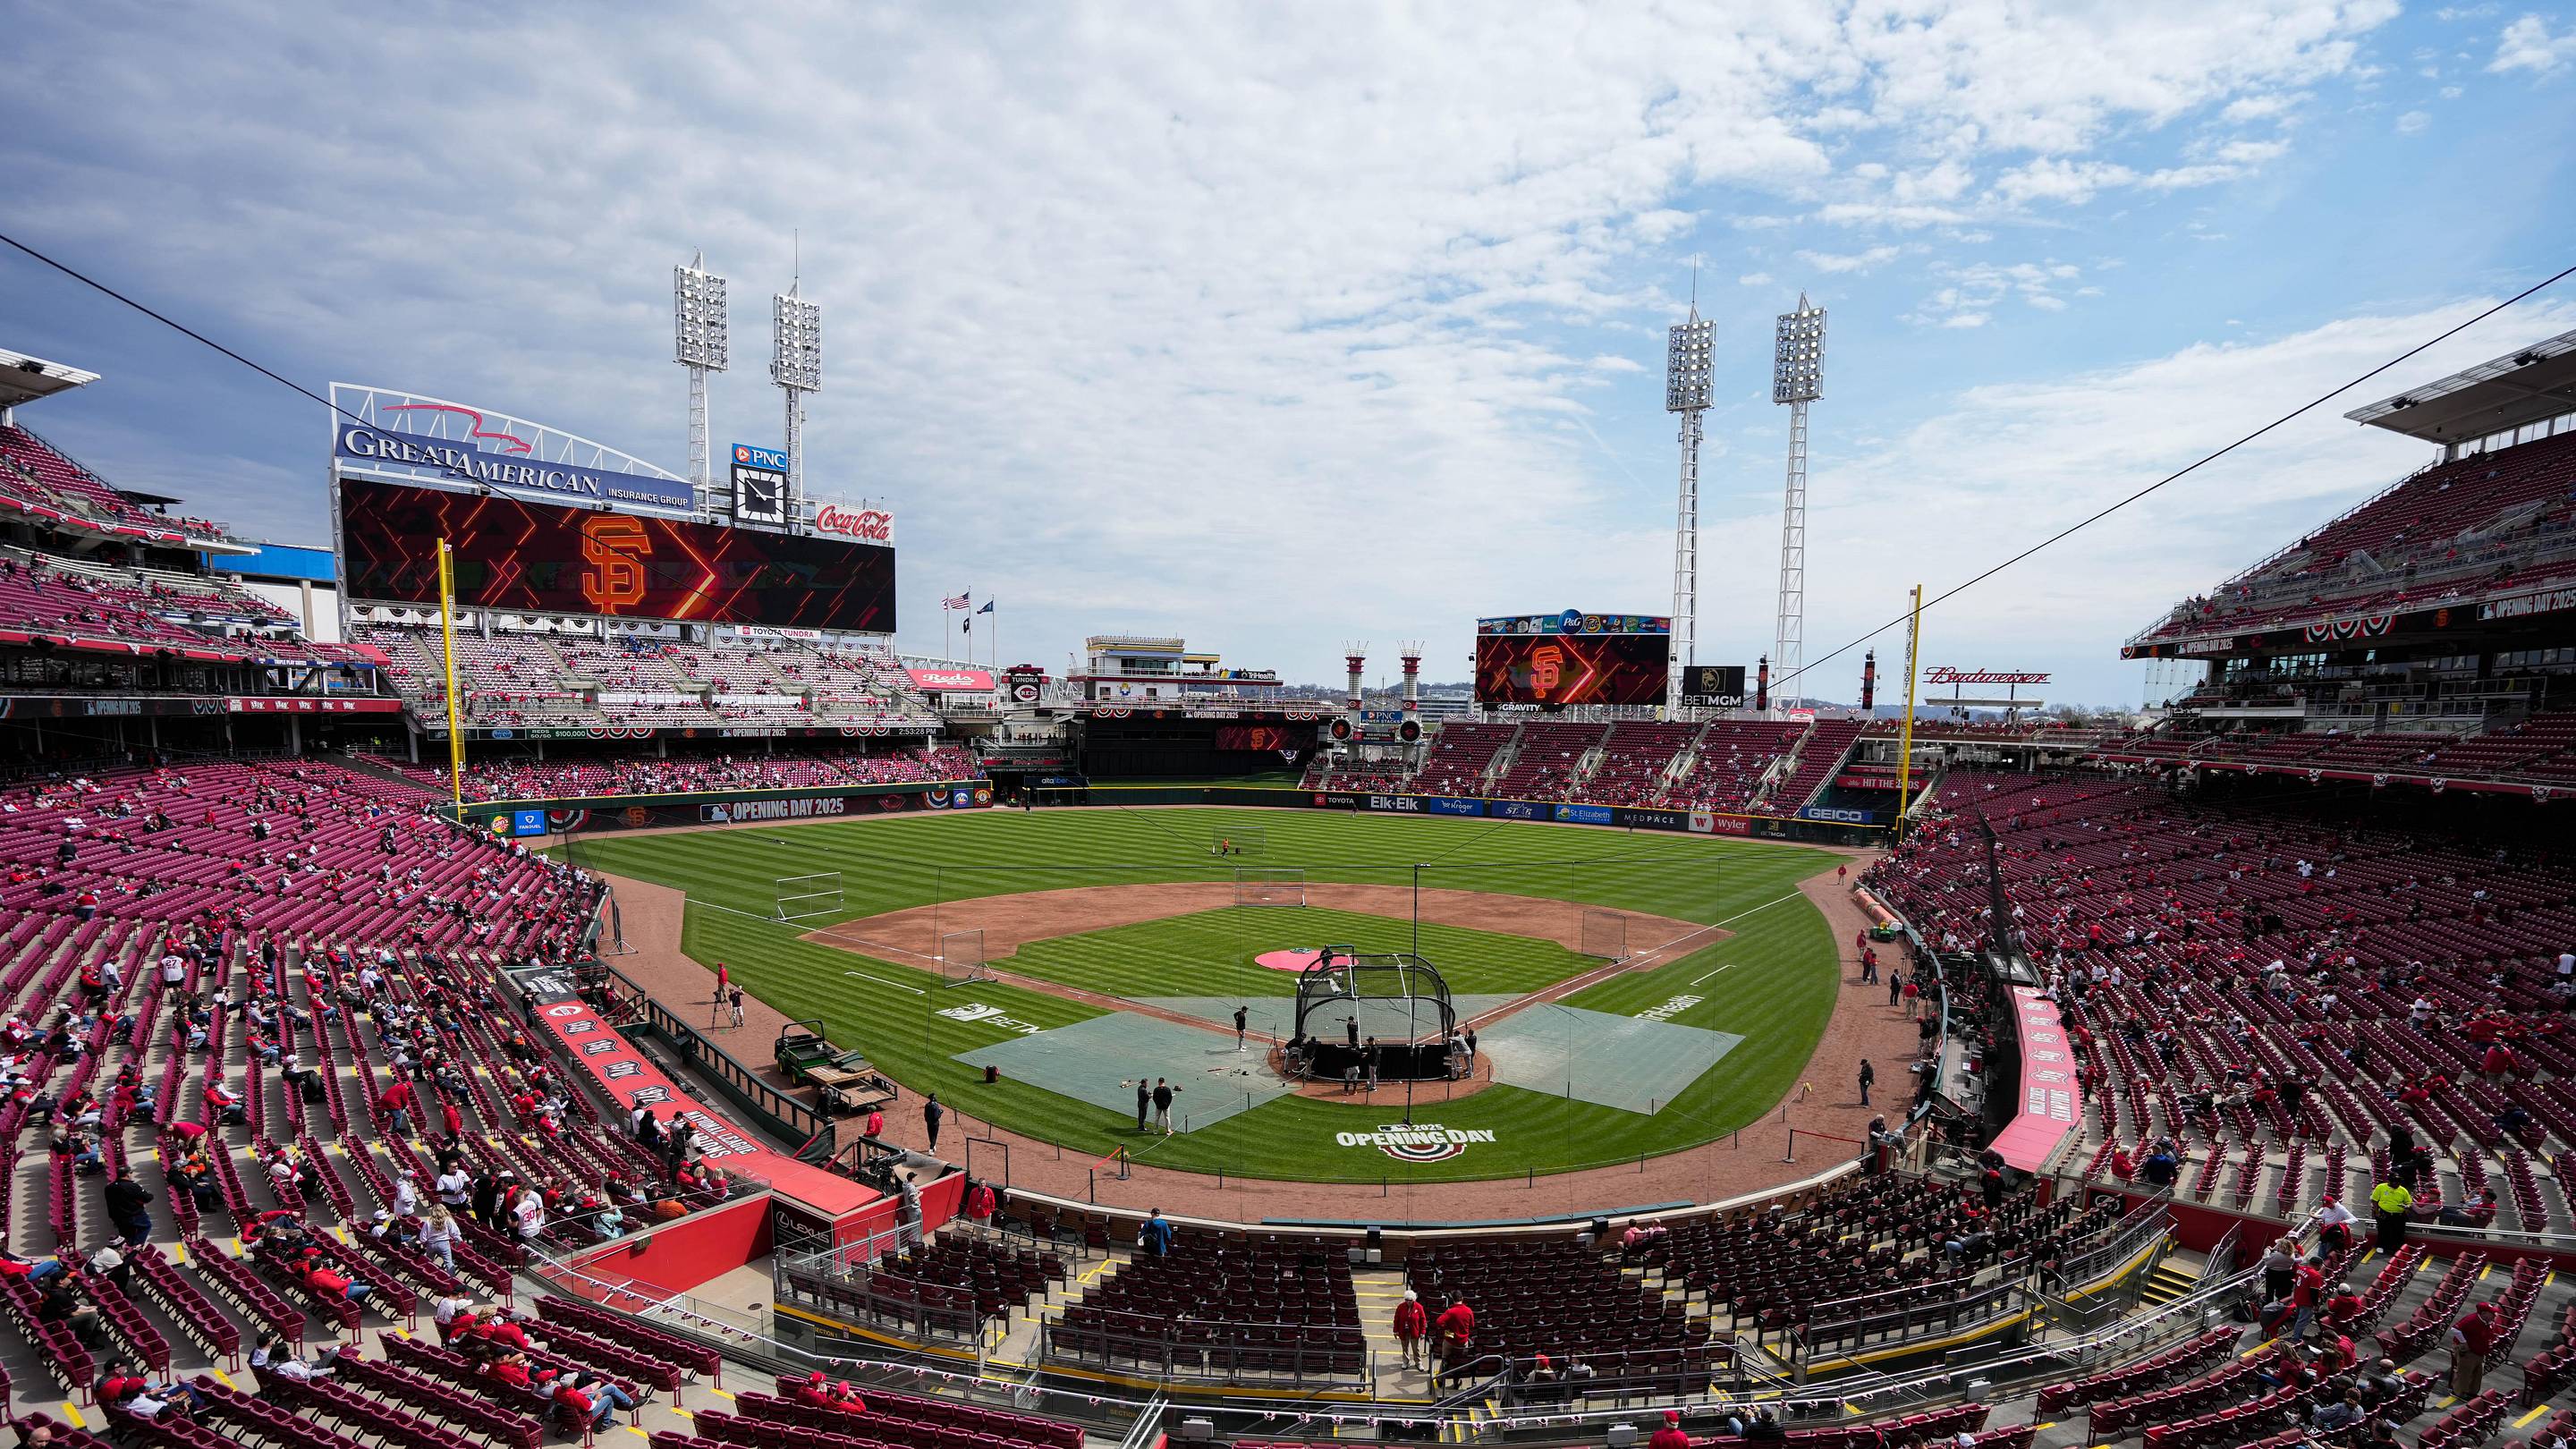
Reds' Offseason Windfall: $33 Million Freed as Cincinnati Eyes B…

Reds' Elly De La Cruz Trade Talk: Dodgers Target Superstar Who T…